By Lorena Benitez
Our latest blog post is from Lorena Benitez, who recently worked in JNCC’s Ecosystem Analysis Team as an intern. Lorena’s internship focused on sustainable consumption and particularly development of the Global Environmental Impacts of Consumption (GEIC) indicator. As the latest update to the GEIC indicator is released, as part of the annual update of the UK Biodiversity Indicators, Lorena provides us with some background to the development of one of the indicator metrics, the LIFE Score, introduced in the 2024 update.
Understanding how our everyday decisions to buy products impact the environment is a complex task. Since 2018, JNCC in collaboration with Stockholm Environment Institute (SEI) have developed the Global Environmental Impacts of Consumption (GEIC) indicator to quantify the impacts that consumption in the UK and other countries has on the environment globally. The GEIC indicator allows you to explore how the production of commodities like palm oil impact on factors such as deforestation and water use in countries around the world.
The GEIC indicator also quantifies how agricultural land-use for commodity production (such as growing coffee) impacts biodiversity, using several metrics. These include ‘species richness weighted area’ and ‘predicted species loss’. Last year (the 2024 data release), a new biodiversity metric was added to the GEIC indicator, called the LIFE Score (Land-cover change Impacts on Future Extinctions), with the recent 2025 data release updating it to extend the time series. This metric allows us to calculate the impact that agricultural land has on the probability that a species will go extinct in the next 100 years. One advantage the LIFE Score has over the other metrics is that it accounts for the fact that habitat loss is cumulative and its impacts on species are non-linear. Currently, the LIFE Score is calculated for more than 30,000 terrestrial vertebrate species across the globe.
What is the theory behind the LIFE Score?
To calculate the LIFE Score for a single species, we need to understand the full extent of where the species could exist if humans were absent (right climate and habitat type), and where it is currently found. We also need a map identifying areas of relevant habitat types that have been converted by humans. This information is used to make a curve that represents the extinction risk for all possible habitat extents, from 100% potential habitat to complete habitat loss. The current extent occupied by the species is placed on the curve as a proportion of the potential habitat. From there, different scenarios can be tested to see how each scenario would affect the likelihood of a species going extinct (Figure 1). Extinction risk increases rapidly as the space that the species occupies is reduced. Using this approach, species that are common and found across different habitat types have the lowest probability of going extinct. Species that are rare and are only found in a very small area have the highest chance of going extinct.
The LIFE Score uses species range maps to individually calculate global extinction risk for 30,875 species based on land-cover maps and data on each species’ habitat preferences. The model can run simulations to calculate the impact that converting natural vegetation to agricultural land or restoring farmland to natural habitat has on the expected number of species’ extinctions within 100 years. For example, the model can run simulations to see how changing the use of a parcel of land impacts all the species that are known to occur there (see Figure 1). The change in extinction risk is calculated separately for each species in that area, then those numbers are summed to give the total LIFE Score, which serves as an estimate of how many species are likely to go extinct based on a conversion event (natural vegetation areas being turned into agricultural land) or how many species are likely to be saved by restoration (farmland being restored to natural habitat). Land-use change in areas of higher species richness and endemism will have a higher LIFE score, as more species are impacted.
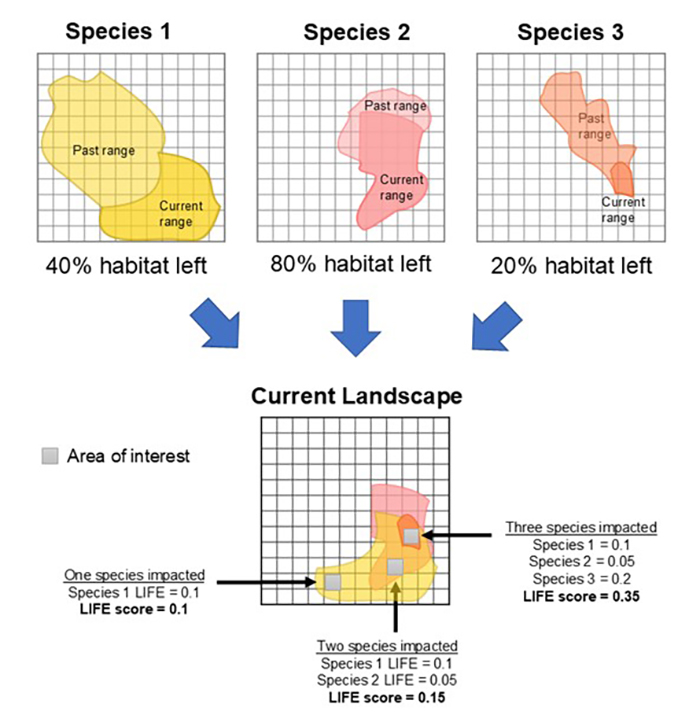
Figure 1: Example species range maps for a landscape with three species. Each species only has a percentage of its original range left. Species 3 has the highest chance of going extinct because only 20% of its habitat is left. Areas with more species and rarer species have the highest LIFE Scores.
Attributing the LIFE Score to specific commodities
By specifically linking extinction risk to land-use change, the LIFE Score allows us to determine which commodities are driving extinction of species across the globe. The GEIC indicator uses the data on the potential restoration of current agricultural lands to estimate the impact on biodiversity of the commodities grown there. The LIFE score in the GEIC indicator therefore represents the ‘opportunity cost’ of land that is currently agricultural, by calculating the potential to lower extinction risk if agricultural land were restored to a natural habitat type.
Currently, JNCC and SEI have calculated the impacts of over 160 agricultural commodities on global species extinction risk using the LIFE Score for the year 2020. This impact has been scaled based on consumption data to obtain annual estimates between 2005 and 2023. In 2023, consumption from the UK was linked to a LIFE Score of 3.3 – which equates to 3.3 extinctions over the next 100 years that could be avoided if the land used to meet the UK’s consumption was restored to natural habitat. Maize, soya beans and wheat consumption are shown to contribute the most to the UK’s extinction risk (see Figure 2).
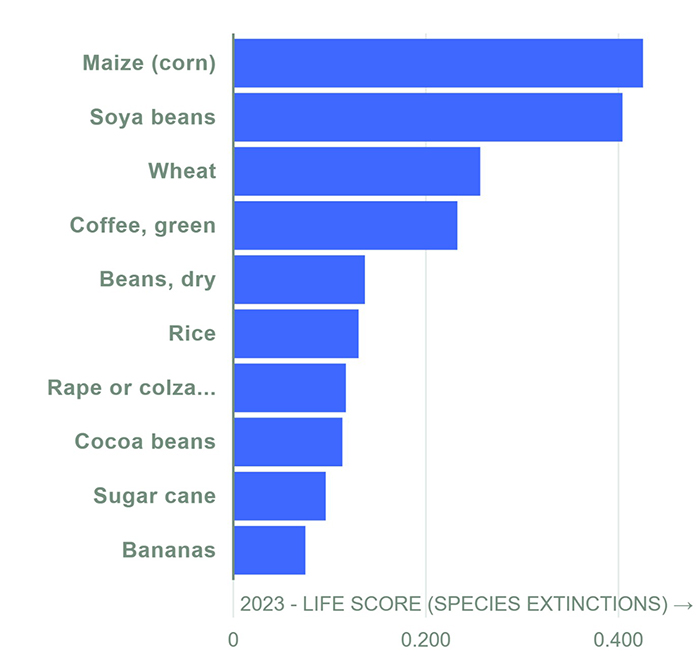
Figure 2. Bar chart showing the top ten commodities contributing to the UK’s LIFE Score in the year 2023.
You can also use the GEIC dashboard to explore how consumption in other countries has an impact on species extinction risk.
What next for the LIFE Score in the GEIC Indicator?
The LIFE Score provides a powerful tool for assessing the impact of land-use change on biodiversity. Its incorporation into the GEIC indicator allows it to become a tool for informing governments on their biodiversity footprint related to commodity consumption. SEI and JNCC are continually working to improve the indicator to better understand the environmental impacts of consumption. Going forwards, we are looking to incorporate more data across multiple years to generate more accurate LIFE Score estimates across the time series of the indicator.
Future iterations of the LIFE Score in the GEIC indicator aim to calculate the direct impact of further deforestation on increasing species extinctions. The indicator already links annual consumption of commodities to the specific deforestation events that they cause using the DeDuCe model. These data could then be linked with LIFE Score data on conversion of land from natural habitat to arable lands, which would provide an estimate of how continued consumption is impacting species globally.
Look out for future blogs and the annual updates to the GEIC indicator to find out more about our ongoing work in this area and other improvements being made to GEIC, such as the recent release of a prototype metals and minerals dataset.
Published: