UK Air Pollution Assessment Service (UK APAS): Questions & Answers
The UK Air Pollution Assessment Service (UK APAS) was previously named the UK AERIUS project. However, as of April 2023, based on user research, the project has been renamed UK APAS to better reflect what it will offer. UK APAS is an output of the overarching Integrating Tools for Air Pollution Assessment (ITAPA) project.
UK APAS is labelled as‘Get an air pollution assessment’on the public-facing Defra service Gov.UK. The public beta of the ‘Get an air pollution assessment’ service is now live. Currently only Northern Ireland applicants can use it for planning and permitting submissions, however, anyone will be able to access the tool to see how it works. The tool will be evaluated before a decision is made to roll it out further across the UK.
Use the ‘ctrl + f’ function to locate questions and answers of interest in the webpage, using key words to search.
General Questions
How can the UK Air Pollution Assessment Service (UK APAS) be used?
UK APAS aims to assist with risk assessment for decision making on individual plans or projects seeking permission from competent authorities. There may be an opportunity to use the initial pilot tool for a wider assessment of multiple sources depending on the model choice. Data generated by the service will likely contribute to national assessment through providing geographical detail about activity for emission sources.
In the UK there are typically separate screening tools used before detailed modelling. The service output will act in the capacity of both "screening model" and "detailed modelling" combined. The final UK APAS detailed model output is expected to be similar to that which is currently used for decision making about whether to allow a new emission source.
Who oversees UK APAS and updates it?
As with any software, a product owner is required that will oversee updates to UK APAS and ensure that security and technological aspects are fit for purpose. This would likely be the Government Body hosting the software and is expected to be centralised. A video explains how changes are made in AERIUS in The Netherlands.
Would this service be available at no cost to local authorities?
In The Netherlands the AERIUS Calculator is free at the point of use. There are commercial aspects subject to a fee such as AERIUS Connect that facilitate large consultancies interfacing with the AERIUS system. A decision is required about what cost, if any, would be applied for a UK service. However, in the Business Case all options for charging were considered and even in the 'no cost to the end user' scenario cost savings through saved time for regulators, local authorities and applicants were significant.
As AERIUS is open source is there a large development community contributing to its further enhancement?
The AERIUS software is open source as it is paid for through public money and needs to be transparent in its implementation. However, it has a unique use and thus limited interest from those improving open-source software. Any changes would need to be conducted through the AERIUS change process. A video explains how changes are made in AERIUS in The Netherlands.
Where can I see a demonstration of AERIUS?
A short video is available that explains how AERIUS Calculator works or please get in touch.
What options were considered when deciding to pursue a UK integrated risk assessment service like AERIUS? Was there demand for something less technical?
Based on the user needs gathered during the initial phase of the project and subsequent expert advice, different options were considered. Technical solutions explored included a 'signposting' document, a data portal, shared metadata for existing data sources and a service for assessing project impacts on habitat.
What are the next steps?
The initial phase is to build a pilot tool, with the aim of comparing this with existing UK risk assessment approaches. The dispersion model selection is part of this pilot tool build phase. The UK APAS project will work with UK experts to ensure that these adapted elements and the data required works within the UK version of AERIUS. A further phase is planned (subject to funding) that will address finalisation of the service for external use.
How can our organisation get involved?
Contact us to express interest in the project. Participation could be take of the form of keeping informed about UK APAS updates or could extend to broader contribution of technical advice, user testing, validation and facilitating stakeholder engagement. To keep informed, please ask to sign up to the UK APAS Mailing List. More detailed involvement will be subject to funding. Email your interest and we will get in touch at the appropriate time.
Technical Questions
Can UK APAS use a large variety of deposition velocities?
UK APAS can use whichever input data is provided to support the chosen dispersion model. Theoretically, UK APAS could implement many deposition velocities assigned to each habitat type. As part of any UK implementation, input data will represent best available evidence, be agreed and then the results validated to ensure a service is fit for purpose.
Does UK APAS include habitat data, such as qualifying features?
Yes, an inherent part of the AERIUS calculator process is to compare the habitat sensitivity to air pollution (e.g. critical load) with the predicted deposition for the areas of habitat affected.
Currently the Dutch AERIUS implementation does not include habitat condition data but it is theoretically possible to supply where the data is available. This could form part of a data improvement programme to assist with decision-making through an integrated tool in the longer term rather than part of an initial implementation due to the UK variation in this dataset.
What habitat information is included in UK APAS?
As with tools in the UK like Simple Calculator for Atmospheric Impact Limits (SCAIL), UK APAS includes habitat classifications and critical loads. UK APAS habitat maps are currently based on Habitats Directive Annex I habitats. This could be expanded to other habitat types or classifications and/or adapted for UK country specific needs.
Does UK APAS include information about each habitat and its critical load and level, in the same way that the UK Air Pollution Information System does?
Yes, UK APAS includes this data as it is essential in undertaking the risk assessment of air pollution and effects on ecosystems.
How are new sources incorporated into Dutch AERIUS?
When a permit is issued through the Dutch AERIUS this is entered into the inventory in the AERIUS Register. These are entered in real time and taken from the budget of room for development in that location. A short video explains how the AERIUS Calculator works and how permits are issued.
How is information about sources in The Netherlands updated – for example, if a source stops operating or improves their emission profile?
Where a permit exists in The Netherlands, the operator benefits from updating their entry with the reduced emission from their area as this frees up room for development.
In The Netherlands many activities including small changes in the number of animals require registration on the AERUIS system. These are reviewed annually and updated in AERIUS Register to ensure room for development calculations are current.
Dutch AERIUS pre-dated General Data Protection Regulations (GDPR), have changes had to be made to the system to hold personal data in a secure way?
In the AERIUS Calculator, no personal information is recorded. The calculations are not stored within the system but can be exported by users. However, when applicants print a pdf report, the pdf report must be available to download for a certain time. This will mean the application details are held during this time and deleted after a certain time (e.g. 48 hours). When applicants submit a pdf report for approval, this is when GDPR increases in relevance because data is saved in AERIUS Register. With AERIUS Register, a large amount of personal data is stored. There will be a nation-wide system for decision-makers to securely log-in, as well as an audit trail.
What is the complexity of the meteorological data included in the Dutch AERIUS Tool?
The Dutch AERIUS tool has six different meteorological regions. Each of these has their own meteorological dataset used in the calculation. This is averaged over multiple years in a similar way to current UK tools and also to what is required by the OPS model used in Dutch AERIUS. It is technically possible to alter this and incorporate more detailed wind rose data to create very small "regions" (e.g. mountainous areas). Whilst this is not technically complex to achieve, there is an additional computational cost to consider. Any model used in a UK service would be validated and ensure that outputs and methods were fit for purpose.
Does Dutch AERIUS record the mitigation measures made to reduce nitrogen deposition/pollution (activity recording)?
Yes, The Netherlands use AERIUS to determine the reduction resulting from policy measures. Therefore, the system you base the amount of "room for development" on are the same as you use when deciding on individual permits. More discussion on this is required.
How does Dutch AERIUS handle transboundary pollution?
The contribution of pollutants from outside of The Netherlands is incorporated into AERIUS through the background concentration and deposition maps. This method is the same as we use in the UK for current tools and to fulfil obligations under the Convention for Long Range Transboundary Air Pollution as outlined in the Mapping Manual.
How robust are the results from Dutch AERIUS Calculator?
The results from AERIUS Calculator have undergone several technical reviews including suitability studies. Results are considered sufficient to inform decision-making for new emission sources. There is challenge to how the Dutch Government outlines what is or is not acceptable. However, the results from the tool are considered robust for use in Netherlands. For a UK service, validation is planned to ensure any implementation is fit for purpose with comparably robust outputs when contrasted with currently available tools.
Can UK APAS provide outputs such as contours of change or coloured polygons?
Yes, it provides maps showing the variation in concentration and deposition. Unlike the typical UK representation using grid squares, it uses hexagons. Hexagons separate easily into contours and are easier to scale than squares.
Why does UK APAS use hexagons over grid squares?
Hexagons separate easily into contours and are easier to scale than squares. Hexagons can portray a more accurate representation of areas with curved edges than grid squares. This is demonstrated in Figure 1 (de Sousa et al, 2006, p.193).

Figure 1: Area coverage of a circle by a grid square and hexagon (de Sousa et al, 2006, p.193)
The hexagon captures less area outside the circle area compared to the grid square, therefore more accurately represents the area of interest. This can be scaled up to more closely follow a protected site boundary (Figure 2).
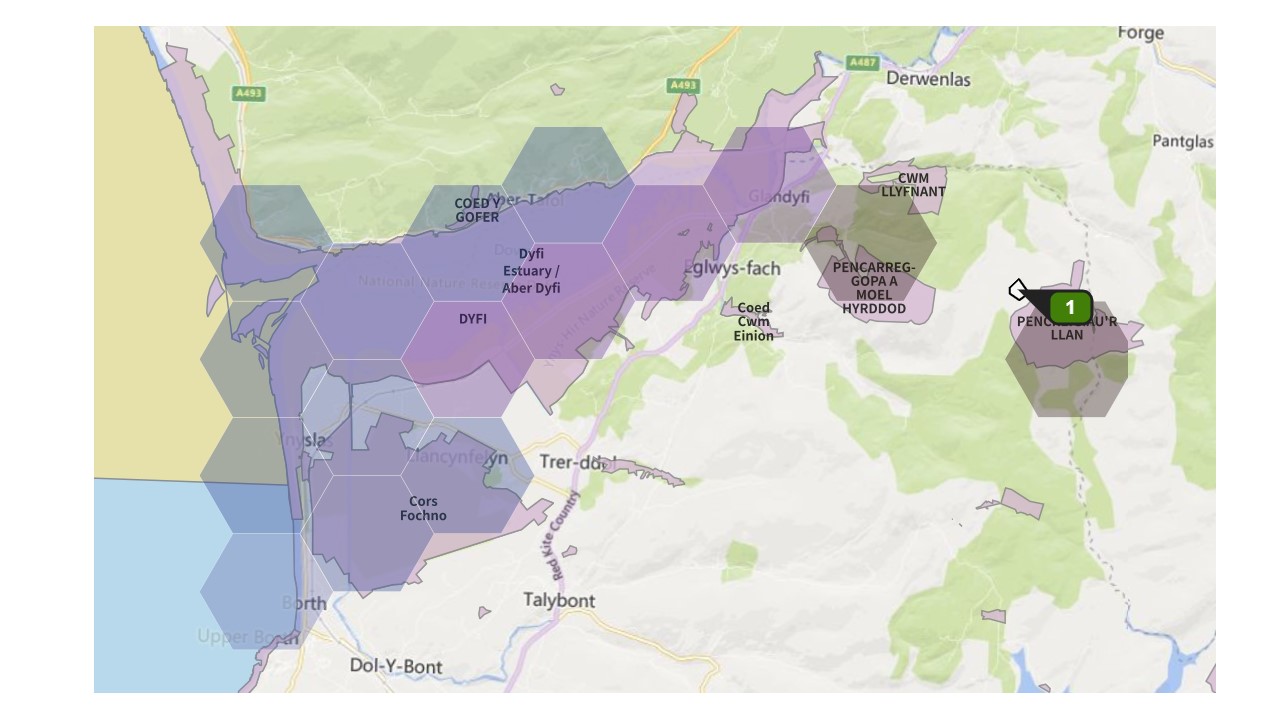

Figure 2. Comparison of protected site coverage by hexagons (top) and a regular square grid (bottom).
Is the resolution of the output data related to the needs of the decision-making?
Yes, the spatial scale in an integrated tool is ultimately defined by the decision-making process and its needs. Whilst higher resolutions could be modelled with significant additional effort, it may not be necessary to achieve the main aim of the tool. For example, existing UK tools use 1 km and 5 km resolution for several decision-making situations. However, it has been noted that a higher resolution is needed for detecting aspects such as change in roadside emissions.
What is the spatial resolution of the AERIUS model outputs?
Dutch AERIUS uses a 250 square metre hexagonal grid for deposition and a 100 square metre hexagonal grid for concentration estimates. This is influenced by policy and the needs of the assessment results.
In the UK, impacts of air pollution on protected areas arising from Local Plans must be considered. This can cover changes in traffic over a large area. Is AERIUS suitable for such an assessment and has it been used in The Netherlands in this way?
Yes, AERIUS can be used to predict road traffic at regional scale for local plans. The Dutch Government regularly use AERIUS Calculator to predict emissions from major roads and road schemes. They don’t even need to use the large data handler, AERIUS Connect.
What is the spatial scale of AERIUS outputs?
AERIUS provides deposition maps overlain on habitat at 250 m2 hexagons in AERIUS Calculator.

Figure 3: An example of the 250 m2 hexagons in the Dutch AERIUS Calculator.
Application and Functionality Questions
Does the end user/applicant or the regulatory body normally use the Dutch AERIUS?
Yes, both end users and regulatory bodies use the tool. It has functionalities for the regulatory body but also for the end user or applicant. Typically, applicants or their consultants enter the data into AERIUS Calculator and explore mitigation options in AERIUS Scenario. AERIUS Register is then used by regulators, decision-makers and advisers to supervise the emissions sources. AERIUS Monitor helps advisers, competent authorities and others get an overview of emissions around a certain area of habitat or region.
How user friendly is Dutch AERIUS? Would most farmers be able to use it or would a professional need to do it on their behalf?
Yes, there has been good success with farmers using AERIUS. AERIUS has undergone substantial user testing to ensure the interface is clear and simple to use. This is important as the data entry requires a variety of indicators to be submitted, including changes in small numbers of animals. As with many tools that include built-in use-friendly interfaces, some applicants may choose to use a consultant to operate the tool on their behalf for a variety of reasons. UK APAS has been found to streamline the process and reduce costs.
Is it possible to input user-defined emission factors?
Yes, there will be a drop-down with a selection of pre-defined emission factors to choose from but there will also be an option for the user to input their own.
Can multiple emissions sources be added? For example, an agriculture application could have up to 16 buildings/source points.
Yes, up to six different scenarios can be compared and within each scenario multiple sources can be added.
If a planning permission is granted based on this system and then not implemented, how is this considered?
Dutch AERIUS generally requires that building has to be initiated within 2 years of a permit being received. If building has not commenced within this timeframe, the permit expires. This is then accounted for in the AERIUS Register entry for the given area and the room for development increases again.
Would a UK service reflect the same functionality as Dutch AERIUS?
The UK considered the Dutch AERIUS tool to be the best cost-beneficial mechanism to meet UK user needs because of its functionality. Although elements of the tool such as the underlying dispersion model and subsequent data would need tailoring to a UK context, key aspects such as the software architecture, user interfaces and functionality would remain largely similar to the Dutch AERIUS tool.
When people have entered a new source, is there an independent QA check (for example to ensure they've used correct location, correct emission factors) and not done something that would lead to underestimating the emissions?
Yes, there are several data validation measures. Dutch AERIUS uses a formally defined information model. This checks what the applicant has entered and ensures it fits defined standards (e.g. a negative building height cannot be entered). Dutch AERIUS also uses pre-described emission factors. If applicants are not satisfied with the AERIUS data, they can also define their own emission factors. This is highlighted to the regional authority upon submission, and they ensure the data entered is coherent. Regional authorities also receive a warning if applicants try to place emission sources outside the country borders.
Can Dutch AERIUS expand to risk assessment for other parameters (odour, noise, water quality)?
Yes, AERIUS is a modular tool that can be adapted to use a model for most risk assessment applications. The Dutch Government has investigated the use of AERIUS for other Industrial Emissions Directive parameters such as dust, noise and odour.
How are high background concentrations and deposition treated in Dutch AERIUS?
AERIUS is the tool used to implement the Dutch Integrated Approach to Nitrogen. The law in The Netherlands outlines rules for how room for development is determined and this is related to the amount of nitrogen deposition in a given area (e.g. background concentrations or deposition). Where background levels are high enough to indicate there is no room for development by AERIUS Register, then a permit is cannot be issued. This determination can vary regionally within the framework outlined by the law.
Project Planning Questions
How will ITAPA project account for existing UK tools and data sources?
ITAPA is a UK-level project conducted with technical advice from the UK’s Country Nature Conservation Bodies and Regulators that produce current UK tools such as Simple Calculation of Atmospheric Impact Limits (SCAIL) and the Air Pollution Information System (APIS) website. There are improvements planned in these tools that an integrated tool could assist with, particularly mapping or digitisation of data input/output. ITAPA has existing tools and discussion about transition arrangements at the forefront of its planning.
When is UK APAS likely to be available?
The service is currently in Beta testing stages.
How can a test version of a UK integrated tool like Dutch AERIUS Calculator be implemented in a relatively short timeframe?
As UK APAS builds on the Dutch implementation the timeframe is significantly faster than if a tool were developed from scratch. Rather than being full software development, there is a significant element of "plug and play" for using a UK dispersion model and UK data. Feasibility for this was tested in earlier phases of the project.
Timelines proposed were developed with advice from the Dutch AERIUS development team who would facilitate a UK integrated tool implementation alongside a UK team. The greatest risk for timelines is considered to arise from non-technical aspects such as policy decisions. As a result of the project planning workshop feedback, the consultation and software development time has been extended.
Benefits of UK APAS
Would UK APAS mean that UK countries would no longer need to implement strategic approaches for addressing emissions around protected sites (e.g. Shared Nitrogen Action Plans)?
UK APAS would facilitate strategic approaches rather than replace them. UK APAS helps to gather and visualise emissions data and calculate effects of new emission sources or changes in existing sources. It incorporates emissions from all sectors and their contributions to a specific area. This can be used to develop strategic solutions as well as monitor progress of actions within the planned intervention.
Can UK APAS be used in strategic planning for different sectors (e.g. development plans, transport, industry) for source apportionment and accounting for strategic mitigation (e.g. modal shift in transport)?
Yes, it is specifically designed to facilitate this sort of cross-sector, large-scale consideration of emissions and their effects on protected sites or other sensitive receptors.
How can UK APAS benefit farmers and other users?
Currently UK tools and data for assessment of air pollution effects on ecosystems are held in several places. This can be confusing to navigate and difficult for applicants and decision-makers alike. Key improvements are:
- Streamline sustainable development – UK APAS is user friendly and makes the assessment, and potentially, permission process increasingly streamlined, clearer and faster. An agreed approach for risk assessment in decision making also provides more certainty for applicants about whether the proposed design would likely gain approval. This also enables decision-makers to be confident in the quality of assessment to prevent delays.
- Automatic "in-combination" assessment – UK APAS accounts for emissions from all source types and automatically performs an "in-combination" assessment.
- Ease of testing mitigation options – UK APAS enables users to input a variety of mitigation scenarios and to compare them to find the best outcome for the proposal, as well as for the environment.
- Improved national inventories – By bringing data into one place and recording source specific activity data, UK APAS enables more detailed input to the National Atmospheric Emissions Inventory. This will improve over time as existing sources are included when they seek new permissions or as part of regulatory change.
UK Implementation Questions
Would UK APAS like the Dutch AERIUS be adopted as a national standard?
As seen in the Dutch use of AERIUS, UK APAS can be used to a national standard for risk assessment. It is at the decision-making and permit issue stage that a framework can be used to account for regional or UK country variation. Ultimately the aim is to be as standardised and integrated as possible and to work on this over time.
Will training be provided when UK APAS is launched?
Yes, training and guidance will be provided and tailored through trained user testing groups. As the Dutch AERIUS tool has been in operation in The Netherlands for several years, there are a range of materials that can be adapted for use in the UK.
How are results from developers submitted to local authorities for their review?
A short video explains how AERIUS Calculator works. In the Dutch AERIUS tool, applicants or their advisers enter the data into AERIUS Calculator and can produce risk assessment reports based on their data. When the applicant is content with the report, they can submit through AERIUS and a permit may be issued to standard rules or the decision-maker is notified for review. This is then recorded in the Room for Development for the area in AERIUS Register and can be tracked by the decision-maker through and AERIUS Monitor.
How different are UK air pollution and ecosystem risk assessment needs from those in The Netherlands?
Although The Netherlands has higher ammonia concentrations and deposition than the UK, both countries have a significant proportion of their protected sites exceeding the amount of nitrogen deposition they can handle and maintain ecosystem function. Both countries need to ensure that air pollution effects on protected sites are addressed in decision making. As such, the project determined that an integrated tool such as Dutch AERIUS would be beneficial to meet UK user needs.
Will there be a standardised service across the UK?
Yes, our aim is to produce a UK service that produces a standardised risk assessment. There are some areas of variation that can be accommodated in UK APAS as they are regionally in The Netherlands. For example, variation in mapping grid or different decision rules due to different policies can be included. However, the aim is to be as integrated and harmonised as possible and to work on this over time.
Are there plans for the service to support not only assessment under The Conservation of Habitats and Species Regulations but also further tests (e.g. Imperative Reasons of Over-riding Public Interest, assessment of alternatives, and the use of compensation)?
This topic area requires further consideration and will be included in the project workshops. UK APAS is primarily suited to assist with risk assessment including the appropriate assessment stages of Habitats Regulations Assessment. This is the most common activity and further stages are rare when considered across all types of permissions. In strategic planning, the assessment process may reach the later stages of Habitat Regulations Assessment as a matter of course.
Parts of the data gathering and visualisation in UK APAS could be helpful for these later stages. There are opportunities to use the UK APAS Scenario function to explore alternatives and verify whether there is a solution. The mapping facility could also help with recording and monitoring compensation areas and not duplicating records when counting.
Categories:
Published: