
Abundance of wild birds
Last updated: 2026
Latest data available: 2025
Introduction
The indicator shows relative changes in the abundance of common native birds of farmland and woodland and of freshwater and marine habitats in the UK. Bird populations have long been considered to provide a good indication of the broad state of wildlife in the UK. This is because they occupy a wide range of habitats and respond to environmental pressures that also operate on other groups of wildlife. In addition, there are considerable long-term data on trends in bird populations, allowing for comparison between short-term and long-term changes. Because they are a well-studied taxonomic group, drivers of change for birds are better understood than for some other species groups, which enables interpretation of observed changes.
The relative changes in abundances of birds presented here form an indicator for the UK and an equivalent indicator for England is published separately. Both indicators are derived from the Wild bird populations in the UK and England, 1970 to 2025, an accredited official statistic published annually. The publication includes more detailed information, including a breakdown of sub habitat specific indices and individual species trends.
There have been changes to this publication. For further information, see the Development plan section.
Data for this indicator can be found in the published datafile. See the Guide to species indicators for more information about species-based indicators.
Type of indicator
State indicator
Type of official statistics
Accredited Official Statistics

Assessment of change
| Index | Time period | Long-term trend |
Short-term trend |
|---|---|---|---|
| All breeding bird species | 1970 to 2025 | Deteriorating | Deteriorating |
| Farmland | 1970 to 2025 | Deteriorating | Deteriorating |
| Seabirds | 1986 to 2025 | Deteriorating | Deteriorating |
| Upland | 1994 to 2025 | Deteriorating | Deteriorating |
| Wetland | 1975 to 2025 | Little or no overall change | Little or no overall change |
| Wintering waterbirds | 1975/76 to 2024/25 | Improving | Little or no overall change |
| Woodland | 1970 to 2025 | Deteriorating | Little or no overall change |
Notes on the indicator assessment
- Long-term and short-term assessments of the statistical significance of these changes are made using the smoothed data to 2025.
- Analysis of the underlying trends is undertaken by the data providers.
- ‘Long-term’ refers to an assessment of change since the earliest date for which data are available; this varies among indicators and among individual species.
- ‘Short-term’ refers to an assessment of change over the latest five years for which data are available.
Key results
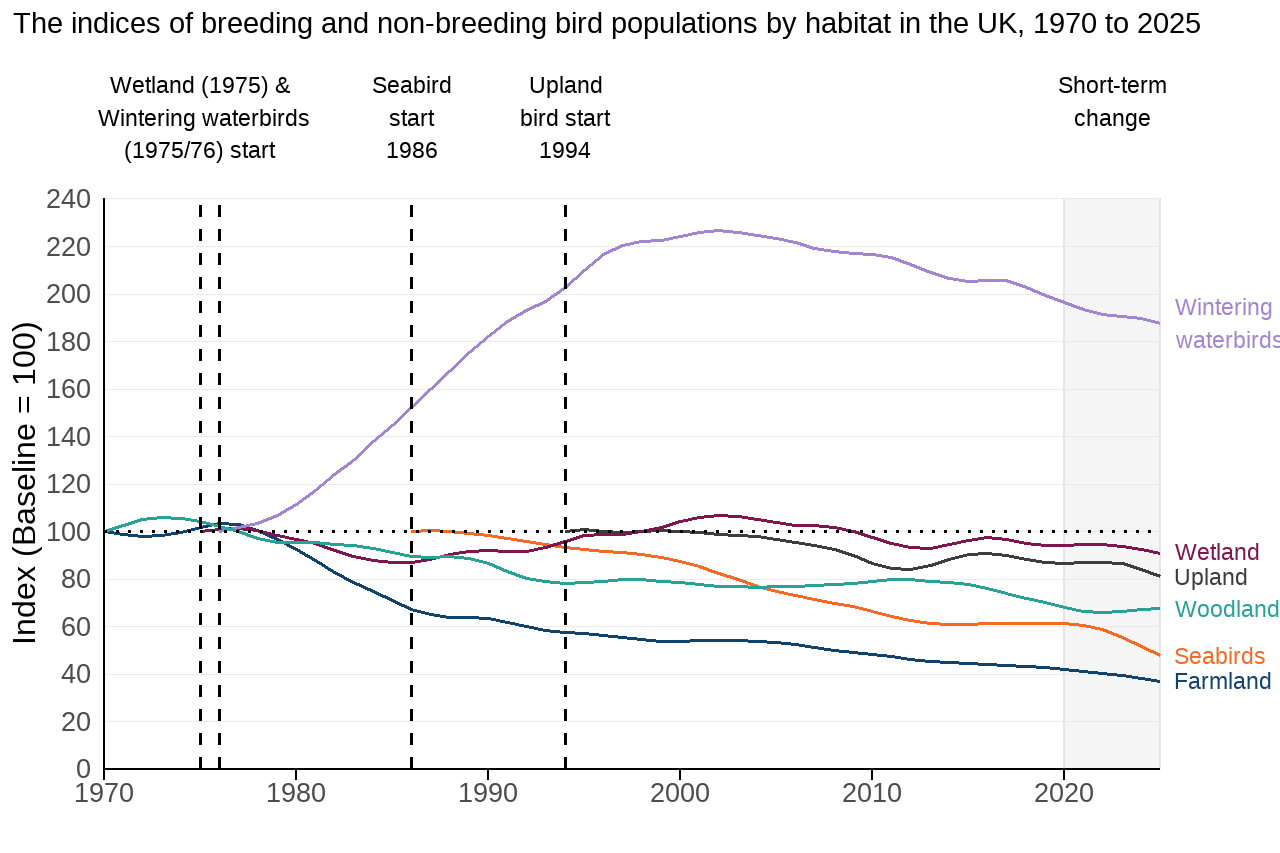
The indices for different habitat breakdowns are summarised in Figure 1. Each index is comprised of a different aggregation of species, specific to a given habitat. More detailed charts which include confidence intervals, where available, are presented for each habitat separately in Figures 3 to 8. A summary of the key results is given below:
- Most breeding bird indices show long-term declines: Farmland (-63%), seabird (-52%), woodland (-32%) and upland (-19%) bird indices have all declined significantly over the long term. The wetland bird index has shown little or no overall change (-9%).
- Farmland birds show the greatest long-term decline: The index has fallen by almost two thirds since 1970 and by a further 12% in the last five years.
- Seabirds have also declined substantially: The seabird index has halved since 1986, including a 22% decline in the last five years, the largest short-term decline among the breeding bird habitat indices.
- Woodland birds: Despite declining by around a third over the long-term, the index showed little change in the last five years.
- Wintering waterbirds change trends: This index is made up of counts of over-wintering and not breeding birds. These wintering populations have increased markedly in the long term (88%), but this trajectory changed around 2000 and has shown little or no overall change in the most recent five year period.
Figure 1: Long-term declines continue for breeding bird populations in the UK
Source: British Trust for Ornithology (BTO), Royal Society for the Protection of Birds (RSPB), and the Joint Nature Conservation Committee (JNCC)
Notes about Figure 1
- The indicators are based on the aggregated population trends for each habitat.
- Data for wintering waterbirds are collected over the winter which spans two years e.g. 1975/1976. These data are plotted here as a single year, taking the later part of the winter period e.g. 1975/1976 data is plotted at 1976 on the x axis.
- The wintering waterbirds index focuses on bird species that over-winter in the UK, some of which may also breed here. All other habitat breakdowns focus on breeding birds.
Individual species trends for different habitats in the UK
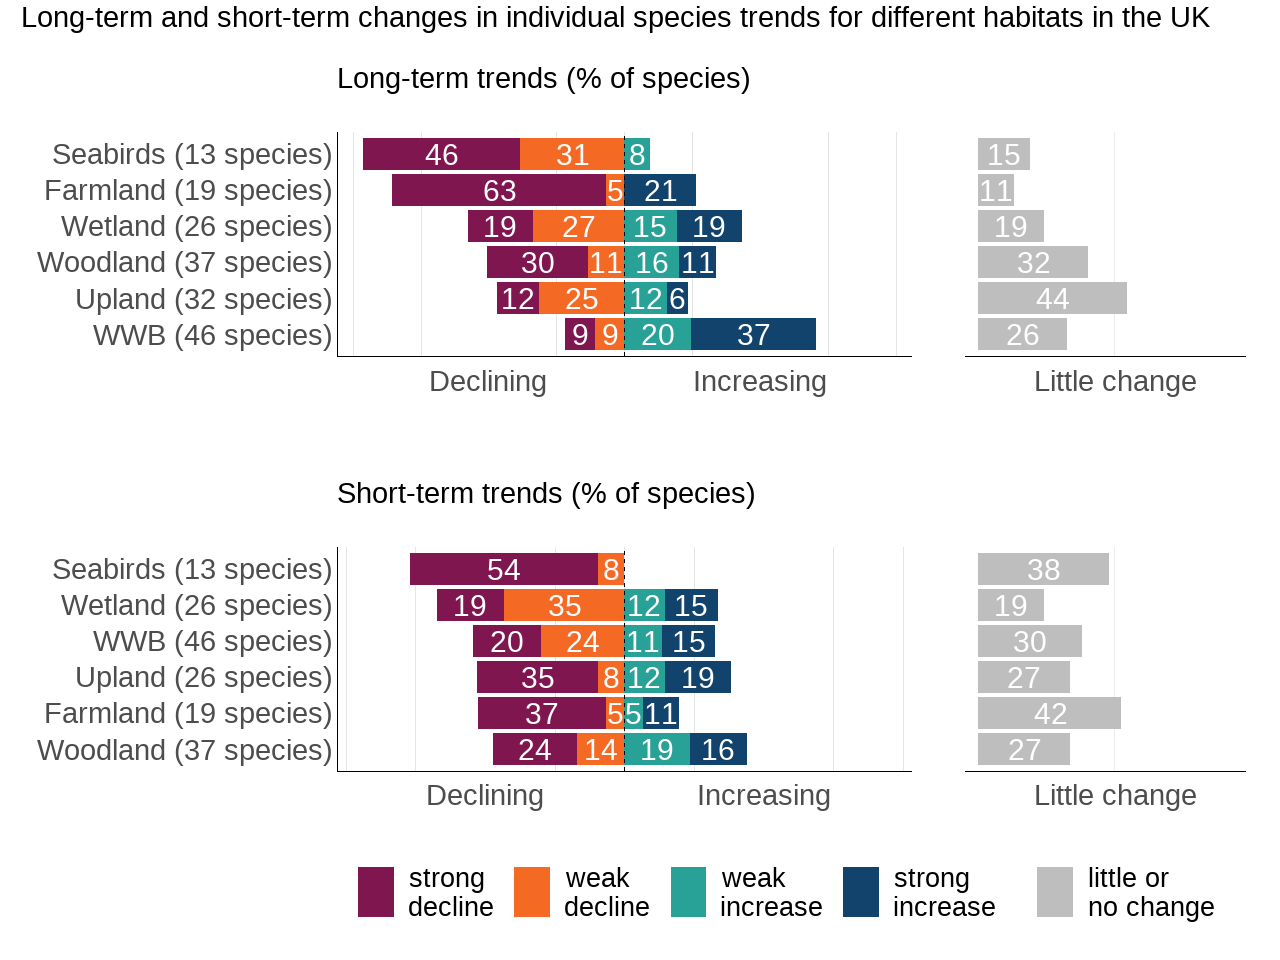
As discussed above, each habitat index is comprised of a different aggregation of species. The trends of each individual species within these habitats indices varies from some species being in strong decline to others showing little change, and others showing a strong increase over time. A summary of the variation in individual species trends observed within habitats is presented in Figure 2. A summary of the key results is given below:
- Species declines remain widespread across most habitats: over the long-term, more species have declined than increased in all habitats except wintering waterbirds. Seabirds and farmland birds show the highest proportion of species in long-term decline, with over two thirds of species showing declines.
- Recent declines are most evident among seabirds and wetland birds: over the short-term, more than half of seabird and wetland species are in decline, representing the highest proportions of declining species across the habitat groups.
- Many species show little or no overall change: a substantial proportion of species show little or no change, particularly within upland habitats over the long-term and farmland habitats over the short-term.
- Wintering waterbirds show contrasting long-term and short-term patterns: over the long-term, increases are more common than declines among wintering waterbird species. In contrast, over the short-term, declining species outnumber increasing species, reflecting the broader downturn in wintering waterbird populations since the early 2000s.
Figure 2: Species declines remain widespread across habitats, particularly among farmland and seabird species
Source: British Trust for Ornithology (BTO), Royal Society for the Protection of Birds (RSPB), and the Joint Nature Conservation Committee (JNCC)
Notes about Figure 2
- WWB: Wintering waterbirds.
- The bars in each row sum to 100% and show the proportion of species categorised as showing an increase (strong or weak), a decrease (strong or weak), or little or no change.
- Change estimates for species are assessed to the penultimate year of data.
- Long-term trends are based on total population change across the full time series which is different from previous publications. Data for some species starts after the baseline year and so for these species the long-term change represents a shorter time period. For further detail see Main notes: methodological detail, caveats and limitations.
- Short-term trends are based on mean annual change over the most recent five-year period.
- For both long-term and short-term assessments, thresholds derived from the Birds of Conservation Concern status assessment are applied.
- Over the long-term, 32 upland species were assessed but only 26 could be assessed over the short-term.
- Habitats are ranked by highest percentage of species in decline.
Farmland birds
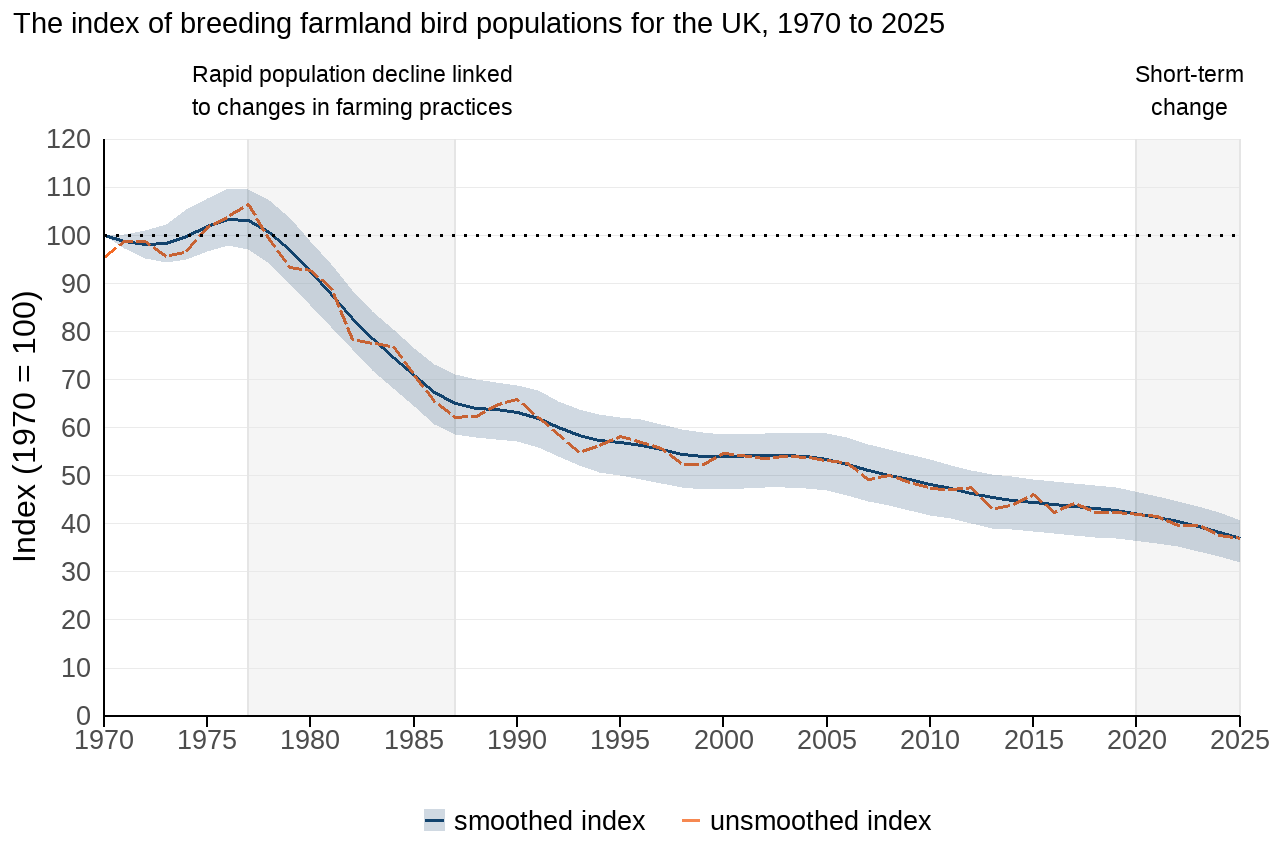
Figure 3: Farmland birds decline by around two-thirds in the UK since 1970
Source: British Trust for Ornithology (BTO), Royal Society for the Protection of Birds (RSPB), and the Joint Nature Conservation Committee (JNCC)
Notes about Figure 3
- The indicators are based on the aggregated population trends of 19 species of farmland birds.
- The smoothed index is presented together with the 95% confidence interval (a measure of uncertainty) represented by the shaded area around the trend line.
- The unsmoothed index is presented as a dashed line.
The farmland bird index for the UK includes individual measures for 19 species of farmland birds, of which 12 species are farmland specialists (species that are restricted to, or highly dependent on, farmland habitats) and 7 species are farmland generalists.
Farmland bird populations have declined by 63% since 1970, with declines being stronger for farmland specialist birds than generalists. The most severe population declines occurred between the mid 1970s and the late 1980s, largely due to the negative impact of rapid changes in farmland management during this period. Although the rate of decline has slowed since this period, the populations have continued to decline at a fast rate, declining by 12% in the five years since 2020. The long-term decline of the farmland bird indicator in the UK has been driven mainly by the decline of farmland specialists. However, generalist species have also seen severe population declines since the mid 2000s.
Individual species trends vary, with some species populations in strong decline, some species more than doubling and other species changing very little since 1970. 68% of species have declined since 1970 and in the most recent five-year period 42% of species have declined (see Figure 2). Examples of farmland birds in strong long-term decline include turtle dove, grey partridge, tree sparrow, corn bunting and starling.
For detailed information, including a breakdown of specialist and generalist farmland specific indices and individual species trends, see the farmland bird section in the Wild bird populations in the UK and England publication.
Woodland birds
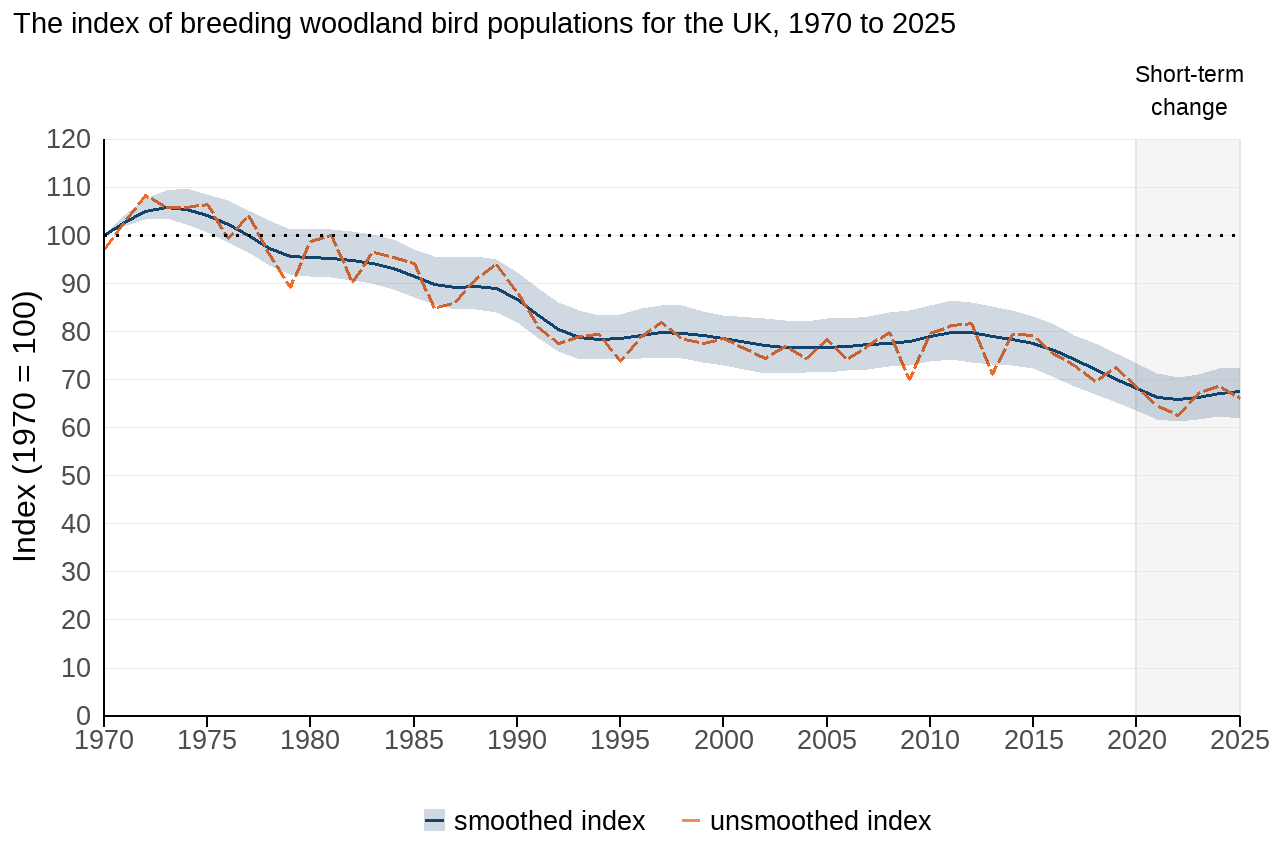
Figure 4: Breeding woodland birds have declined on average by around a third in the UK since 1970
Source: British Trust for Ornithology (BTO), Royal Society for the Protection of Birds (RSPB), and the Joint Nature Conservation Committee (JNCC)
Notes about Figure 4
- The indicators are based on the aggregated population trends of 37 species of woodland birds.
- The smoothed index is presented together with the 95% confidence interval (a measure of uncertainty) represented by the shaded area around the trend line.
- The unsmoothed index is presented as a dashed line.
The woodland bird index for the UK includes individual measures for 37 species of woodland birds, of which 25 species are woodland specialists (species that are restricted to, or highly dependent on, woodland habitats) and 12 are generalists.
Woodland bird populations in the UK have declined by 32% since 1970. The indicator shows little or no change in the five years since 2020. The long-term decline of the woodland bird indicator in the UK has been driven mainly by the decline of those species that are restricted to, or highly dependent on, woodland habitats (the ‘specialists’), such as willow tit and spotted flycatcher.
Individual species trends vary, with some species populations in strong decline, some species more than doubling and other species changing very little since 1970. 41% of woodland species have declined since 1970 and in the most recent five-year period 38% of woodland species have declined (see Figure 2). Examples of woodland birds in strong decline include willow tit, capercaillie, lesser spotted woodpecker and spotted flycatcher.
For detailed information, including a breakdown of specialist and generalist woodland specific indices and individual species trends, see the woodland bird section in the Wild bird populations in the UK and England publication.
Water and wetland birds
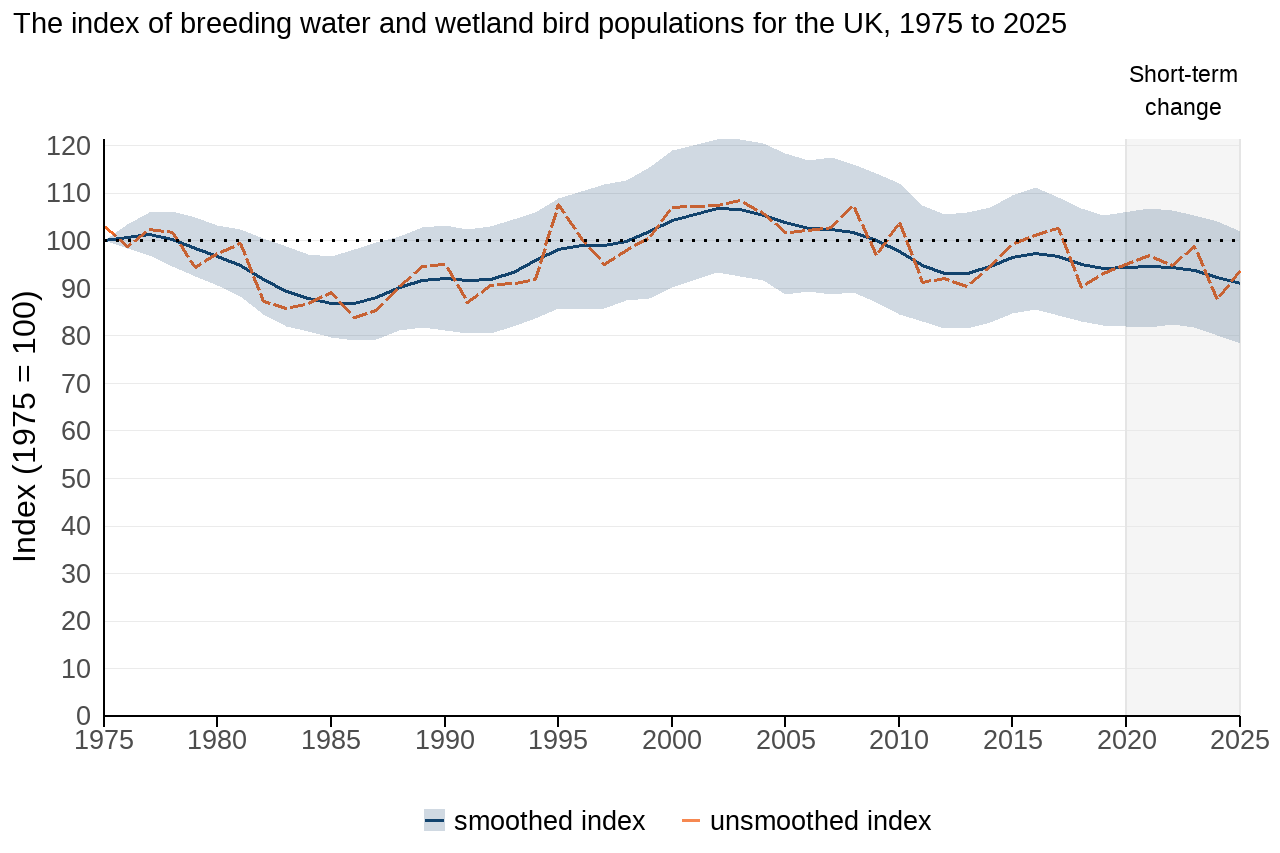
Figure 5: Water and wetland bird populations on average have remained broadly stable since 1975 in the UK
Source: British Trust for Ornithology (BTO), Royal Society for the Protection of Birds (RSPB), and the Joint Nature Conservation Committee (JNCC)
Notes about Figure 5
- The indicators are based on the aggregated population trends of 26 species of breeding water and wetland birds.
- The smoothed index is presented together with the 95% confidence interval (a measure of uncertainty) represented by the shaded area around the trend line.
- The unsmoothed index is presented as a dashed line.
The UK breeding water and wetland bird index includes individual measures for 26 species of which 8 species are associated to the wet grasslands sub indicator.
The breeding water and wetland bird populations for the UK have shown little or no change since 1975, or in the most recent five-year period. However, the indicator for the UK includes substantial variation among the species that make up this bird group, contributing to the wider confidence intervals around the composite indicators.
Individual species trends vary, with some species populations in strong decline, some species more than doubling and other species changing very little since 1975. 46% of wetland species have declined since 1975 and in the most recent five-year period 54% of wetland species have declined (see Figure 2). Examples of breeding water and wetland birds in strong decline include yellow wagtail in the long-term and coot, great crested grebe, and grey wagtail in the short term. Species showing substantial increases include Cetti’s warbler.
For detailed information, including a breakdown for birds of wet grasslands, see the Water and wetland bird section in the Wild bird populations in the UK and England publication.
Seabirds
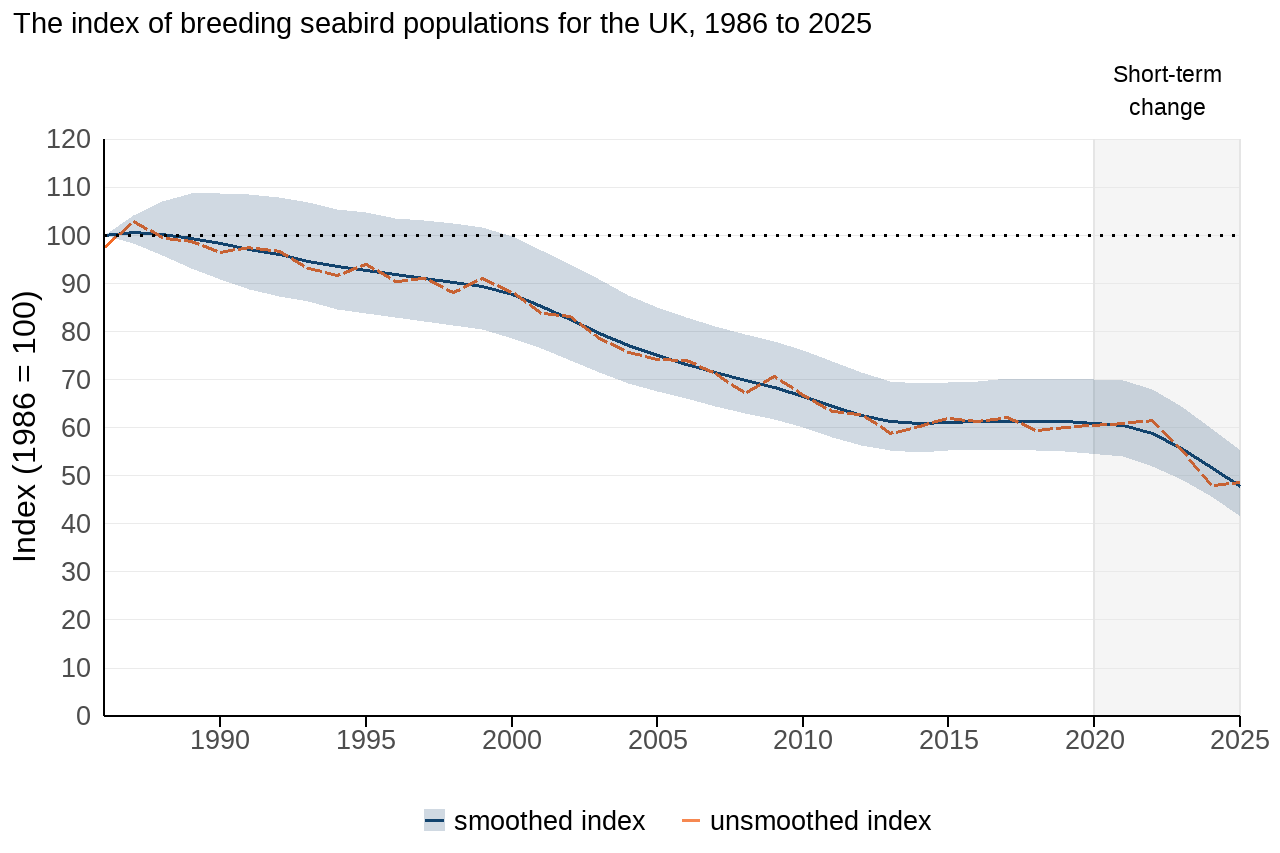
Figure 6: Populations of UK seabird species have declined on average by around a half since 1986
Source: British Trust for Ornithology (BTO), Royal Society for the Protection of Birds (RSPB), and the Joint Nature Conservation Committee (JNCC)
Notes about Figure 6
- The indicators are based on the aggregated population trends of 13 species of seabirds.
- The smoothed index is presented together with the 95% confidence interval (a measure of uncertainty) represented by the shaded area around the trend line.
- The unsmoothed index is presented as a dashed line.
Important changes have been made to the seabird indicator since last year’s publication, these include a methodological update to the underlying trends to improve confidence estimates, and the removal of subgroup indicators based on feeding habits. For more information, please see Wild bird populations in the UK and England publication.
The seabird index for the UK includes individual measures for 13 species of seabirds. The indicator has declined by 52% since 1986. The population showed a steady decline until 2013 and then more recently a sharp decline of 22% in the five years since 2020.
Individual species trends vary, with some species populations in strong decline, some species more than doubling and other species changing very little since 1986. 77% of seabird species have declined since 1986 and in the most recent five-year period 62% of seabird species have declined (see Figure 2). Examples of seabirds in strong decline include Arctic skua (all UK birds are in Scotland).
Data collection for seabirds was impacted by the COVID-19 pandemic but differences in annual coverage should be accounted for in the analyses. Trends in some seabird species have been negatively impacted by the onset of Highly Pathogenic Avian Influenza (HPAI) since 2020, and large annual differences in the numbers of affected birds at different colonies has added to the instability in some trends.
For detailed information see the seabirds section in the Wild bird populations in the UK and England publication.
Upland birds
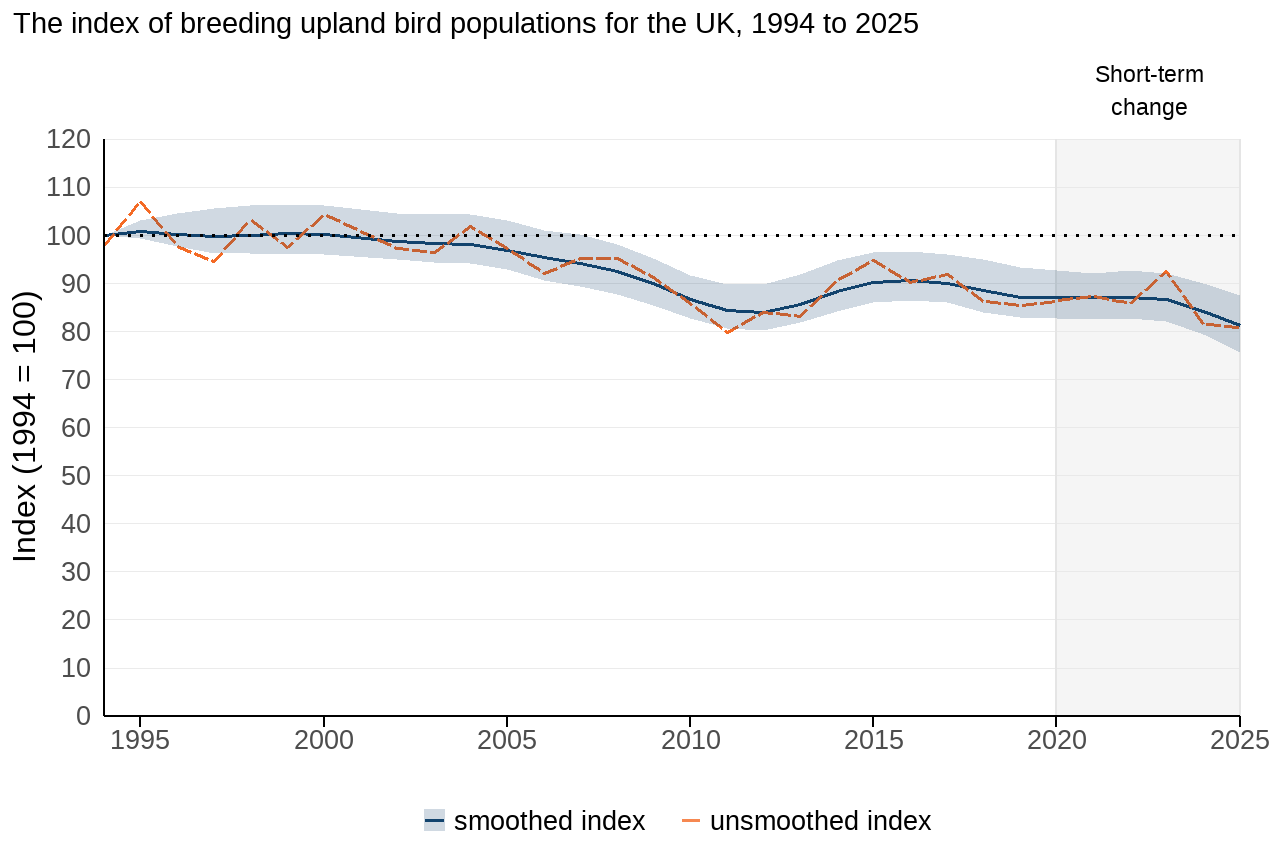
Figure 7: Upland bird populations have declined in the UK
Source: British Trust for Ornithology (BTO), Royal Society for the Protection of Birds (RSPB), and the Joint Nature Conservation Committee (JNCC)
Notes about Figure 7
- The indicators are based on the aggregated population trends of 32 species of upland birds.
- The smoothed index is presented together with the 95% confidence interval (a measure of uncertainty) represented by the shaded area around the trend line.
- The unsmoothed index is presented as a dashed line.
The upland bird index for the UK includes individual measures for 32 species of upland birds, of which 13 species are upland generalists and 15 species are upland specialists (species that are characteristic of and strongly associated with upland areas, typically open moorland habitats).
Upland bird populations have declined by 19% in the UK since 1994 and also declined by 6% in the five years since 2020.
Individual species trends vary, with some species populations in strong decline, some species more than doubling and other species changing very little since 1994. Overall, long-term trends are mixed, with around half of upland bird species showing little or no change, and more species declining than increasing since 1994. Short-term trends are also mixed, with more species declining (see Figure 2). Examples of upland birds in strong decline include peregrine falcon and whinchat. Examples of upland birds showing strong increases include stonechat and red kite.
For detailed information, including a breakdown of generalist and specialist species trends, see the upland bird section in the Wild bird populations in the UK and England publication.
Wintering waterbirds
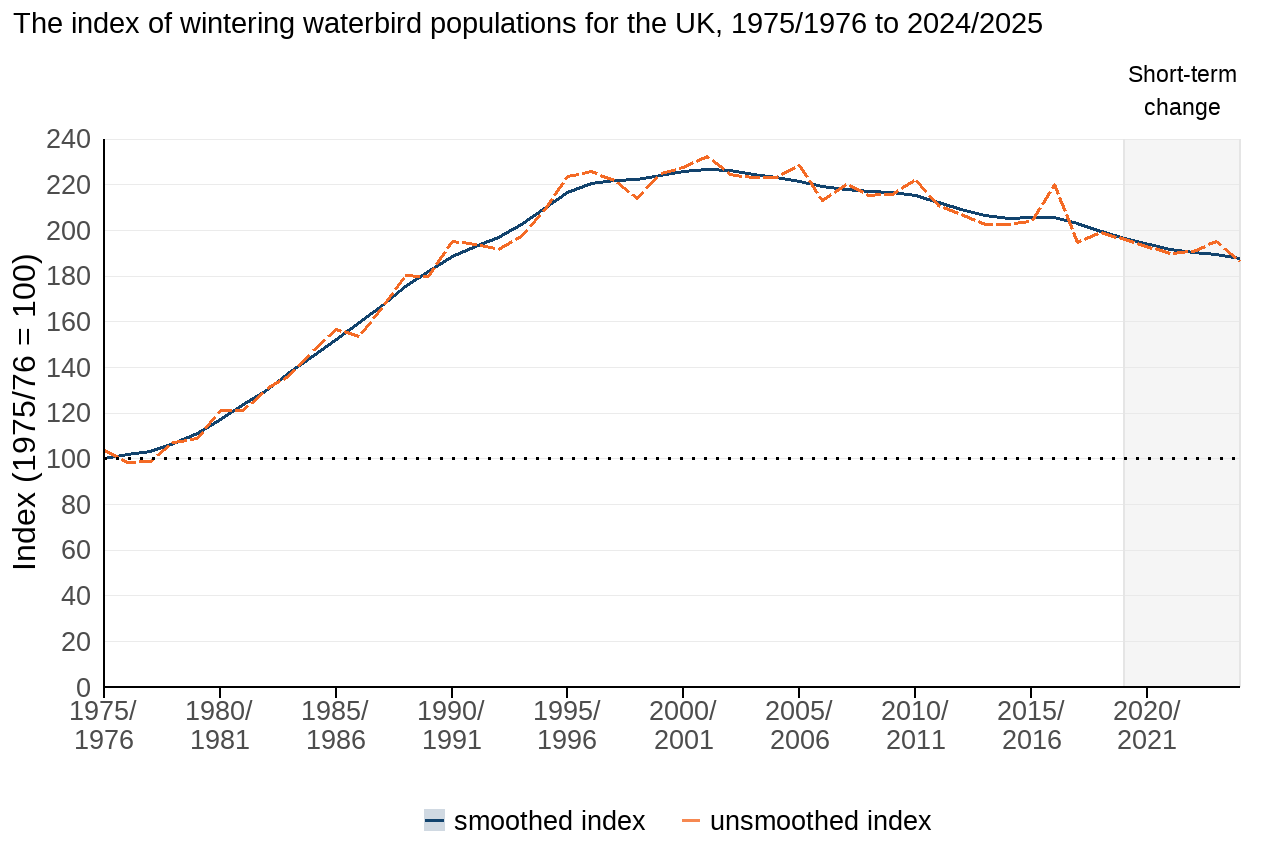
Figure 8: Wintering waterbird populations on average remain above 1975/1976 levels despite recent declines
Source: British Trust for Ornithology (BTO), Royal Society for the Protection of Birds (RSPB), and the Joint Nature Conservation Committee (JNCC)
Notes about Figure 8
- The indicators are based on the aggregated population trends of 46 species of wintering waterbirds.
- Data for wintering waterbirds are collected over the winter which spans two years e.g. 1975/1976.
- The smoothed index is presented as a solid line and the unsmoothed index is presented as a dashed line. No confidence intervals are available.
The wintering waterbird index for the UK includes individual measures for 46 species (or races) of wintering waterbirds, of which 15 species are waders and 31 species are wildfowl. This indicator relates to numbers of these species during the winter period from September to the following March each year for wildfowl and from November to March for waders.
Wintering waterbird populations have increased by 88% in the UK since the winter of 1975/1976. However, since the early 2000s the index declined, although little or no overall change was shown over the most recent five-year period.
Individual species trends vary, with some species populations in strong decline, some species increasing tenfold and other species changing very little since 1975/1976. Overall, 57% of species have increased and 17% of species have declined since 1975/1976. However, in the most recent five year period 43% of species have declined (see Figure 2). Examples of wintering waterbirds in strong decline over both the long term and short term are Bewick's swan and scaup. Examples of wintering waterbirds showing strong increases include British/Irish greylag goose (over a 30-fold increase) and gadwall and Svalbard light-bellied Brent goose (both over a 10-fold increase).
Like seabirds, wintering waterbirds have been impacted by the Highly Pathogenic Avian Influenza (HPAI) outbreak. It remains to be seen whether HPAI has longer term impacts on wintering populations of ducks, swans or geese.
For detailed information, including a breakdown of waders and wildfowl indices and individual species trends, see the wintering waterbird section in the Wild bird populations in the UK and England publication.
Further detail
The indicator has been compiled in conjunction with the British Trust for Ornithology (BTO), the Joint Nature Conservation Committee (JNCC), the Royal Society for the Protection of Birds (RSPB), and the Wildfowl and Wetlands Trust (WWT). Data are obtained from a wide range of sources, principally:
- the Common Birds Census (from 1966 to 2000)
- the BTO/JNCC/RSPB Breeding Bird Survey (from 1994 to 2025)
- the BTO/ Waterways Bird Survey (from 1974 to 2007)
- the BTO/JNCC/RSPB Waterways Breeding Bird Survey with support from the Environment Agency (from 1998 to 2025)
- the BTO/RSPB/JNCC Wetland Bird Survey counts (from 1975/1976 to 2024/25)
- the BTO/JNCC/NatureScot Goose & Swan Monitoring Programme in partnership with the JNCC and Scottish Natural Heritage
- the BTO/JNCC/RSPB Seabird Monitoring Programme (from 1986 to 2025)
- the Periodic Seabird censuses supplied by JNCC, RSPB, the Seabird Group, SOTEAG (Shetland Oil Terminal Environmental Advisory Group) and other partners
- Monitoring of scarce and rare breeding birds by the Statutory Conservation Agency and RSPB Annual Breeding Bird Scheme (SCARABBS) and the Rare Breeding Birds Panel (from 1970 to 2025)
Relevance
Bird populations have long been considered to provide a good indication of the broad state of wildlife. Birds occupy a wide range of habitats and there are considerable long-term data on changes in bird populations, which help in the interpretation of shorter-term fluctuations in numbers. As they are a well-studied taxonomic group, drivers of change for birds are better understood than for other species groups, which allows for better interpretation of any observed changes. Birds also have huge cultural importance and are highly valued as a part of the UK’s natural environment by the general public.
International and domestic reporting
The UK and England Biodiversity Indicators are used for a variety of reporting and other purposes. This includes international reporting, such as the UK's National Reports to the Convention on Biological Diversity (CBD) on progress towards the goals and targets of the Kunming-Montreal Global Biodiversity Framework. They are also used to track the state of biodiversity domestically, such as in England’s Environmental Indicator Framework.
Web links for further information
- Birds of Conservation Concern Summary leaflet
- The Breeding Birds Survey Report
- Indicators of wild bird populations
- Waterways Breeding Bird Survey
- Wetland Bird Survey
- Populations of wild birds 1970–2025
- Seabird Monitoring Programme
- Waterbird Monitoring
Acknowledgements
Thank you to the many people from the BTO, RSPB and WWT who have contributed by providing data and to the many colleagues who have helped produce this indicator.
Technical annex
Methodology
The measures for each habitat breakdown of birds show the relative abundance of aggregated groups of species. Within the measures, each species is given equal weighting, and the annual index is the geometric mean of the individual species indices for that year. Populations of individual species within each measure may be increasing or decreasing irrespective of the overall index. The individual species trends are largely derived by the modelling of sampled survey data, and estimates are revised when new data or improved methodologies are developed and applied retrospectively to earlier years. Further details about species and methods can be found on the British Trust for Ornithology website and by downloading the associated technical report.
A table listing the species that are included in each index can be found in the datafile. For each species, an estimate of change in the long term and in the short term is given, as well as an assessment of whether the species trend is increasing or decreasing.
The year-to-year fluctuations in each measure reflects the observed changes in the survey results, and smoothed trends, which are used with their confidence intervals to formally assess the statistical significance of change over time. Smoothed trends reduce short-term peaks and troughs resulting from, for example, year-to-year weather and sampling variations.
Data from surveys of wintering waterbirds are based on full counts on wetland and coastal sites of markedly varying size. This means the standard bootstrapping methods used to estimate confidence intervals for the farmland, woodland and wetland indices, which are based on standardised sample-based surveys, cannot be applied. Assessments of change for the waterbird index are therefore made using a ‘5% rule’. If the index has increased or decreased by greater than or equal to 5%, the index is assessed as improving or deteriorating respectively.
Composite indicators can mask variation among the species within them. The bar charts provided alongside the headline chart show the percentage of species within each indicator that have increased, decreased or shown little change. Whether an individual bird species is classified as increasing, decreasing or showing little change is determined differently over the long-term and short-term time periods. Long-term trends are based on the total estimated population change across the full available time series, while short-term trends are based on the mean annual rate of change over the latest five-year period. Individual species assessments are calculated up to the penultimate year of data. The thresholds used to classify species trends are derived from the Birds of Conservation Concern status assessment. Species are placed in one of five categories:
- strong increase: an increase of 100% or more;
- weak increase: an increase of more than 33% but less than 100%;
- little or no overall change: a decrease of no more than 25% or an increase of no more than 33%;
- weak decline: a decrease of more than 25% but less than 50%; and
- strong decline: a decrease of 50% or more.
For long-term assessments, these thresholds are applied to the total change across the full available time series. For short-term assessments, they are applied to the change that would occur over 25 years if the mean annual rate of change over the latest five-year period continued. The thresholds for increases and decreases are asymmetrical because equal proportional decreases and increases are not numerically equal. For example, the opposite of a 50% decrease is a 100% increase, representing a doubling. For most species, particularly over the longer period, the change is statistically significant.
Development plan
The following changes were made during the year:
- Following a review of the classification approach for species trends, the method for long-term trend classification has been updated. Long-term trends are now based on total population change across the full time series, using thresholds derived from the Birds of Conservation Concern status assessment. The approach to short-term trends is unchanged, and continues to apply these thresholds to mean annual change. This change to the classification of long-term trends will result in more species being classed as declining or increasing. Care should therefore be taken when comparing these results with trends published in 2025. For further detail see Main notes: methodological detail, caveats and limitations, important changes in this year’s publication and further information.
- A recent review of the analytical methods used in the Seabird Monitoring Programme (SMP) species population indices, including confidence estimation, has led to the development of revised approaches. The revised trends have been incorporated into the aggregate seabird indicators, which now include 95% confidence intervals.
Future developments to be implemented over the coming years are:
- Review the species to be included in all measures and incorporate any additional species where data availability allows. This includes considering species lists for each habitat breakdown, balancing the latest available data with the consistency of the indicator.
- Consider alternative methods for assessing change at the species level. This includes considering the time period over which long and short term assessments are carried out, as well as the current Birds of Conservation Concern thresholds for individual species trends.
References
- Fewster, R. M., Buckland, S. T., Siriwardena, G. M., Baillie, S. R. and Wilson, J. D. (2000). Analysis of population trends for farmland birds using generalized additive models. Ecology, 81, pp. 1970 to 1984.
- Freeman, S.N., Noble, D.G., Newson, S.E. and Bailie, S.R. (2003) Modelling bird population changes using data from the Common Bird Census and the Breeding Bird Survey. BTO research report no. 303. BTO, Thetford.
- Gregory, R.D., Gibbons, D.W., Impey, A. and Marchant, J.D. (1999) Generation of the Headline Indicator of Wild Bird Populations. BTO research report 221. BTO and RSPB, Thetford.
- Harris, S.J., Massimino, D., Gillings, S., Eaton, M.A., Noble, D.G., Balmer, D.E., Procter, D. and Pearce-Higgins, J.W. and Woodcock, P. (2018). The Breeding Bird Survey 2017. BTO Research Report 706. BTO, Thetford.
- Noble, D.G., Newson, S.E., Banks, A. and Gregory, R.D. (2003a) Effect of transition from CBC to BBS on Wild Bird Indicators. BTO and RSPB report to Defra.
- Noble, D.G., Newson, S.E. and Gregory, R.D. (2003b) Production of the 2002 Farmland PSA indicators. BTO and RSPB report to Defra.
- Noble, D.G., Newson, S.E. and Gregory, R.D. (2004) Approaches to dealing with disappearing and invasive species in the UK’s indicators of wild bird populations. BTO and RSPB report to Defra.
- Renwick, A.R., Johnston, A., Joys, A., Newsom, S.E., Noble, D.G. and Pearce-Higgins, J.W. (2012) Composite bird indicators robust to variation in species section and habitat specificity. Ecological Indicators, 18, 200–207.
- Tremlett, C.J., Morley, N., and Wilson, L.J. (2024). UK seabird colony counts in 2023 following the 2021-22 outbreak of Highly Pathogenic Avian Influenza. RSPB Research Report 76. RSPB Centre for Conservation Science, RSPB, The Lodge, Sandy, Bedfordshire, SG19 2DL. ISBN: 978-1-905601-72-1
- Underhill, L.G. and Prŷs-Jones, R. (1994) Index numbers for waterbird populations. I. Review and methodology. Journal of Applied Ecology, 31, 463–480.
- Woodward, I.D., Massimino, D., Hammond, M.J., Harris, S.J., Leech, D.I., Noble, D.G., Walker, R.H.,Barimore, C., Dadam, D.,Eglington, S.M., Marchant, J.H., Sullivan, M.J.P., Baillie, S.R. and Robinson, R.A. (2018). BirdTrends 2018: trends in numbers, breeding success and survival for UK breeding birds. Research Report 708. BTO, Thetford.
Categories:
Published: