Awareness, understanding and support for conservation
Last updated: 2025
Latest data available: 2018/19
|
In 2025 new indicators have been developed and published in the UK Biodiversity Indicators suite. These indicators were developed to report on progress towards the goals and targets of the Kunming-Montreal Global Biodiversity Framework. Alongside this, the Biodiversity Indicators production team have sought feedback from our users, and used this feedback to identify existing indicators which can be discontinued whilst minimising impact on our users. |
Introduction
This indicator addresses awareness of biodiversity and understanding of its value, concern about biodiversity loss, as well as support for performing actions that can help to conserve it. The indicator uses a hierarchical system to group people in the UK according to the extent to which they are aware of the threat to biodiversity in the UK, their level of concern about the loss of biodiversity and the number and type of actions they take to support and protect it.
Data for this indicator are sourced from questions on awareness of, concern for, and actions taken, to prevent biodiversity loss. These questions were incorporated into surveys running in the four countries of the UK. Some of these surveys have since been discontinued or changed. The number of indicators published as part of the Biodiversity Indicators suite will increase as new indicators are developed in response to the Kunming-Montreal Global Biodiversity Framework, consequently the Biodiversity Indicators production team may not have the capacity to continue to update this indicator in the future. If you use the data published for this indicator and feel this decision would impact you, please get in touch.
Data for this indicator can be found in the published datafile. We also have a similar indicator at the England level.
Type of indicator
Pressure / benefit indicator
Type of official statistics
Official statistic
Assessment of change
There are currently insufficient data points available for this indicator to carry out any assessments.
Key results
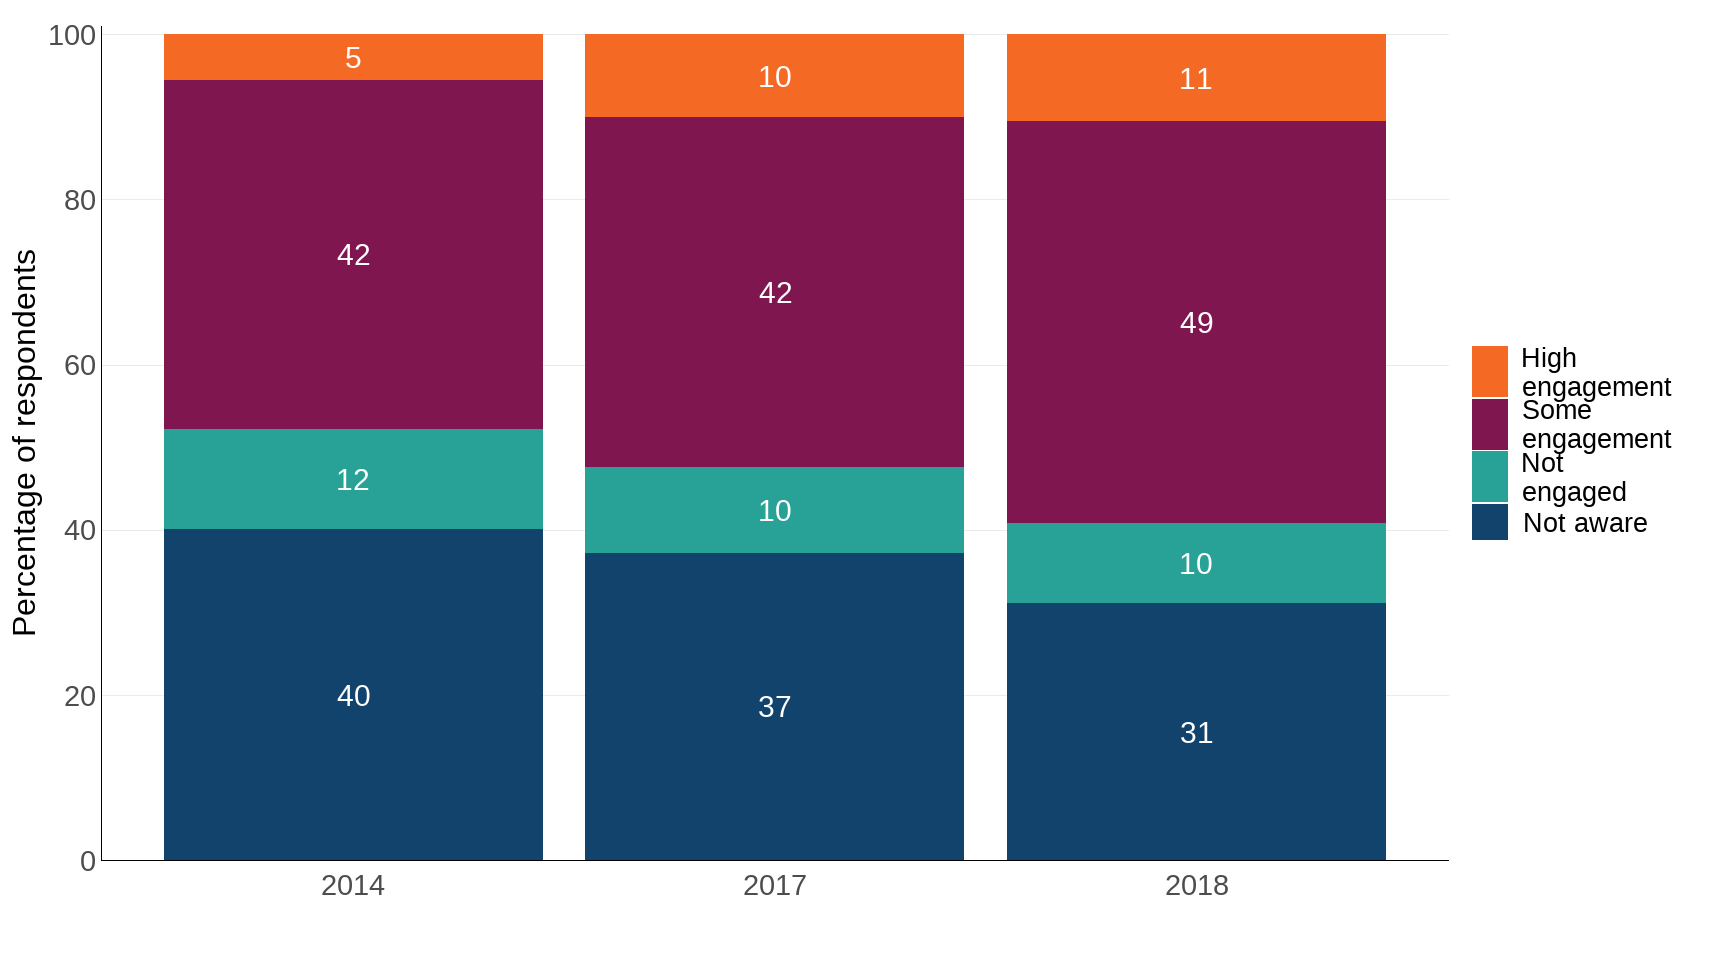
In 2018, 11% of people in the UK were ‘highly engaged’ with the issue of biodiversity loss compared with 5% in 2014. These are people who are aware of the threat to biodiversity in the UK, are concerned about the loss of biodiversity, and take actions to support and protect biodiversity, including some requiring higher effort.
In 2018, 49% of people in the UK showed ‘some engagement’ with the issue of biodiversity loss, compared with 42% in 2014. These are people who are aware of the threat to biodiversity in the UK, are concerned about the loss of biodiversity and take some ‘day-to-day’ actions to support and protect biodiversity.
In 2018, 10% of people were ‘not engaged’ with the issue of biodiversity loss, compared with 12% in 2014. These are people who are aware of the threat to biodiversity but not concerned about it.
In 2018, 31% of survey respondents stated that they were ‘not aware’ of the threat to biodiversity in the UK compared with 40% in 2014.
Figure 1: Public engagement with biodiversity loss in the UK: awareness, concern and action, 2014, 2017 and 2018
Source: Department of Agriculture, Environment and Rural Affairs Northern Ireland; Natural England; Natural Resources Wales; NatureScot
Notes about Figure 1:
- Groups are defined as: ‘not aware’; ’not engaged’; ‘some engagement’; and ‘high engagement’, according to responses to survey questions concerning engagement with biodiversity loss, as described in the background section below.
- Data are weighted based on the relative population size of each country.
- This indicator is built from survey results obtained separately by each of the four countries in the UK – which each run surveys in a slightly different manner. Some changes have occurred to the surveys over time.
- England ran the Monitor of Engagement in the Natural Environment survey annually.
- Scotland run the Scottish Nature Omnibus Survey every two years. Data from the 2017 survey has been used in this publication and carried forward to calculate a UK 2018 total.
- Wales run an annual survey. Data relating to this indicator used to come from the Wales Outdoor Recreation Survey (WORS). The WOR Survey was discontinued in 2015. Sections of WORS were incorporated into the new National Survey for Wales, but not a direct transcription of the questions previously used for this indicator, so the data for Wales for 2014 from WORS have been carried forward into the UK totals for 2017 and 2018.
- Northern Ireland run an annual survey, the Continuous Household Survey (CHS). The specific questions relating to this indicator ceased being asked in the CHS 2015 to 2016, so the data from the CHS 2014 to 2015 have been carried forward into the UK totals for 2017 and 2018.
Further detail
Table 1: Percentage of people in England, Scotland, Wales and Northern Ireland engaged in action to combat biodiversity loss, 2014 and 2018
| Group | England 2014 | England 2018 | Scotland 2014 | Scotland 2018 | Wales 2014 | Wales 2018 | Northern Ireland 2014 | Northern Ireland 2018 |
|---|---|---|---|---|---|---|---|---|
| High engagement | 5 | 10 | 12 | 20 | 10 | 10 | 4 | 4 |
| Some engagement | 45 | 53 | 31 | 29 | 13 | 13 | 46 | 46 |
| Not engaged | 12 | 9 | 13 | 14 | 2 | 2 | 18 | 18 |
| Not aware | 38 | 28 | 43 | 37 | 74 | 74 | 32 | 32 |
Source: Department of Agriculture, Environment and Rural Affairs Northern Ireland; Natural England; Natural Resources Wales; NatureScot
Notes on Table 1
- Country data are not directly comparable; although every effort was made to standardise questions among surveys, question wording is not exactly the same in all four countries (see Technical annex).
- Totals for each country may not add to 100 due to rounding.
- Individual country data presented here are unweighted, therefore totals for each level of engagement may not match the headline indicator. Weighting used to calculate the overall UK measure are based on the relative population size of each country.
- This indicator is built from survey results obtained separately by each of the four countries in the UK – which each run surveys in a slightly different manner. Some changes have occurred to the surveys over time.
- England ran the Monitor of Engagement in the Natural Environment survey annually.
- Scotland run the Scottish Nature Omnibus Survey every two years. Data from the 2017 survey has been used in this publication and carried forward to calculate a UK 2018 total.
- Wales run an annual survey. Data relating to this indicator used to come from the Wales Outdoor Recreation Survey (WORS). The WOR Survey was discontinued in 2015. Sections of WORS were incorporated into the new National Survey for Wales, but not a direct transcription of the questions previously used for this indicator, so the data for Wales for 2014 from WORS have been carried forward into the UK totals for 2017 and 2018.
- Northern Ireland run an annual survey, the Continuous Household Survey (CHS). The specific questions relating to this indicator ceased being asked in the CHS 2015 to 2016, so the data from the CHS 2014 to 2015 have been carried forward into the UK totals for 2017 and 2018.
Relevance
Public understanding and opinion on the value of biodiversity has strong implications for the acceptance and adoption of conservation measures. People value the natural world in different ways and for different reasons. They may simply value it for its own sake, because it makes our local environment more attractive, or because they enjoy experiencing nature-rich places for recreation. Regular opportunities to experience the natural world are known to have positive impacts on human health.
International/domestic reporting
The suite of UK Biodiversity Indicators has been revised and updated to bring it in line with the Kunming-Montreal Global Biodiversity Framework (GBF) of the Convention on Biological Diversity (CBD). Some UKBIs will be used for the forthcoming UK national reports to CBD.
Web links for further information
- Defra Awareness research: Engaging people in biodiversity issues
- Natural England: People and Nature Survey for England
- Natural England: Monitor of Engagement with the Natural Environment, People and Nature Survey for England
- NatureScot Scottish Nature Omnibus
- Department of Agriculture, Environment and Rural Affairs Northern Ireland Continuous Household Survey
- Natural Resources Wales Wales Outdoor Recreation Survey
Acknowledgements
Thank you to the many survey respondents who have contributed by providing data and to the many colleagues who have helped produce this indicator.
Technical annex
Methodology
In May 2013, Defra published a research report titled Engaging people in biodiversity issues. In this study, a system was defined with a set of evidence-based criteria and decision rules that can be used to assign people from the general population into five discrete groups, based on their responses to a survey developed as part of the study. The system reflects different levels of awareness of, and engagement in, biodiversity issues. The definitions of the five groups developed give internally consistent findings in terms of attitudes and behaviours. Within the research, the groups were of sufficient size to allow further analysis and policy targeting. This study, which captured all parts of the awareness, concern and action spectrum, has been used as a template for the development of the indicator presented here.
The indicator groups respondents as follows:
- Group 1: Does not anticipate a loss of biodiversity in the UK (exact wording of question varied between surveys)
- Group 2: Believes there will be a loss of biodiversity in the future but is not concerned about the loss of biodiversity
- Group 3: Believes there will be a loss of biodiversity, is concerned about a loss of biodiversity and performs 0 to 2 ‘day-to-day’ actions to support and protect biodiversity
- Group 4: Believes there will be a loss of biodiversity, is concerned about that loss and performs all 3 ‘day-to-day’ actions or 1 to 2 ‘day-to-day’ actions and at least one ‘higher effort’ action
- Group 5: Believes there will be a loss of biodiversity, is concerned about that loss and performs all 3 ‘day-to-day’ actions as well as 1 to 2 ‘higher effort’ actions
Respondents that fall into Group 1 are labelled as ‘not aware’, respondents in Group 2 are labelled as ‘not engaged’, respondents in Group 3 are said to show ‘some engagement’, and respondents in Group 4 or Group 5 are combined and said to show ‘high engagement’.
A ‘higher effort’ action is a behaviour that has the capability to persuade others and lead to changes that might impact on biodiversity loss at a national level. Higher effort behaviours require the participant to act outside the realms of regular daily life and are adopted by only a niche group of people. The higher effort actions asked about in the questions used to inform this indicator are ‘volunteered with a project or organisation to help protect the environment/wildlife‘ and ‘Signed a conservation petition or participated in a conservation campaign (online or other)’.
‘Day-to-day’ behaviours are more a measure of engagement than behaviours that will actually prevent biodiversity loss. The day-to-day behaviours asked about in the questions used to inform this indicator are: wildlife gardening; green consumerism; and membership of an organisation that helps to look after wildlife or the natural environment.
Data is analysed by country, before being compiled to give UK figures. The results of each of the 4 countries are weighted by population size to ensure the UK figure is as representative as possible. Estimate of population size are taken from the Office for National Statistics website.
Questions on awareness of, concern for, and actions taken to prevent biodiversity loss, have been inserted into surveys running in England (Monitor of Engagement with the Natural Environment), Scotland (Scottish Nature Omnibus), Northern Ireland (Continuous Household Survey) and Wales (Wales Outdoor Recreation Survey). These questions were based on questions used to define the ‘Public Engagement with Loss of Biodiversity’ system in the Defra Engaging people in biodiversity issues report. Table 2 shows a breakdown of the headline measure by country.
It is likely that the surveys used to provide the required information for this indicator will not be run every year. Therefore, it is anticipated that this indicator will be updated only when data are available.
The survey used to collect the data for England (Monitor of Engagement with the Natural Environment) was replaced by the new People and Nature Survey for England which began collecting data in April 2020 and has produced interim results.
UK Survey Information
Information and questions can be found for each of the four UK surveys in the following sections and Table 2. It should be noted that we only show answers to each question for those options which are used in the overall indicator, rather than listing all those available to respondents.
Table 2: Surveys for indicator question distribution in the UK
| Country | Survey name | Total sample size approx | Frequency of survey cycle | Frequency of reporting | Survey start date | Survey method | Sample size for the 2014 indicator | Sample size for the 2017 indicator | Sample size for the 2018 indicator |
|---|---|---|---|---|---|---|---|---|---|
| England | Monitor of Engagement with the Natural Environment | ~45,000 a year, but individual questions can be inserted for quarters (periods of 3 months) | Continuous data collection: 800 interviews/week | Annual | 2009 | Face-to-face interviews | 3,419 | 3,666 | 3,498 |
| Scotland | Scottish Nature Omnibus | ~1,125 | Every 6 months | Every 6 months | 2009 | Face-to face interviews | 1,141 | 1,062 | 1,062 (a) |
| Wales | Welsh Outdoor Recreation Survey | ~6,300 | Every 3 years | Every 3 years | 2008 | Telephone interviews | 6,000 | 6,000 (a) | 6,000 (a) |
| Northern Ireland | Continuous Household Survey | ~3,600 a year | Annual | Annual | 1983 | Face-to-face interviews | 1,215 | 1,215 (a) | 1,215 (a) |
Source: Department of Agriculture, Environment and Rural Affairs Northern Ireland; Natural England; Natural Resources Wales; NatureScot
Notes about Table 2:
- This indicator is built from survey results obtained separately by each of the 4 countries in the UK - which each run surveys in a slightly different manner. Some changes have occurred to the surveys over time.
- England run the Monitor of Engagement in the Natural Environment survey annually.
- Scotland run the Scottish Nature Omnibus Survey every 2 years. Data from the 2017 survey has been used in this publication and carried forward to calculate a UK 2018 total.
- Wales run an annual survey. Data relating to this indicator used to come from the Wales Outdoor Recreation Survey (WORS). The WOR Survey was discontinued in 2015. Sections of WORS were incorporated into the new National Survey for Wales, but not a direct transcription of the questions previously used for this indicator, so the data for Wales for 2014 from WORS have been carried forward into the UK totals for 2017 and 2018.
- Northern Ireland run an annual survey, the Continuous Household Survey (CHS). The specific questions relating to this indicator ceased being asked in the CHS 2015/16, so the data from the CHS 2014/15 have been carried forward into the UK totals for 2017 and 2018.
England: Monitor of Engagement with the Natural Environment Survey (MENE)
Indicator questions in the Monitor of Engagement with the Natural Environment Survey (MENE) in England
Awareness
We would like you to think about the variety of all species of animals and plants that are alive on our planet. Thinking about the variety of life in the next 50 years, which of the following statements do you most agree with? In England:
- There will be less variety of life
- There will be no change to the variety of life
- There will be more variety of life
Concern
How concerned are you about the consequences of a loss of variety of life in England?
- Not at all concerned
- Not concerned
- Neither concerned or unconcerned
- Concerned
- Extremely concerned
- Don’t know
Actions
Thinking about the last 12 months, which of the following environment-related activities do you do? Please choose all that apply.
- I usually buy eco-friendly products and brands
- I am a member of an environmental or conservation organisation
- I volunteer to help care for the environment
- I donate my time at least once every three months to an environmental or conservation organisation (NB. a yes to this action or the one above counts as a yes to ‘volunteering’ for indicator purposes)
- I have signed a conservation petition or participated in an online/other conservation campaign
Thinking about your garden or communal garden, which of the following statements, if any, do you agree with? Select all those that apply to you.
- I encourage wildlife in my garden
Scotland: Scottish Nature Omnibus (SNO)
Awareness
Biodiversity is the variety of all living things – animals, birds, plants, trees, fish, insects and human beings themselves – that exist in the world.
Thinking about biodiversity, or the variety of life, over the next 50 years, which of the following statements do you most agree with? In Scotland:
- There will be less variety of life
- There will be no change in the variety of life
- There will be more variety of life
Concern
How CONCERNED are you about the loss of biodiversity, or variety of life, in Scotland?
- Very
- Slightly
- Neither
- Not very
- Not at all
- Don’t Know
Actions
Please can you tell me whether you have done any of the following in the last 12 months?
Garden for wildlife e.g. let wild flowers grow in the garden, use peat free compost, plant native trees and plants,
- Yes, I try to do everything
- Yes, but I only do a couple of things
- No, but I’d like to do something
- No, I’m not interested
- N/A / No garden
- Don’t know /no opinion
Be a green consumer e.g. buy local or British food, buy from farmers’ markets, buy biodegradable products, use energy-efficient appliances
- Yes, I try to do everything
- Yes, but I only do a couple of things
- No, but I’d like to do something
- No, I’m not interested
- N/A
- Don’t know /no opinion
Volunteering to help the environment e.g. clean up local green spaces, record wildlife, take part in fundraising activities
- Yes, I try to do everything
- Yes, but I only do a couple of things
- No, but I’d like to do something
- No, I’m not interested
- N/A
- Don’t know /no opinion
Are you a member of any organisation which helps look after wildlife or the natural environment?
- Yes
- No
In the last 12 months, have you signed a conservation petition or participated in a conservation campaign (on-line or other)?
- Yes – about a local issue
- Yes – about an issue that affects the whole of Scotland
- Yes – about an issue that effects the whole of the UK
- Yes – about an international issue
- No – but I might if it was something I felt strongly about
- No – and I’m not interested
- Don’t know / can’t remember
Northern Ireland: Continuous Household Survey (CHS)
Awareness
I would now like you to think about the variety of all species of animals and plants that are alive on the planet. Thinking about the variety of life in the next 50 years, do you think that in Northern Ireland…
- there will be less variety of life
- there will be no change to the variety of life
- or there will be more variety of life?
Concern
How concerned are you about the consequences of a loss of variety of life in Northern Ireland?
- Not at all concerned
- Not concerned
- Neither concerned or not concerned
- Concerned
- Extremely concerned
Actions
Which, if any, of the following actions have you taken in the last 12 months?
- Done things to encourage wildlife in your garden
- I usually buy eco-friendly products and brands
- I am a member of an environmental or conservation organisation
- I volunteer to help care for the environment
- I have signed a conservation petition or participated in an online/other conservation campaign
Wales: Wales Outdoor Recreation Survey (WORS)
Awareness
Biodiversity is the term used to describe the variety of all life on earth, this includes all species of animals and plants
Will there be a change in the variety of species in Wales in the future?
- Yes, there will be an increase
- Yes, there will be a decrease
- There will be no change
- Don’t know
Concern
And generally, how concerned are you about any changes, past or future, to the variety of species in Wales? Please us the scale of 1 to 5, where 5 is very concerned and 1 is not at all concerned.
5 – Very concerned
4
3
2
1 – Not at all concerned
Actions
Finally, can I ask which of the following activities you have done at least once in the last 12 months to help protect the environment and nature?
- Bought eco-friendly products
- Gardened for wildlife (including bird feeding)
- Been a member of an environmental, wildlife, or conservation group (includes paid membership of national organisations such as RSPB etc)
- Actively volunteered with a project or organisation to help protect the environment or wildlife
- Signed a conservation petition or participated in a conservation campaign (online or other)
Development plan
Since our previous publication we have adapted the language and visualisations used in this indicator. We are keen to hear from our users about these changes, as well as our published development plan, please email us.
Categories:
Published: