Marine pollution
Last updated: 2025
Latest data available: 2019
Introduction
The indicator shows the combined input of six of the most hazardous substances to the UK marine environment. The indicator is based on levels of five heavy metals (cadmium, mercury, copper, lead and zinc) and one organic compound (lindane).
For this indicator, the most recent data are from 2019. It has not been possible to update this indicator in recent years, please refer to the Background section for further information.
The data for this indicator can be downloaded from here: JNCC’s Resource Hub - Marine pollution.
Type of indicator
Pressure indicator
Type of official statistics
Official statistic.
Assessment of change
Assessment of change in input of hazardous substances to the marine environment.
| Measure | Assessment | Time period | Result |
|---|---|---|---|
| Combined input of hazardous substances to the UK marine environment | Long term | 1990 to 2019 | Improving |
| Combined input of hazardous substances to the UK marine environment | Short term | 2014 to 2019 | Improving |
Notes on the indicator assessment
Long- and short-term assessments are based on a 3% rule of thumb. Where possible, the base years for these assessments use a three-year average. See Assessing Indicators.
Key results
The combined inputs of all six of the hazardous materials included within this indicator have shown a long-term decrease of 78% since 1990, as shown in Figure 1. In the short term (since 2014), inputs of five out of six of these substances show decreases; one heavy metal (zinc) has increased.
Levels of all six substances declined over the period 1990 to 2019. The heavy metals, mercury, cadmium, lead, copper and zinc decreased by 91%, 88%, 59%, 59% and 55%, respectively. The organic compound lindane decreased by 86%.
In the short term, the combined inputs of all six hazardous substances decreased by 18% from 2014 to 2019 (using a three-year average for 2014). Inputs for five out of the six of the hazardous substances declined in the short term: lindane had the highest percentage decrease (44%), cadmium decreased by 31%, mercury by 26%, copper by 8% and lead by 6%. By contrast, zinc increased by 17%.
Inputs into the marine environment are estimated from concentrations and flow rates in rivers entering the sea and those from estuarine and coastal point sources. Riverine inputs reflect both point and diffuse sources upstream of the sampling point and tend to be strongly influenced by flow rates. Flow rates are heavily affected by rainfall patterns so year-to-year fluctuations in pollutant loads are likely.
Figure 1: Combined input of hazardous substances to the UK marine environment, as an index of estimated weight of substances per year, 1990 to 2019
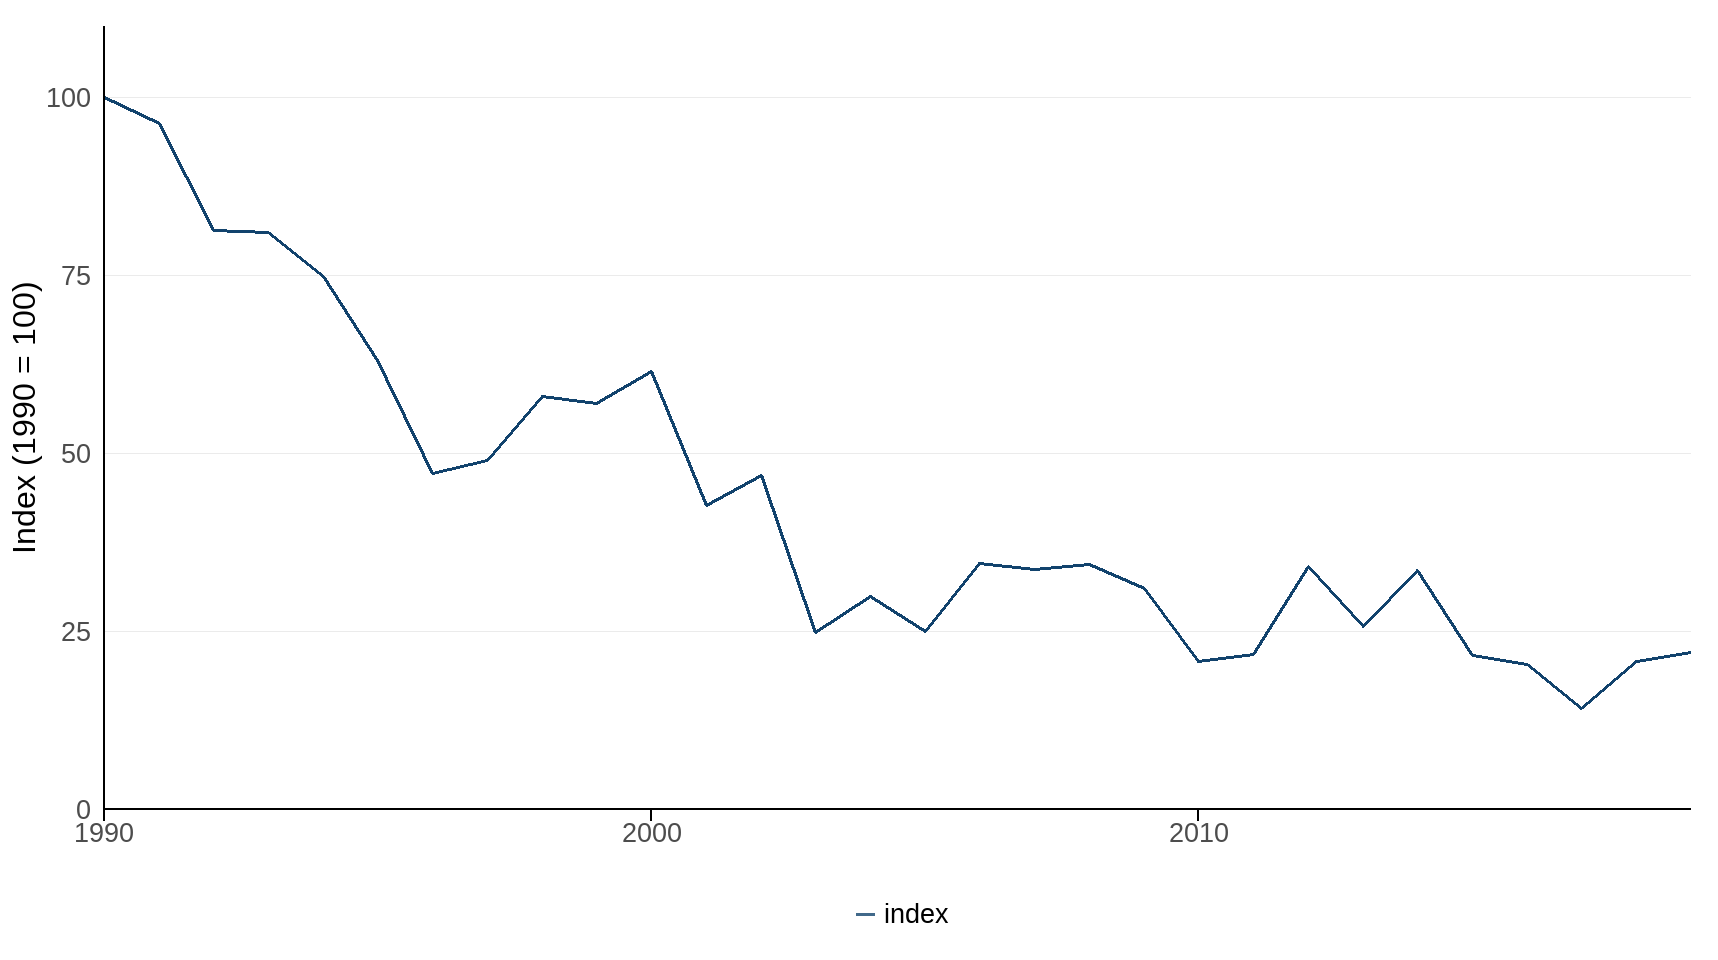
Source: Defra Marine Strategy and Evidence Division, using data provided by: Environment Agency, Northern Ireland Environment Agency and the Scottish Environment Protection Agency
A detailed illustration of changing levels of each input is shown in Figure 2. The low point in 2003 is thought to be a consequence of reduced river flows during an exceptionally dry year. Conversely, levels increased in 2012 and again in 2014 corresponding with years of heavy rainfall. In 2012, England had the wettest year since records began in 1910; the summer was the wettest since 1912 and increased rainfall in November and December contributed to extensive flooding. In 2014, the winter (January to February) was the wettest since records began.
The detection limits for analysis have gradually decreased over the period of 1990 to 2023. This is likely to have caused an overestimation in the input levels for early years compared to more recent years, leading to the reported decreases being overestimates.
Figure 2: Input of hazardous substances to the UK marine environment, as an index of weight of substance per year, 1990 to 2019
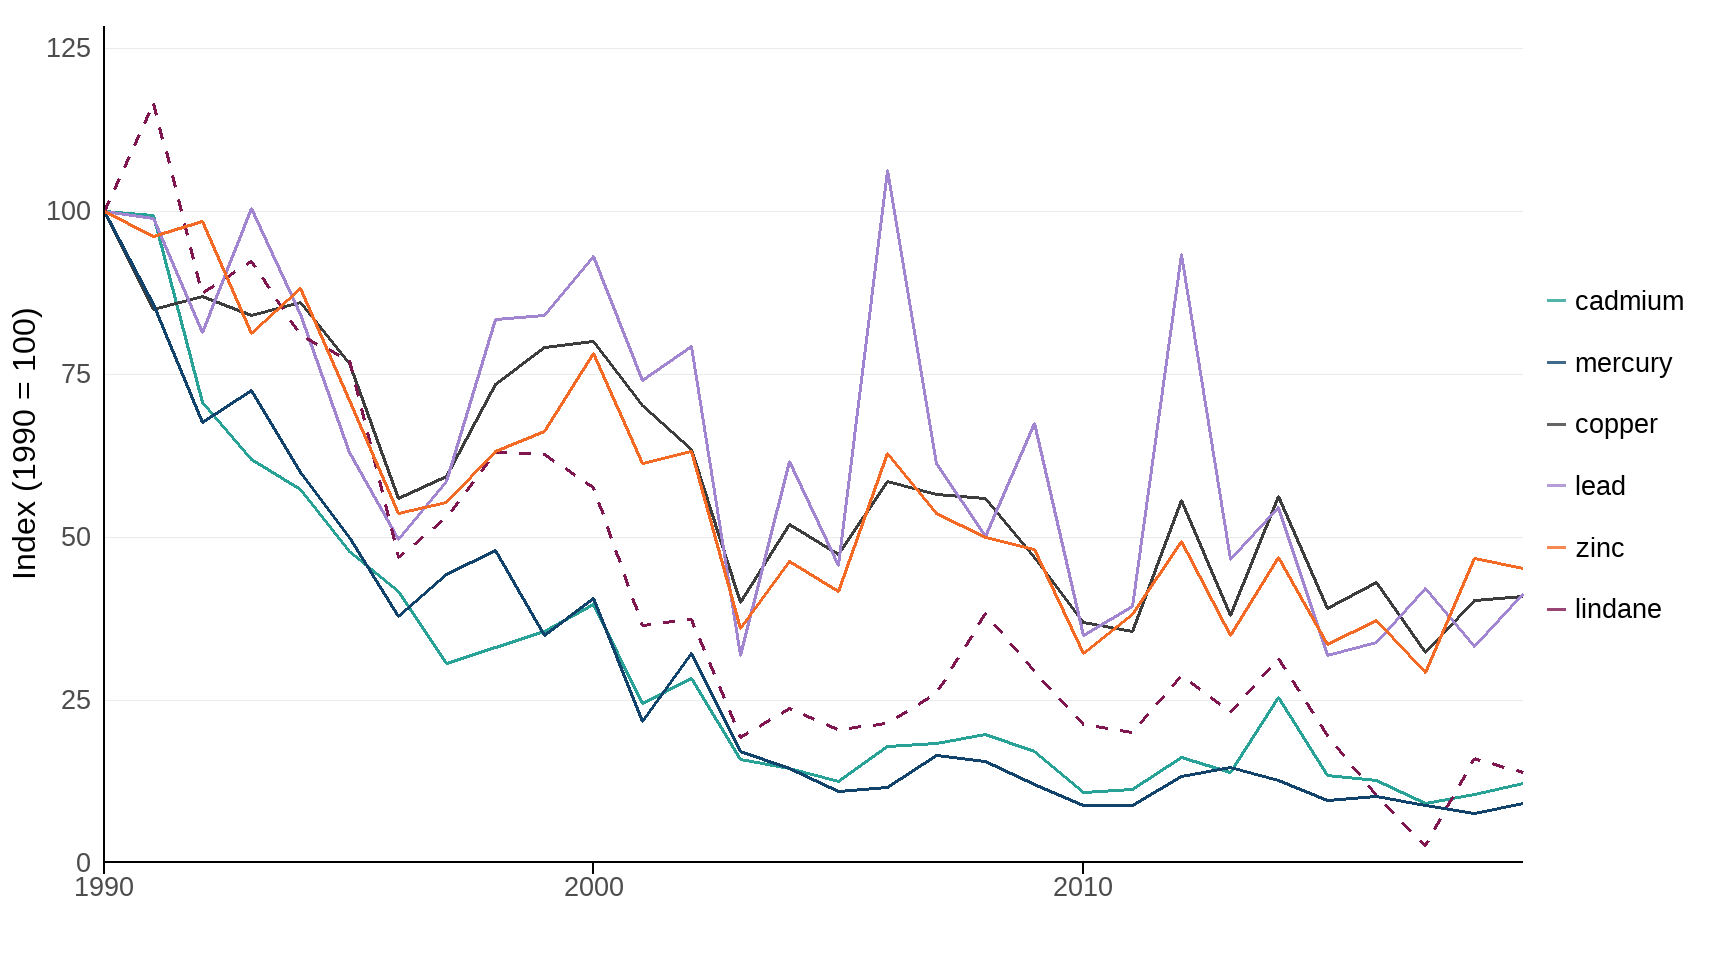
Source: Defra Marine Strategy and Evidence Division, using data provided by: Environment Agency, Northern Ireland Environment Agency and the Scottish Environment Protection Agency
Further detail
For information on the methods used in this indicator, please see the Technical Annex below.
Relevance
Pollution by hazardous heavy metals and pesticides can have adverse effects on the marine environment and biodiversity. Pollutants enter coastal waters either directly from point sources on UK coasts and estuaries or are carried via rivers.
One of the goals of the Convention for the Protection of the Marine Environment of the North-East Atlantic (the OSPAR Convention) is to implement the Hazardous Substances Strategy by making progressive endeavours, through appropriate actions and measures, to move towards the targets of the cessation of discharges, emissions, and losses of hazardous substances by the year 2020. This Strategy remains relevant and is supplemented by Strategic Objective 2 (SO2) of the North-East Atlantic Environment Strategy 2030 and relevant operational objectives. SO2 aims to prevent pollution by hazardous substances, by eliminating their emissions, discharges, and losses. The intent is to achieve levels that do not give rise to adverse effects on human health or the marine environment. The ultimate aim is of achieving and maintaining concentrations in the marine environment at near background values for naturally occurring hazardous substances, and close to zero for human made hazardous substances.
While many measures have already been put in place to prevent these persistent contaminants from entering the environment (for example, bans on lead in petrol, marketing restrictions on the use of cadmium and mercury, a ban on the use of lindane), there are still reservoirs of these contaminants from legacy use in soils and sediments which are mobilised by various weather events.
International/domestic reporting
The suite of UK Biodiversity Indicators has been revised and updated to bring it in line with the Kunming-Montreal Global Biodiversity Framework (GBF) of the Convention on Biological Diversity (CBD). Some UKBIs will be used for the forthcoming UK national reports to CBD.
- This indicator is closely related to, and draws on the same data as B1: Pollution loads entering waters in the Environmental Indicator Framework.
Web links for further information
Acknowledgements
Thank you to the many people who have contributed by providing data and to the many colleagues who have helped produce this indicator.
Technical Annex
Methodology
Inputs into the marine environment are estimated from concentrations and flow rates in rivers entering the sea and those from estuarine and coastal point sources. Riverine inputs reflect both point and diffuse sources upstream of the sampling point and tend to be strongly influenced by flow rates. Flow rates are heavily affected by rainfall patterns so year to year fluctuations in pollutant loads are likely.
The data presented relate to the UK as a whole; separate data are not readily available for England. Although data for total UK (direct plus riverine) inputs to the marine environment are available as lower and upper estimates, for ease of interpretation only upper (that is, maximum) values have been used in this assessment, rather than presentation of the data range for each substance. The values for each pollutant are converted to an index scaled to 100 at the start year of 1990, and then combined with a geometric mean.
Background
Due to recent data availability, it has not been possible to update this indicator beyond 2019. This indicator uses annual averages so to be representative of the real-life conditions it is important to capture seasonal patterns in the monitoring otherwise the averages would be skewed. Following the coronavirus pandemic, which severely impacted monitoring effort across all Devolved Administrations (DAs) in 2020, resource constraints prevented monitoring from returning to pre-pandemic levels in 2021 across the UK. While Northern Irish and Welsh monitoring was fully resumed in 2022, resource limitations and prioritisation in England prevented reestablishment of the full Riverine Inputs and Direct Discharges (RID) monitoring programme until 2025, and those data have not yet available. The Scottish Environmental Protection Agency (SEPA) suffered a complex cyber-attack in December 2020 and have only been able to resume full RID monitoring in 2025. Alongside restored monitoring for 2025/26, several ongoing research and development projects are exploring timeseries gap filling, which should enable full reporting of this indicator again from 2026 onwards including robust estimated loads for 2020-2025 when only partial monitoring was carried out.
Development plan
Since our previous publication we have adapted the language and visualisations used in this indicator, we are keen to hear from our users about these changes, as well as our published development plan, please email us.
Categories:
Published: