Air Pollution: Area affected by acidity and area affected by nitrogen
Last updated: 2025
Latest data available: 2021 (mid-year of the 3-year moving window 2020 to 2022)
Note
This indicator has not been updated this year. The source data comes from Defra’s Air Pollution Trends Report, which has not yet been updated with 2022 data.
The key measure - percentage of habitat area exceeding critical loads - can be insensitive to year-on-year changes, as the area exceeded may remain constant even if the magnitude of exceedance varies. To address this, we have included additional data showing the Average Accumulated Exceedance (AAE). This measure averages exceedance across the entire habitat area, providing a more sensitive indication of changes in exceedance magnitude.
Introduction
This indicator shows the proportion of sensitive habitat that is affected by two major impacts of air pollution: acidification; and the excessive richness of nitrogen (eutrophication). The air pollutants sulphur dioxide, nitrogen oxides and ammonia can contribute to acidification; nitrogen oxides and ammonia can also contribute to terrestrial eutrophication. These pollutants arise mainly from livestock waste and from burning fossil fuels in industry and road transport. More than a third (36%) of UK land area (91,000 km2) is sensitive to acidification, and 38% (94,000 km2) is sensitive to nutrient nitrogen (eutrophication); many areas (almost 72,000 km2) are sensitive to both.
Critical loads are thresholds for pollutant load above which significant harmful effects may occur on sensitive habitats; statistics on critical load exceedance indicate the risk of damage. To reduce the effects of meteorological variation, exceedance statistics are reported as the mean over three years of data, with time periods referred to by the middle year. For example, “2020” refers to the period from 2019 to 2021.
The data for this indicator can be found in the published datafile on the JNCC’s Resource Hub, we also have a similar indicator at the England level.
Type of indicator
Pressure indicator
Type of official statistic
Official statistic
Contents
- Assessment of change
-
Key results
- Figure 1: Percentage area of sensitive terrestrial UK habitats exceeding critical loads for acidification and eutrophication, in the UK, 2003 to 2021
- Figure 2: Percentage area of sensitive terrestrial UK habitats exceeding critical loads for acidification and Average Accumulated Exceedance expressed as excess acidity, in the UK, 2003 to 2021
- Figure 3: Percentage area of sensitive terrestrial UK habitats exceeding critical loads for eutrophication and Average Accumulated Exceedance expressed as excess nitrogen, in the UK, 2003 to 2021
- Further detail
- Acknowledgements
- Technical annex
Assessment of change
Assessment of change in the area of sensitive terrestrial UK habitat exceeding critical loads:
| Measure | Assessment | Time period | Result |
|---|---|---|---|
| Area affected by acidity | Long term | 2003 to 2021 | Improving |
| Area affected by acidity | Short term | 2016 to 2021 | Improving |
| Area affected by nitrogen | Long term | 2003 to 2021 | Improving |
| Area affected by nitrogen | Short term | 2016 to 2021 | Improving |
Notes on the indicator assessment
Long- and short-term assessments are based on a 3% rule of thumb. Where possible, the base years for these assessments use a three-year average. See Assessing Indicators.
Key results
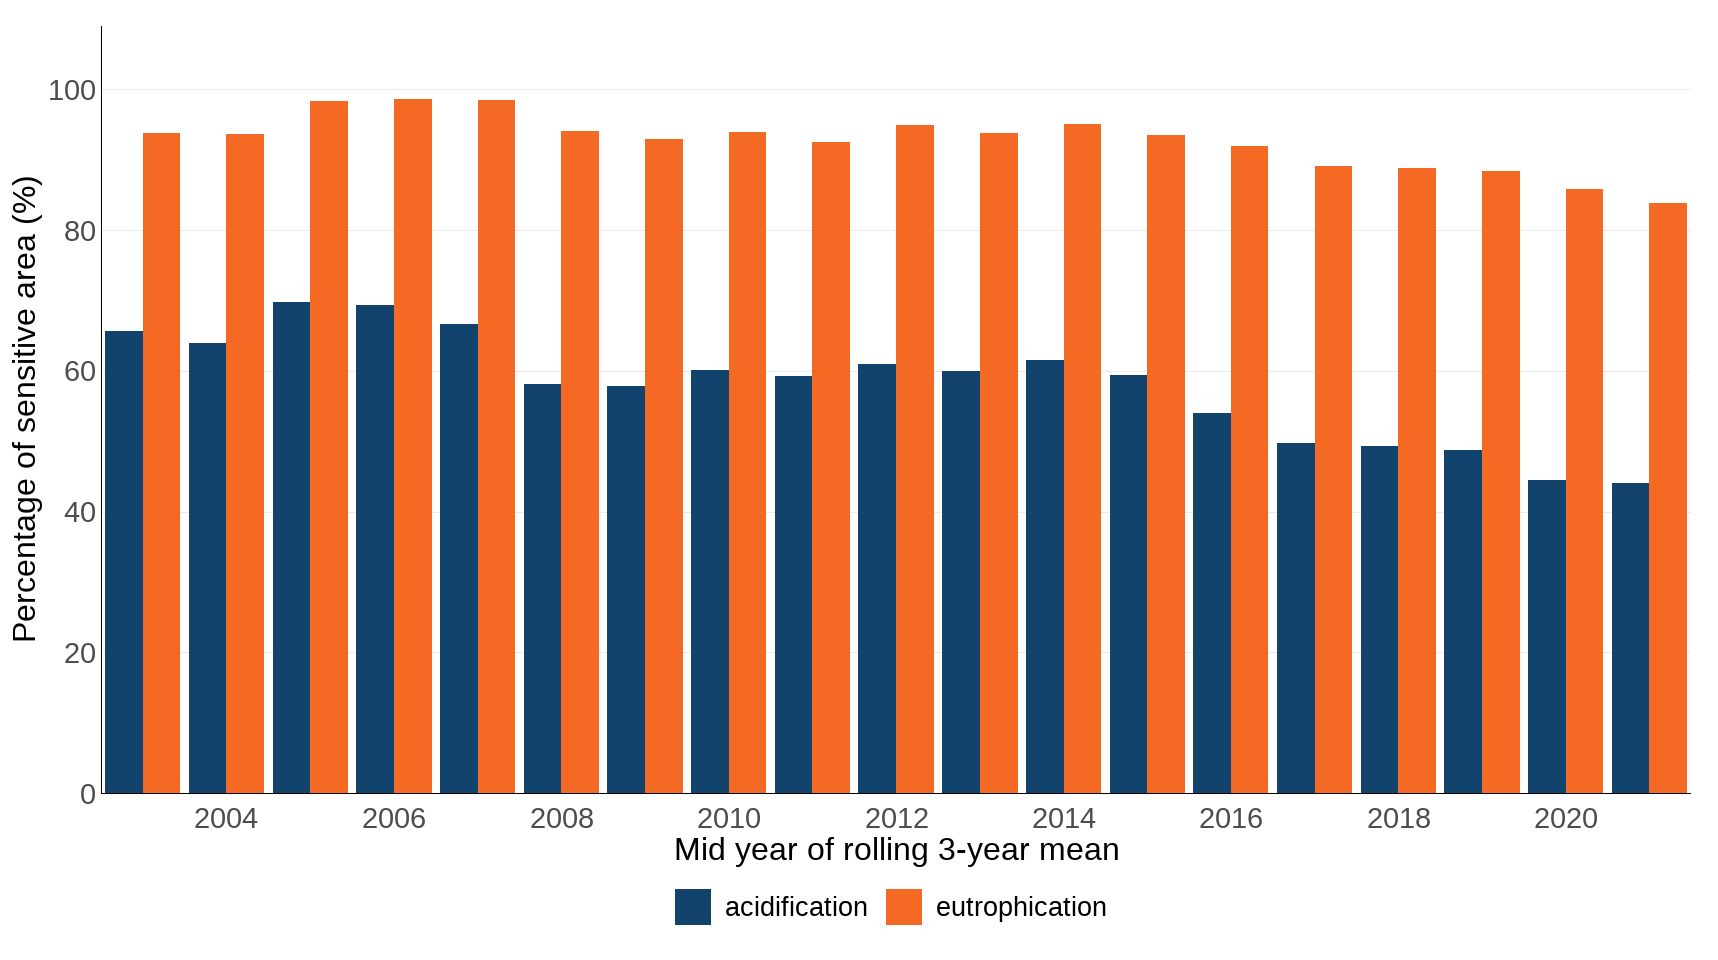
In 2003, acid deposition exceeded critical loads in 66% of the UK area of sensitive terrestrial habitats. This declined to 44% in 2021. The short-term trend between 2016 and 2021 showed a 18% decrease in the area affected by acidity.
In 2021, nitrogen deposition exceeded the critical load for eutrophication in 84% of sensitive habitats. This was a decrease from a level of 94% in 2003. In the short term, the area where nitrogen deposition exceeded critical load showed a 9% decrease between 2016 and 2021.
Based on these figures, the habitat areas at risk from acid and nitrogen deposition have declined over the longer term (2003 to 2021). However, reducing deposition below the critical loads does not necessarily mean that ecosystems will recover immediately, as there can be a time-lag before the chemical environment and the flora and fauna recover.
Figure 1: Percentage area of sensitive terrestrial UK habitats exceeding critical loads for acidification and eutrophication, in the UK, 2003 to 2021
Source: UK Centre for Ecology & Hydrology
Notes about Figure 1
- Each bar represents a rolling three-year average of deposition data. To reduce the effects of year-to-year variation in meteorology, exceedance statistics are reported as the mean of three years of data. In Figure 1, time periods are referred to using the middle year of the three. For example, “2020” means the period 2019 to 2021.
Figures 2 and 3 show the percentage area of sensitive terrestrial UK habitats exceeding critical loads for acidification and eutrophication, as well as the Average Accumulated Exceedance (AAE) for excess acidity and nitrogen. AAE provides an indication of changes in the magnitude of exceedance across the entire habitat, offering a more sensitive measure of change.
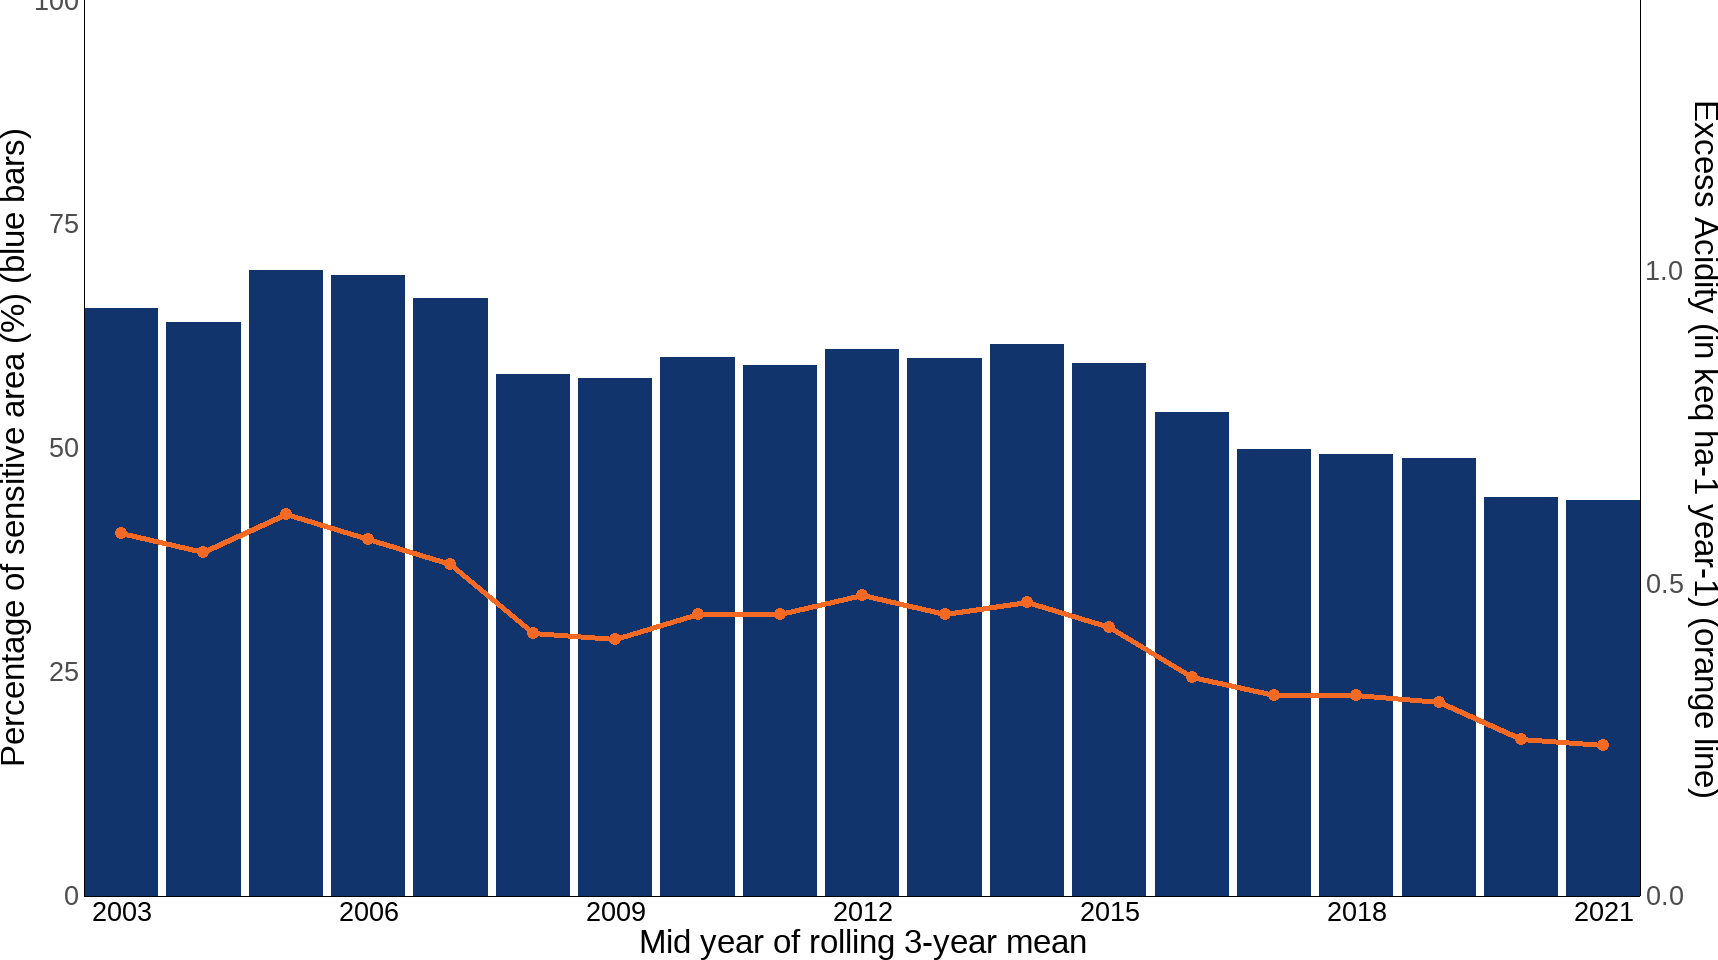
The trend results show that the UK area of sensitive habitats exceeding acidity critical loads decreased from 65.6% in 2003 to 44.1% in 2021; over this timescale the magnitude of exceedance (AAE or Excess Acidity) has fallen by almost 59%, from 0.58 keq ha-1 year-1 in 2003 to 0.24 keq ha-1 year-1 in 2021 (Figure 2).
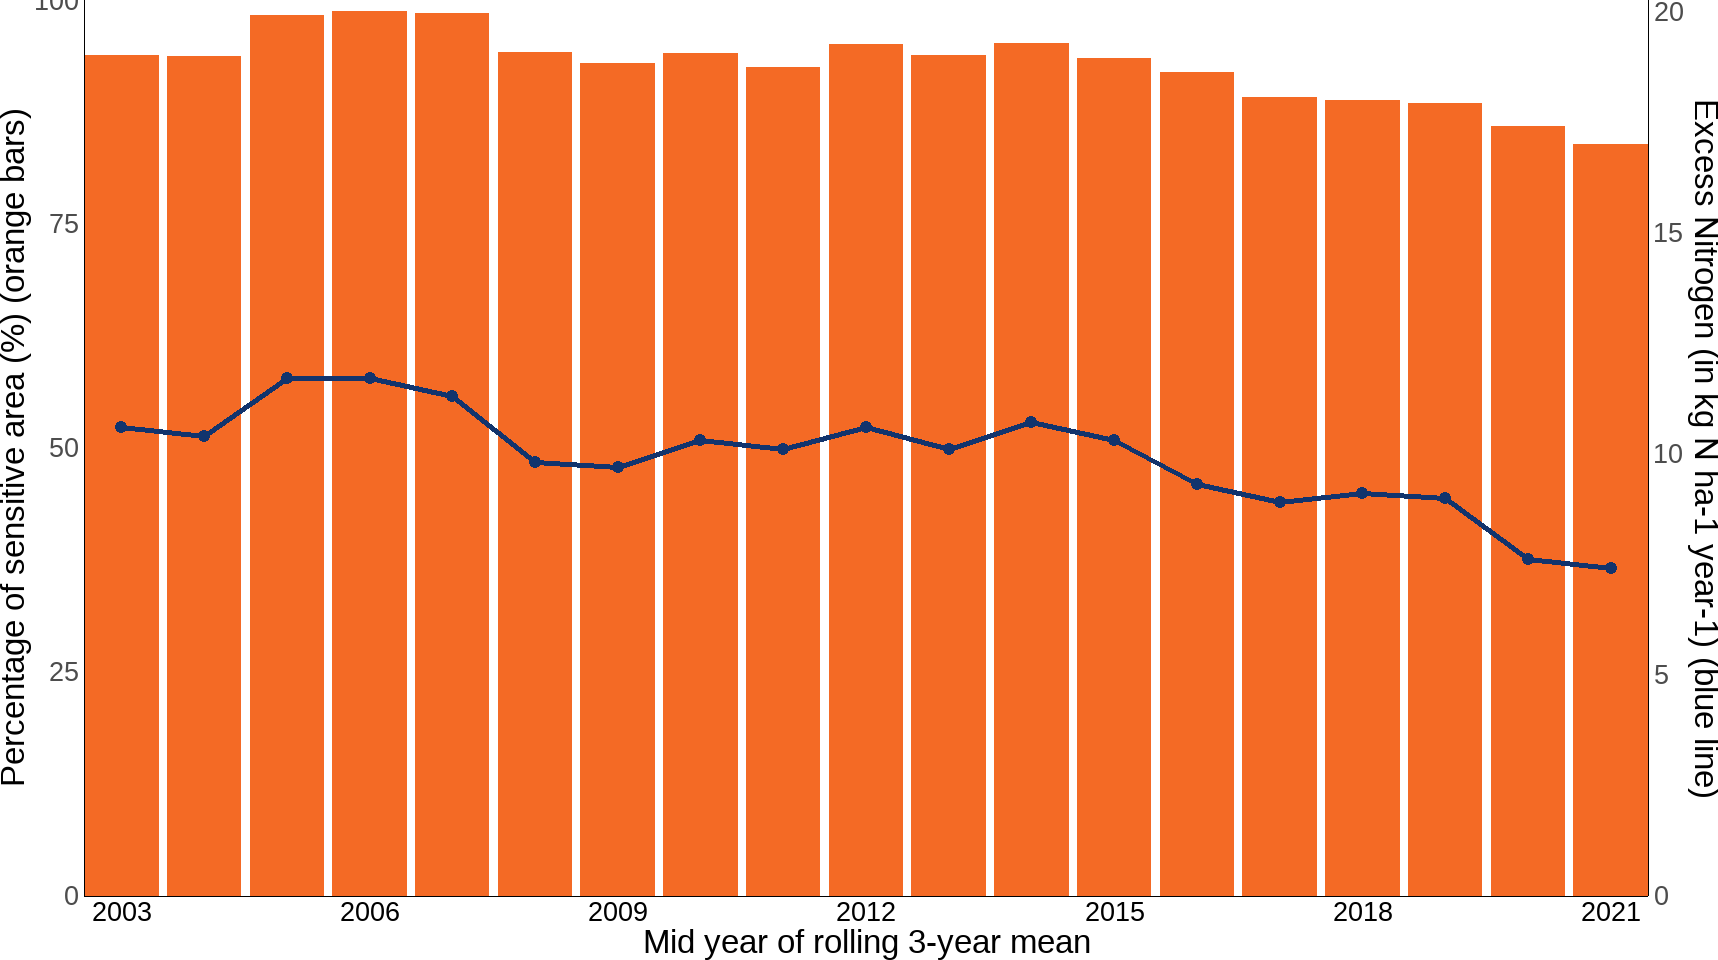
During the same period, the UK area of sensitive habitats where eutrophying pollutants (nutrient nitrogen) exceed critical loads fell from 93.8% to 83.9% and the AAE (Excess Nitrogen) across the UK decreased by 30%, from 10.6 kg to 7.4 kg N ha-1 year-1 (Figure 3).
Figure 2: Percentage area of sensitive terrestrial UK habitats exceeding critical loads for acidification and Average Accumulated Exceedance expressed as excess acidity, in the UK, 2003 to 2021
Source: UK Centre for Ecology & Hydrology
Notes about Figure 2
- Each bar and data point on the line represents a rolling three-year average of deposition data. To reduce the effects of year-to-year variation in meteorology, exceedance statistics are reported as the mean of three years of data. In Figure 2, time periods are referred to using the middle year of the three. For example, “2020” means the period 2019 to 2021.
- The blue bars represent the percentage of sensitive area exceeded and the orange line shows the magnitude of exceedance, expressed as excess acidity in keq ha-1 year -1.
Figure 3: Percentage area of sensitive terrestrial UK habitats exceeding critical loads for eutrophication and Average Accumulated Exceedance expressed as excess nitrogen, in the UK, 2003 to 2021
Source: UK Centre for Ecology & Hydrology
Notes about Figure 3
- Each bar and data point on the line represents a rolling three-year average of deposition data. To reduce the effects of year-to-year variation in meteorology, exceedance statistics are reported as the mean of three years of data. In Figure 3, time periods are referred to using the middle year of the three. For example, “2020” means the period 2019 to 2021.
- The orange bars represent the percentage of sensitive area exceeded and the blue line shows the magnitude of exceedance, expressed as excess nitrogen in kg N ha-1 year-1.
Further detail
Critical loads are thresholds above which significant harmful effects on sensitive habitats may occur, according to current levels of scientific understanding. Critical loads have been established separately for acidification and nutrient nitrogen (eutrophication effects). The pollutants causing acidification and eutrophication mainly arise as a result of emissions from livestock waste and from burning fossil fuels in industry and road transport.
Critical loads data for freshwaters (not reported here; see Air Pollution Trends Report 2024) are available for 1,752 sites selected across the UK where water samples have been collected and analysed – these data do not provide complete UK coverage. The critical loads data for all the other habitats listed below are based on national-scale habitat distribution maps. In all years, a three-year rolling average deposition figure is used to smooth substantial year-to-year variability caused by the influence of weather on atmospheric chemistry and time periods are referred to using the middle year of the three; for example, “2010” means the period 2009 to 2011.
Critical loads for acidification and nutrient nitrogen have also been applied to interest features of protected sites (Special Areas of Conservation, Special Protection Areas and Areas/Sites of Special Scientific Interest). Further information on critical load exceedance on protected sites is available in the Air Pollution Trends Report 2024 and on the Air Pollution Information System (APIS) website.
For information on the methods used in this indicator, please see the technical annex.
Relevance
The air pollutants sulphur dioxide, nitrogen oxides and ammonia can contribute to acidification, and nitrogen oxides and ammonia can contribute to terrestrial eutrophication, both of which adversely affect semi-natural ecosystems. Exceeding the critical load for acid deposition is likely to cause low soil pH and high aluminium availability, making the habitat unsuitable for many species. Excess nitrogen as a nutrient can also affect species composition, for example, by triggering accelerated growth of some species at the expense of others. These species and habitats tend to be of high conservation value and are often the first ones to be affected. This in turn can lead to loss of ecosystem function.
International/domestic reporting
The suite of UK Biodiversity Indicators has been revised and updated to bring it in line with the Kunming-Montreal Global Biodiversity Framework (GBF) of the Convention on Biological Diversity (CBD). Some UKBIs will be used for the forthcoming UK national reports to CBD.
Web links for further information
Acknowledgements
Thank you to the many people who have contributed by providing data and to the many colleagues who have helped produce this indicator, particularly the UK Centre for Ecology and Hydrology.
Technical annex
Methodology
There are three main steps in the assessment of the area of sensitive habitat that exceeds critical loads:
- calculation of critical loads for each of the sensitive habitats;
- mapping of the habitats; and
- identification of the area of habitat where deposition exceeds the critical load.
Several methods are used to calculate critical loads for terrestrial habitats in the UK, based on either empirical (observational or experimental) evidence or mass-balance (input/output) data. Both types of method can be used to calculate critical loads for acidity and eutrophication, the choice of which method to use is determined by the habitat type.
Critical loads are reviewed and updated periodically as new research data becomes available. Critical loads for nutrient nitrogen were established in 2003, and revised in 2011. For all years, exceedance is calculated using the 2011 values for nutrient nitrogen critical loads. Details of the revision can be found in the 2011 UK Status Report and the 2015 Methods Report, available on the Critical Loads and Dynamic Modelling website. The latest revision of nutrient nitrogen critical loads was published in October 2022 and has been included since the 2023 update of this indicator. Most of the critical loads have been reduced (become stricter) and in most cases, the reliability of these values has increased. Details can be found in the Review and revision of empirical critical loads of nitrogen for Europe. The method for calculating acidity critical loads remain unchanged from those published earlier see Air Pollution Trends Report 2024. The trends in critical loads exceedances are calculated using deposition maps based on the Concentration Based Estimated Deposition (CBED) methodology. To identify the area exceeding critical loads, deposition maps based on a 5km x 5km grid covering the UK are produced based on the sum of wet deposition, dry deposition and cloud deposition. These are available on the UKCEH website. These deposition data are overlain on maps of critical loads for each habitat to calculate critical load exceedances and the areas of habitat exceeded.
Average Accumulated Exceedance
This indicator shows the percentage area of habitat with exceedance of critical loads but it can be insensitive to changes between years, since the area exceeded can remain the same even if there is a change in the magnitude of the exceedance. The “Average Accumulated Exceedance” (AAE) averages the exceedance across the entire habitat area and so gives an indication of change in the magnitude of exceedance (Figures 2 and 3).
AAE is calculated as: (exceedance × exceeded habitat area) ÷ (total sensitive habitat area)
Table 1: The 14 habitats considered sensitive to acidification and/or eutrophication for which critical loads are calculated
| Habitat | Critical loads calculated for acidification | Critical loads calculated for eutrophication | |
|---|---|---|---|
| Acid Grassland | Yes | Yes | |
| Calcareous Grassland | Yes | Yes | |
| Dwarf Shrub Heath | Yes | Yes | |
| Bog | Yes | Yes | |
| Montane | Yes | Yes | |
| Coniferous Woodland | Yes | Yes | |
| Beech Woodland | No | Yes | |
| Oak Woodland on acid soil | No | Yes | |
| Scots pine | No | Yes | |
| Dune Grassland | No | Yes | |
| Saltmarsh | No | Yes | |
| Mixed Woodland | No | Yes | |
| Freshwaters (1752 sites) | Yes | No | |
| Broadleaved and mixed woodland | Yes | No |
Table 2: Percentage area of sensitive UK habitats exceeding critical loads for acidification and eutrophication by country for 2021
| Country | Acidification (%) | Eutrophication (%) |
|---|---|---|
| UK | 44.1 | 83.9 |
| England | 66.7 | 99.3 |
| Wales | 70.6 | 99.1 |
| Scotland | 28.6 | 73 |
| Northern Ireland | 66.8 | 96.9 |
Development plan
Since our previous publication we have adapted the language and visualisations used in this indicator. We are keen to hear from our users about these changes, as well as our published development plan, please email us.
Categories:
Published: