Status of priority species: distribution
Last updated: 2025
Latest data available: 2024
Introduction
This indicator measures change in the number of one kilometre grid squares across the UK in which priority species were recorded in any given year. This is referred to as the ‘occupancy index’ and is effectively equivalent to changes in the distribution of priority species for which data are available. Priority species are defined as those appearing on one or more of the biodiversity lists of each UK country (Natural Environmental and Rural Communities Act 2006 - Section 41 (England), Environment (Wales) Act 2016 section 7, Northern Ireland Priority Species List, Scottish Biodiversity List). The combined list contains 2,890 species in total. The priority species were highlighted as being of conservation concern for a variety of reasons, including rapid decline in some of their populations. The indicator will increase when priority species become more widespread on average, and decrease when species become less widespread on average.
The method for calculating this indicator has been updated this year in order to incorporate larger groups into the indicator, such as butterflies. This method is not yet finalised and will be further developed (see Development plan). The number of species is higher (506 versus 476) than in the previous publication (last updated in 2021) of the priority species distribution indicator. This is because of the addition of new groups and the update of data for many groups which allowed for the additional species to be included (see Technical annex for more details).
This indicator should be read in conjunction with the priority species relative abundance indicator which provides data on those species for which abundance information is available.
Data for this indicator can be found in the published datafile. We also produce a similar indicator at the England scale.
Type of indicator
State Indicator
Type of official statistics
Official statistics in development – indicator under development: The biodiversity indicators project team would welcome feedback on the novel methods used in the development of this indicator, please email us. For more information, please visit the UK Statistics Authority’s website on Types of official statistics – UK Statistics Authority.
Contents
- Assessment of change
- Key results
- Further detail
- Acknowledgements
-
Technical annex
- Background
- Data sources and species-specific time series
- Methodology
- Assessment of change
- Species list
- Development work
- Figure 4: A comparison of index scores derived from sparta (left) and occti (right). The first two rows show indices for the 15 most reported species in dragonflies (first row) and hoverflies (second row), while the third and fourth rows show indices for the 15 least reported species in dragonflies and hoverflies. All panels include 95% credible intervals.
- Caveats
- Development plan
- References
Assessment of change
As this is an official statistic in development, it has not been assessed.
Key results
Official lists of priority species have been published for each UK country. There are 2,890 species on the combined list; actions to conserve them are included within the respective countries’ biodiversity or environment strategies. This indicator shows the average change in the 506 species for which distribution trends are available in the UK.
Since the previous publication, the Biological Records Centre has received additional data for Ants, Aquatic bugs, Bees, Butterflies, Carabids, Craneflies, Dragonflies, Empid & Dolichopodid Flies, Ephemeroptera, Fungus gnats, Hoverflies, Leaf and seed beetles, Orthoptera, Rove beetles, Soldier beetles, Soldier flies, Trichoptera, Wasps and Weevils. These data are included in this year’s indicator.
By 2024, the index of distribution of priority species in the UK decreased to 83%, a decrease of 17% of the 1970 value (Figure 1). Over this long-term period, 18% of species showed a strong or weak increase and 29% showed a strong or weak decline (Figure 2).
More recently, between 2019 and 2024, the distribution index decline remained stable. Over this short-term period, 10% showed a strong or weak increase and 9% showed a strong or weak decline.
Figure 1: Change in distribution of 506 UK priority species, 1970 to 2024
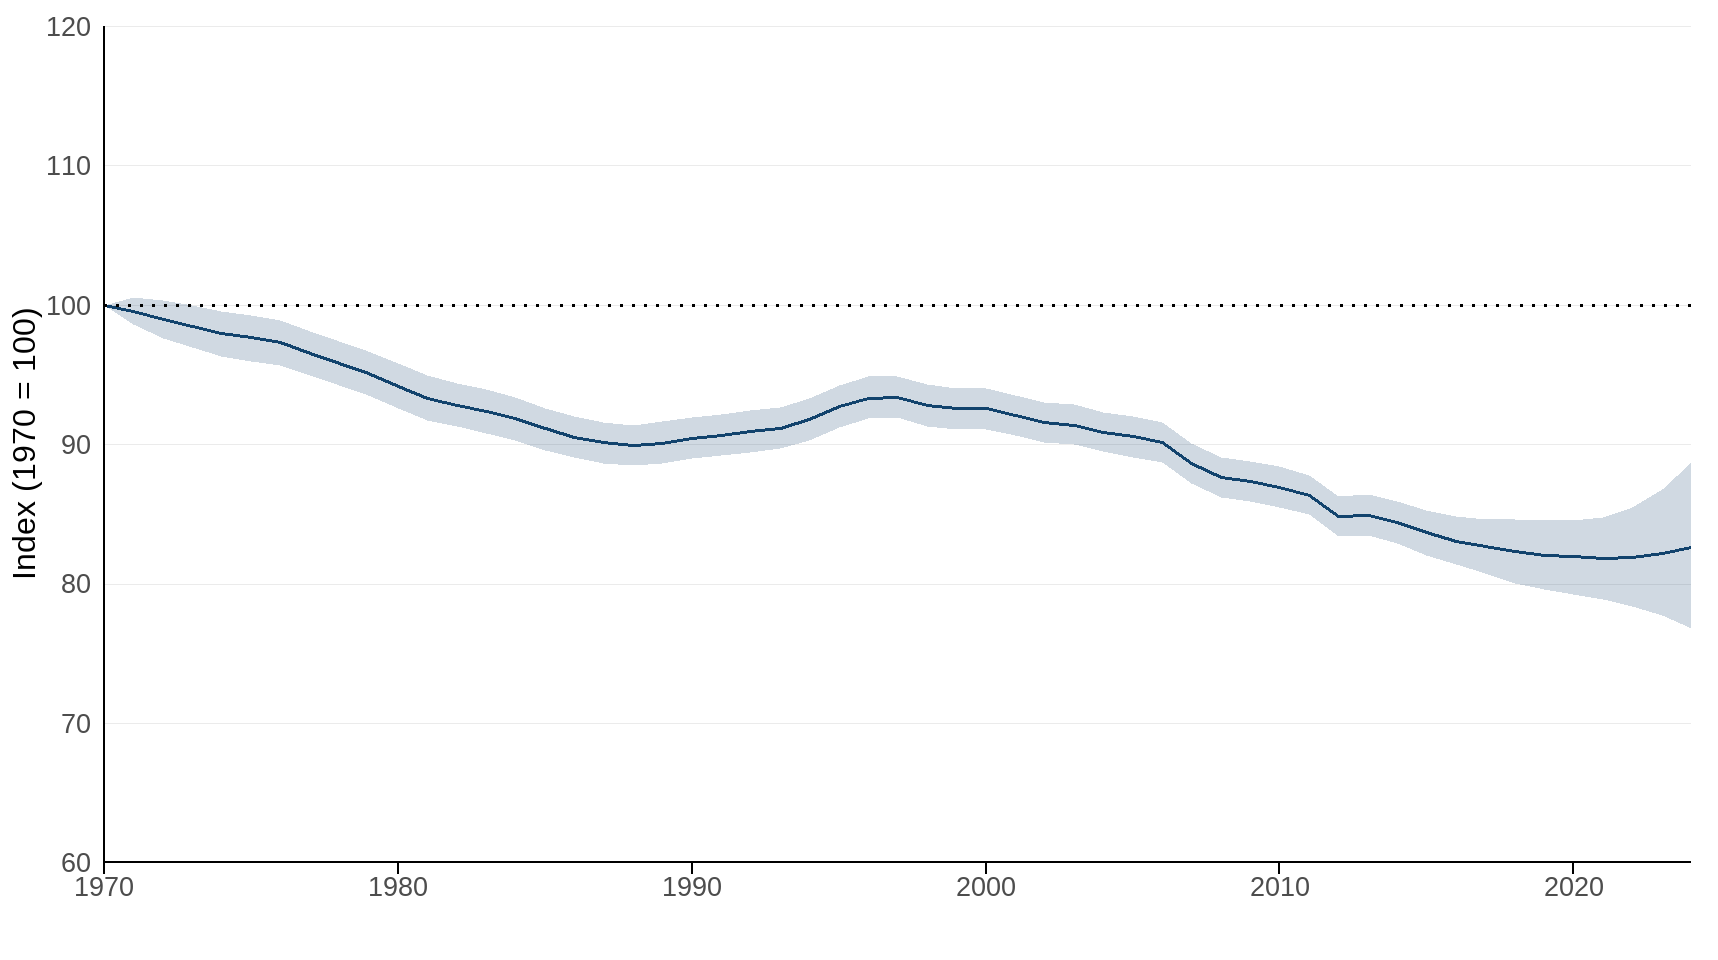
Source: biological records data collated by a range of national schemes and local data centres
Notes about Figure 1
- The line graph shows the smoothed trend (solid line) with variation around the line (shaded area) within which users can be 95% confident that the true value lies (credible interval). The width of the credible interval (CI) is in part determined by the proportion of species in the indicator for which data are available.
- All species in the indicator are present on one or more of the country priority species lists (Natural Environmental and Rural Communities Act 2006 – Section 41 (England), Environment (Wales) Act 2016 section 7, Northern Ireland Priority Species list, Scottish Biodiversity List).
- These charts are not directly comparable to previous versions of the indicator. Inclusion of new data has increased the number of species that can be included in the indicator from 476 in 2021, to 506 here.
Figure 2: Long-term and short-term changes in 506 UK priority species’ distribution trends, 1970 to 2024
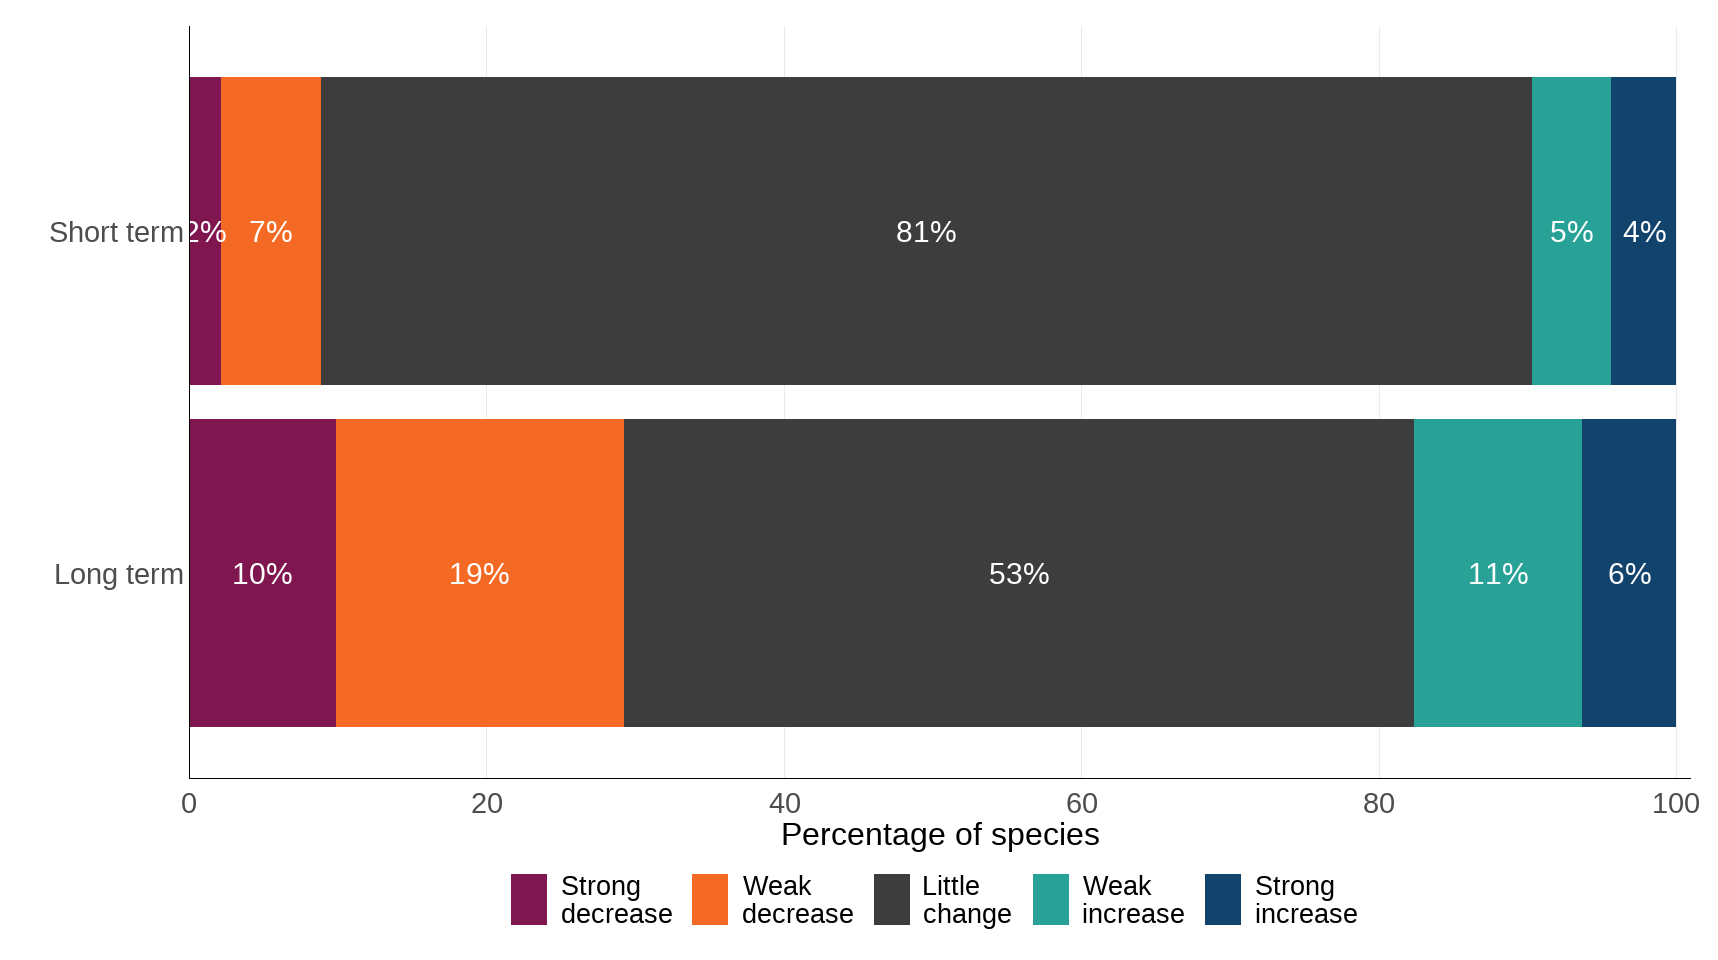
Source: biological records data collated by a range of national schemes and local data centres
Notes about Figure 2
- The bar chart shows the percentage of species within the indicator that have increased, decreased or shown little change in distribution (measured as the proportion of occupied sites), based on set thresholds of change.
- All species in the indicator are present on one or more of the country priority species lists (Natural Environmental and Rural Communities Act 2006 – Section 41 (England), Environment (Wales) Act 2016 section 7, Northern Ireland Priority Species list, Scottish Biodiversity List).
- These charts are not directly comparable to previous versions of the indicator. Inclusion of new data has increased the number of species that can be included in the indicator from 476 in 2021, to 506 here.
Further detail
The trends of the taxonomic groups included within a multi-species indicator are often obscured by its composite nature. Indicator lines have been generated for a number of sub-groups using the same method so that the trends for these groups can be seen more clearly (see Figure 3). The bees, wasps and ants group experienced an overall decline, with an index value in 2023, 93% of that in 1980. These are counterbalanced by increases in bryophytes, which had an index value of 146 in 2016. The moths have undergone the biggest decline with an index value in 2016 of 68% of the value in 1970. Similar strong declines in moths were noted in the priority species abundance indicator. The underpinning causes of this decrease are not completely understood. The moth indicator has not been updated this year with the latest available data due to issues with computational and model performance (see ‘Development work’ in the Technical annex for more details).
Since 2021, data updates to the Biological Records Centre database were received for 20 taxonomic groups: Ants, Aquatic bugs, Bees, Butterflies, Carabids, Longhorn beetles, Dragonflies, Empid & Dolichopodid Flies, Ephemeroptera, Fungus gnats, Hoverflies, Ladybirds, Leaf and seed beetles, Orthoptera, Rove beetles, Soldier beetles, Soldier flies, Trichoptera, Wasps and Weevils.
Figure 3: Change in distribution of 506 priority species, by taxonomic group, 1970 to 2024
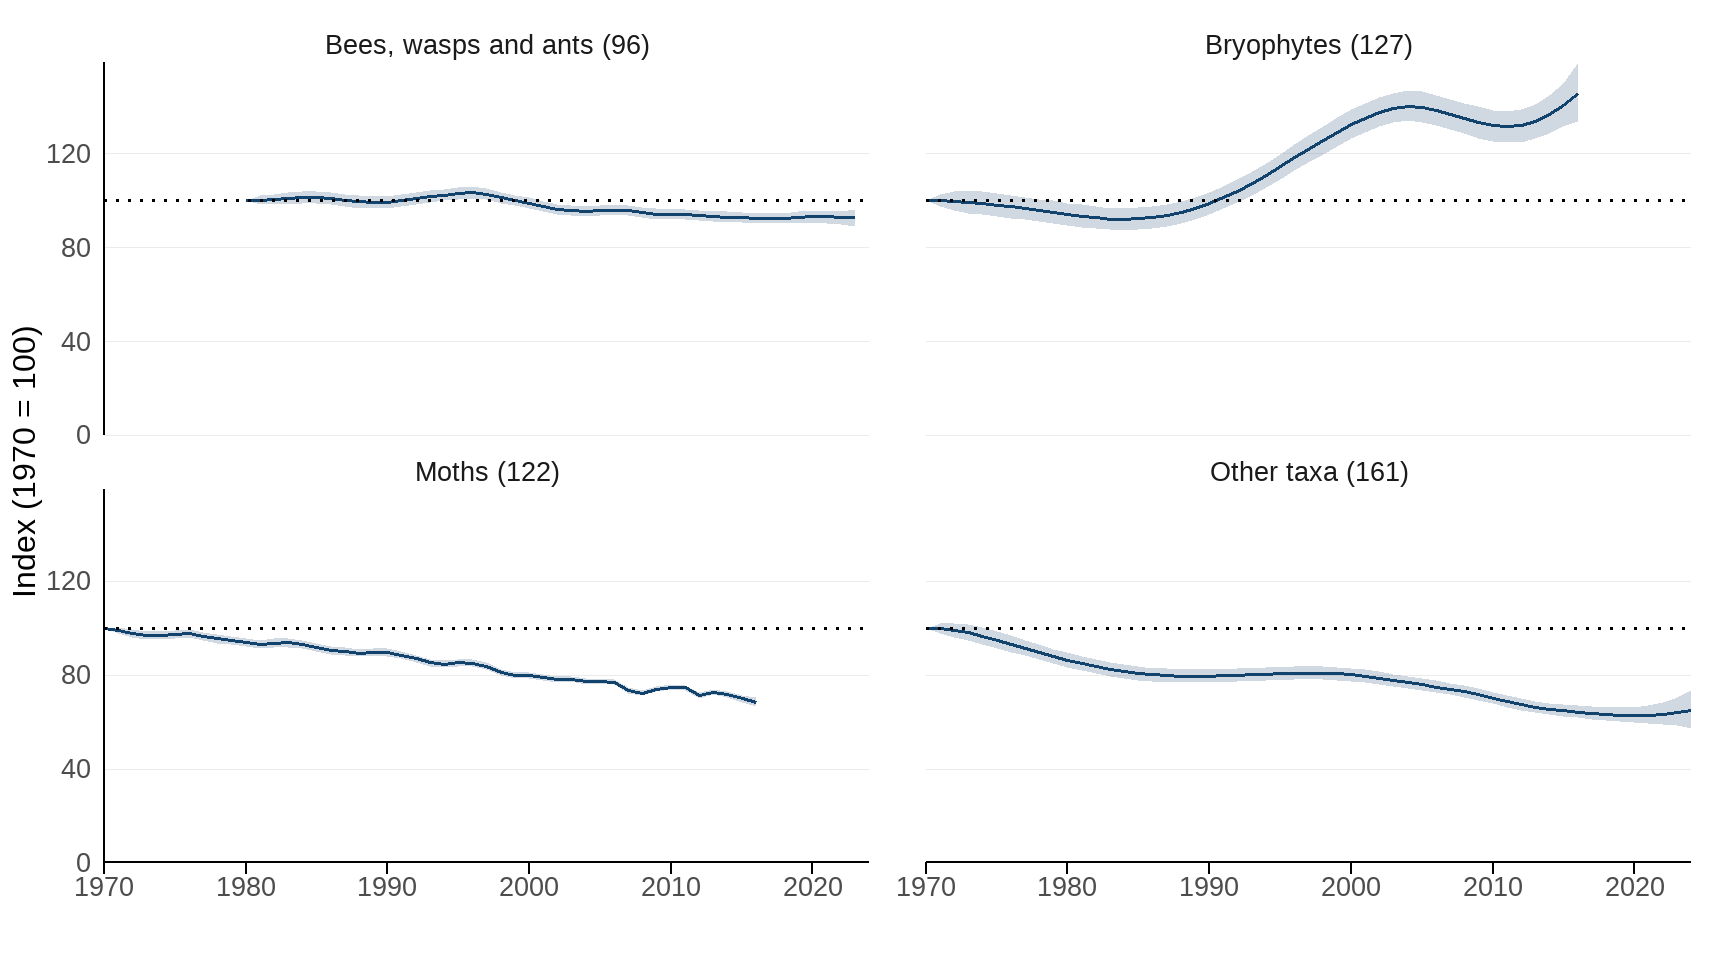
Source: biological records data collated by a range of national schemes and local data centres
Notes about Figure 3
- The graphs show the smoothed trend (solid line) with its 95% credible interval (shaded area) for each of the taxonomic groups included in the composite indicator. The width of the credible interval is in part determined by the proportion of species in the indicator for which data are available.
- The figures in brackets show the number of species included in each measure.
- Other taxa includes a number of insect groups, molluscs and spiders.
- All species in the indicator are present on one or more of the country priority species lists (Natural Environmental and Rural Communities Act 2006 – Section 41 (England), Environment (Wales) Act 2016 section 7, Northern Ireland Priority Species list, Scottish Biodiversity List).
- The indicator for bees, wasps and ants starts in 1980 and the indicator for moths ends in 2016.
- These charts are not directly comparable to previous versions of the indicator. Inclusion of new data has increased the number of species that can be included in the indicator from 476 in 2021, to 506 here.
Priority species are defined as those appearing on one or more of the biodiversity lists of each UK country (Natural Environmental and Rural Communities Act 2006 - Section 41 (England); Environment (Wales) Act 2016 section 7, Northern Ireland Priority Species List, Scottish Biodiversity List). The combined list contains 2,890 species in total. The priority species were highlighted as being of conservation concern for a variety of reasons, including rapid decline in some of their populations. Actions to conserve these priority species are included within the respective countries’ biodiversity or environment strategies.
Of the 2,890 species on the combined priority species list, the 506 for which robust quantitative time-series of the proportion of occupied sites available are included in the indicator. These 506 species include bees, wasps and ants (96); bryophytes (127); moths (122); and other taxa (161). The other taxa include a number of insect groups, non-marine molluscs and spiders. Previous versions of this indicator also included lichens, but these have been removed in this iteration due to concerns that the occupancy model did not accurately reflect trends in species occupancy. These species have not been selected as a representative sample of priority species and they cover only a limited range of taxonomic groups. The measure is therefore not fully representative of species in the wider countryside. See the Technical annex for more detail.
The relative change in distribution of each of these species is measured by the number of one kilometre grid squares across the UK in which they were recorded – this is referred to as the ‘occupancy index’. The occupancy index will increase when a species becomes more widespread; it will decrease when a species becomes less widespread.
Uncertainty in the species-specific annual occupancy estimates are incorporated into the overall indicator; details of how this was done are included in the Technical annex.
Relevance
Priorities for species and habitat conservation are set at a country level through country biodiversity or environment strategies. Each country has an identified list of priority species, which are of high conservation concern due, for example, to restricted range or population declines. The indicator therefore includes a substantial number of species that, by definition, are becoming less widespread.
Measures of distribution are less sensitive to change than measures of abundance (see priority species abundance indicator). Nonetheless, if a threatened species that has been declining starts to recover, its distribution should stabilise, and may start to increase. If the proportion of species in the indicator that are stable or increasing grows, the indicator will start to decline less steeply. If the proportion declines, it will fall more steeply. Success can therefore be judged by reference to trends in both indicators, as well as other information on other priority species for which there are insufficient data for inclusion in the indicator.
International/domestic reporting
The suite of UK Biodiversity Indicators has been revised and updated to bring it in line with the Kunming-Montreal Global Biodiversity Framework (GBF) of the Convention on Biological Diversity (CBD). Some UKBIs will be used for the forthcoming UK national reports to CBD.
Web links for further information
- Aquatic Heteroptera Recording Scheme: Home page
- British Arachnological Society Spider Recording Scheme: Home page
- Bees, Wasps and Ants Recording Society: Identification guides to download
- British Bryological Society: Home page
- British Dragonfly Society: Recording Dragonflies and Damselflies in the British Isles
- British Lichen Society: Home page
- British Myriapod and Isopod Group: Centipede and Millipede recording schemes
- Bruchidae & Chrysomelidae Recording Scheme: Relevant BRC webpage
- Butterfly Conservation: Butterflies and Moths
- Conchological Society of Great Britain and Ireland: Home page
- Dipterists Forum: Cranefly,Empididae & Dolichopodidae, Fungus gnat Recording Schemes
- Gelechiid Recording Scheme: Home page
- Ground Beetle Recording Scheme: Home page
- Hoverfly Recording Scheme: Home page
- Hypogean Crustacea Recording Scheme: Home page
- Lacewings and allies: Recording schemes
- National Moth Recording Scheme: Home page
- Orthoptera Recording Scheme: Home page
- Riverfly Recording Schemes: Ephemeroptera, Plecoptera and Trichoptera: Home page
- Soldierflies and Allies Recording Scheme: Home page
- Staphylinidae Recording Scheme: Relevant BRC webpage
- Terrestrial Heteroptera Recording Scheme - Shield bugs and allied species: Home page
- UK Biodiversity Partnership: UK Biodiversity Action Plans
- UK Centre for Ecology & Hydrology – Biological Records Centre: Recording Schemes
- UK beetle recording: Weevil and Bark Beetle Recording Schemes
- Natural England: S41 List of priority species in England
- NatureScot Scottish Biodiversity List
- Wales Biodiversity Partnership Section 7 priority species in Wales
- Northern Ireland Environment Agency Northern Ireland Priority Species List
Acknowledgements
Thank you to the many people who have contributed by collecting, collating and providing the data behind this indicator. Furthermore, we appreciate the many colleagues who have helped produce this indicator.
Technical annex
Background
The measure is a composite indicator of 506 species from 23 taxonomic groups (seven of the 30 groups originally modelled did not contain any species with sufficient data to be included in the final analysis), see Species List for a detailed breakdown of the species and groups in the indicator. The priority species identified in each of the four UK countries were highlighted as being of conservation concern for a variety of reasons, including their scarcity, their iconic nature or a rapid decline in their population. They are not representative of wider species in general. They do however include a range of taxonomic groups and will respond to the range of environmental pressures that biodiversity policy aims to address, including land use change, climate change, invasive species and pollution. The short-term assessment of change can be used to assess the impact of recent conservation efforts and policy aimed at halting and reversing species declines. However, natural fluctuations (particularly in invertebrate populations) and short-term response to weather may have a strong influence on the short-term assessment.
Regardless of advances in statistical techniques and the increase in the number of biological records collected, there are likely to be species on the priority lists for which little monitoring or occurrence data is available. Reasons for this include rarity, difficulty of detection, or those for which monitoring methods are unreliable or unavailable. In order for the indicator to be representative of priority species, a method of assessing the changing status of these remaining data-poor species would need to be considered.
The indicator represents annual change in the geometric mean estimated occupancy across the constituent species. The index is set to a value of 100 in the start year (the baseline), so that changes subsequent to this represent proportional change in occupancy; if on average species’ trends doubled, the indicator would rise to 200, if they halved it would fall to a value of 50.
Data sources and species-specific time series
Biological records data are used to produce an indicator of change based on annual estimates of the proportion of occupied sites (“occupancy”) for a set of priority species in the UK. Biological records are observations of species in a known place in space and time. These data are curated by the Biological Records Centre. They include data from the following recording schemes: Aquatic Heteroptera Recording Scheme, Bees, Wasps and Ants Recording Society, British Arachnological Society Spider Recording Scheme, British Bryological Society, British Isles Neuropterida Recording Scheme, Centipede Recording Scheme, British Myriapod and Isopod Group, Millipede Recording Scheme, Bruchidae & Chrysomelidae Recording Scheme, Conchological Society of Great Britain and Ireland, Cranefly Recording Scheme, British Dragonfly Society, Empididae & Dolichopodidae Recording Scheme, Fungus Gnat Recording Scheme, Gelechiid Recording Scheme, Ground Beetle Recording Scheme, Hoverfly Recording Scheme, National Moth Recording Scheme, Orthoptera Recording Scheme, Riverfly Recording Schemes: Ephemeroptera, Plecoptera and Trichoptera, Soldierflies and Allies Recording Scheme, Staphylinidae Recording Scheme, Terrestrial Heteroptera Recording Scheme - Shield bugs and allied species and the Weevil and Bark Beetle Recording Scheme + Scolytidae.
Most records are made by volunteer recorders and whilst these data may be collected following a specific protocol, the majority of records in these datasets are opportunistic. The intensity of recording varies in both space and time (Isaac et al., 2014a and b), which is a challenge for estimating robust quantitative trends. Fortunately, a range of methods now exist for producing such trends using unstructured biological records data (e.g., Szabo et al., 2010; Hill, 2012; Isaac et al., 2014a and b). We follow previous versions of these distribution indicators by using Bayesian occupancy models to analyse these species occurrence datasets (Isaac et al., 2014a and b). The occupancy approach attempts to model the data collection process and produces annual estimates for each species of the proportion of occupied sites (van Strien et al., 2013).
By using occupancy models to analyse occurrence records, greater taxonomic coverage was achieved for the 2015 version of the indicator (Eaton et al. 2015). Further improvements to the occupancy modelling framework (Outhwaite et al. 2018) enabled the inclusion of more taxonomic groups (for example, lichens, craneflies and weevils) in the 2020 indicator and more species from groups included in previous indicators. Since 2021, new rules-of-thumb for assessing the data available for each species (Pocock et al. 2019) have been applied.
Annual estimates of occupancy from between 1970 and 2024 were used for the multi-species indicator. However, some datasets finished at different years within this time period. Since the 2021 update of the indicator the Biological Records Centre has received substantial data updates for Ants, Aquatic bugs, Bees, Carabids, Longhorn beetles, Dragonflies, Empid & Dolichopodid Flies, Ephemeroptera, Fungus gnats, Hoverflies, Ladybirds, Leaf and seed beetles, Orthoptera, Plant bugs, Rove beetles, Shield bugs, Soldier beetles, Soldier flies, Trichoptera, Wasps and Weevils (Table 1).
The rules-of-thumb approach was used to exclude species occupancy models that were likely to be highly uncertain (Pocock et al. 2019). These rules of thumb include dropping rarely recorded species (less than 1 record in every 100 visits) if there were fewer than 3.1 records across the 10% of the best recorded years. More frequently recorded species were also excluded if there were fewer than 6.7 records across the 10% of the best recorded years (Pocock et al. 2019). These exclusion criteria are based on classification trees, selected to balance the rates at which species are excluded when not meeting precision thresholds and included when meeting the precision thresholds. These model quality tests were unavailable for the moth dataset, here species with fewer than 50 records across the UK (Outhwaite et al. 2019, Powney et al. 2019) were excluded. Previously, the rules-of-thumb were not available for the bryophytes, instead the 50 record threshold was used. In this version of the indicator, we now use the rules-of-thumb criteria to exclude bryophyte species, meaning 75 extra bryophyte species that would have failed the 50 record threshold are now included.
Table 1: Summary of species’ time-series included in the Priority Species Bayesian measure
| Taxonomic group | Number of priority species on Four Country list | Number of species with sufficient data to include in MSI | New data received since previous version (2021) |
|---|---|---|---|
| Ants | 9 | 5 | yes |
| Aquatic Bugs | 6 | 5 | yes |
| Bees | 60 | 58 | yes |
| Bryophytes | 301 | 127 | no |
| Butterflies | 27 | 23 | yes |
| Carabids | 38 | 9 | yes |
| Craneflies | 29 | 14 | yes |
| Dragonflies | 4 | 3 | yes |
| Empid & Dolichopodid Flies | 8 | 3 | Yes |
| Ephemeroptera | 2 | 2 | Yes |
| Fungus Gnats | 8 | 1 | Yes |
| Hoverflies | 21 | 11 | yes |
| Leaf & Seed Beetles | 21 | 14 | yes |
| Non-marine Molluscs | 56 | 33 | no |
| Moths | 174 | 122 | no |
| Orthoptera | 6 | 5 | yes |
| Plecoptera | 2 | 2 | yes |
| Soldierflies | 16 | 13 | yes |
| Spiders | 40 | 16 | no |
| Trichoptera | 4 | 3 | yes |
| Wasps | 34 | 33 | yes |
| Weevils | 15 | 4 | yes |
| Totals | 881 | 506 | - |
Notes about Table 1
- MSI refers to the multi-species indicator.
Methodology
The composite indicator was produced using a novel hierarchical modelling method for calculating multi-species indicators developed by UKCEH (Freeman et al. 2020), which offers some potential advantages over the geometric mean method used to produce the 2020 indicator. It can be applied to multiple data types, improving the comparability between metrics derived from occupancy and abundance data and can account for the uncertainty associated with the underlying species-specific time series as well as uncertainty in the indicator arising from the subset of species that are included. Imputing missing values is informed by between-year changes in species for which data is available, assuming shared environmental responses. Additionally, a smoothing process is used to reduce the impact of between-year fluctuations, such as those caused by variation in weather, making underlying trends easier to detect. The smoothing parameter (number of knots) was set to the number of years divided by three following Fewster et al. (2000).
The Bayesian occupancy approach enables an estimation of species occurrence even though the data used in this indicator were collected without a standardised survey design (van Strien et al., 2013; Isaac et al., 2014a and b). For each species, records were extracted at the one kilometre grid square scale with records on different days being treated separately, and an annual time-series of the proportion of sites occupied was calculated. Each species-specific time-series was scaled so the first value in 1970 was set to 100. The annual index was estimated as the arithmetic mean of the scaled species-specific occupancy estimates. Each species was given equal weighting within the indicator. Uncertainty in the species-specific annual occupancy estimates is represented by the 95% credible intervals.
A hierarchical, state-space model based on species annual growth rates was used to estimate the multispecies indicator (Freeman et al. 2020). The hierarchical structure allows estimation of uncertainty from different sources including that associated with the underlying species-specific index values and from having an incomplete set of trends for priority species with which to estimate the indicator. A smoothing process reduces the impact of between-year fluctuations, such as those caused by variation in weather, making underlying trends easier to detect.
Assessment of change
Species were grouped into one of 5 categories based on both their short-term (over the most recent 5 years of data) and long-term (all years) mean annual change in occupancy (Table 2).
Asymmetric percentage change thresholds are used to define these classes as they refer to proportional change, where a doubling of a species index (an increase of 100%) is counterbalanced by a halving (a decrease of 50%).
The threshold values for each category were based on those of the wild bird indicator; whether an individual species is increasing or decreasing has been decided by its rate of annual change over the time period (long or short) of interest. If the rate of annual change would lead to an occupancy increase or decrease of between 25 per cent and 49 per cent over 25 years, the species is said to have shown a ‘weak increase’ or a ‘weak decline’ respectively. If the rate of annual change would lead to a population increase or decrease of 50 per cent or more over 25 years, the species is said to have shown a ‘strong increase’ or a ‘strong decline’ respectively. These thresholds are used in the Birds of Conservation Concern (PDF 1.6MB) status assessment for birds in the UK.
Table 2: Thresholds used to define individual species’ trends
| Category | Threshold | Long term change |
|---|---|---|
| Strong increase | An increase of more than 2.81% per annum | Equivalent to an increase of more than 100% over 25 years |
| Increase | An increase of between 1.16% and 2.81% per annum | Equivalent to an increase of between 33% and 100% over 25 years |
| No change | Change is between +1.16 % and -1.14% per annum | Equivalent to a change of between +33% and -25% over 25 years |
| Decrease | A decrease of between 1.14% and 2.73% per annum | Equivalent to a decrease of between 25% to 50% over 25 years |
| Strong decrease | A decrease of more than 2.73% per annum | Equivalent to a decrease of more than 50% over 25 years |
Species list
The species list was derived from the biodiversity lists of the 4 UK countries. A link to the list for each country is provided below:
- England – Section 41 Species
- Northern Ireland – Northern Ireland Priority Species List
- Scotland – Scottish Biodiversity List
- Wales - Section 7 Priority species
Table 3: The biodiversity lists of the 4 countries of the UK
| Country | Number of Taxa on country list | Criteria for inclusion of species on list |
|---|---|---|
| England (Section 41 Species) | 943 taxa | On the 2007 UK BAP list |
| Hen Harrier | ||
| Northern Ireland (NI) Priority Species List | 481 taxa | 1: On the 2007 UK BAP list |
| 2: Rapid decline of greater than or equal to 2% per year | ||
| 3: Decline of greater than or equal to 1 % per year and NI holds greater than or equal to 50% of Irish, or greater than or equal to 20 % of UK population or Irish/UK population restricted to NI | ||
| 4: Rare in NI (1 to 2 sites) and NI holds greater than or equal to 50% of Irish, or greater than or equal to 20% of UK population or Irish/UK population restricted to NI | ||
| 5: Greater than or equal to 20% of a well recognised sub-species in NI | ||
| 6: Irish Red data book species | ||
| 7: Red list Birds of Conservation concern Ireland or UK | ||
| Scottish Biodiversity List | 2,090 taxa | S1: On the 2007 UK BAP list |
| S2: International obligation | ||
| S3: Species defined as ‘nationally rare’ in GB/UK (less than 15 10 square kilometres), which are present in Scotland | ||
| S4: Species present in less than or equal to 5 kilometres square or sites in Scotland | ||
| S5: Decline of greater than or equal to 25% in 25 years in Scotland | ||
| S6a: Endemic | ||
| S6b: Endemic subspecies if also meets another criterion | ||
| Wales (Section 7 Priority species) | 567 taxa | International importance, IUCN Global Red List or Red listed in greater than or equal to 50% of EU countries where data is available or other source indicating international threat or decline |
| International responsibility greater than or equal to 25% of EU/Global population in Wales and decline greater than or equal to 25% in 25 years in Wales | ||
| Decline in Wales greater than or equal to 50% in 25 years | ||
| Other for example decline and very restricted range | ||
| UK total (combined 4 country list) | 2,890 |
Table 4: Taxonomic breakdown of combined 4 country biodiversity list
| Taxonomic group | Number of species in group |
|---|---|
| Invertebrates | |
| insect - beetle (Coleoptera) | 191 |
| insect - butterfly | 25 |
| insect - dragonfly (Odonata) | 4 |
| insect - hymenopteran | 103 |
| insect - moth | 174 |
| insect - orthopteran | 6 |
| insect - other | 4 |
| insect - riverfly | 8 |
| insect - true bug (Hemiptera) | 15 |
| insect - true fly (Diptera) | 94 |
| other Invertebrate | 233 |
| Vertebrates | |
| amphibian | 4 |
| bird | 127 |
| fish | 57 |
| marine mammal | 22 |
| terrestrial mammal | 26 |
| reptile | 10 |
| Plants and fungi | |
| vascular plants | 409 |
| alga | 254 |
| stonewort | 15 |
| lichen | 546 |
| bryophytes | 301 |
| fungi | 262 |
| Total number of species | 2,890 |
The species lists are unchanged from those used in the previous version of this indicator. The criteria for inclusion in each of the 4 biodiversity lists are derived from those used to identify the UK Biodiversity Action Plan (UK BAP) priority species list, most recently in 2007, but there has been some divergence in approaches, see Table 3. For example, the Scottish biodiversity list and the Northern Ireland priority species list both have criteria based on rarity alone, whereas the UK BAP criteria did not consider rarity; rare species were only listed if they were considered threatened or declining.
For the purposes of this indicator, an inclusive approach has been taken, whereby a species only has to be included in one of the country lists to be included on the combined list. The Scottish Biodiversity list has a final criterion based on the importance of species to people, however, species listed as a result of this criterion were not considered here. The taxonomic composition of the combined Four Country List (FCL) is shown in Table 4.
Some countries have included a small number of taxa below the species level (that is, sub-species) on their biodiversity lists. Such infra-specific taxa were only retained on the combined 4 country biodiversity list if the associated species was not included. For example, a sub-species of the grass rivulet moth (Perizoma albulata) is included on the Scottish biodiversity list, but it is a full species on the Northern Ireland priority species list, thus on the combined list only the full species was retained.
For a full species list, please see the published datafile.
Development work
The method of fitting the species distribution models is currently implemented in sparta, a Bayesian R package (Lindskou et al., 2024). As the number and size of datasets used in these models grow, it has become increasingly unviable to run, even on High Performance Computing platforms. This particularly affects butterfly and moth datasets (15,900,392 and 28,081,910 records, respectively), but may soon become a problem for other groups such as dragonflies, bees and hoverflies. The UK Centre for Ecology and Hydrology (UKCEH) have explored a range of different options to address this problem, including splitting the model runs up into several chunks and trialling different software, such as NIMBLE (de Valpine et al., 2017). Ultimately, these methods were either slower than the original software or were too unstable for these purposes.
To address the critical challenge of generating indicators for the largest taxon groups, UKCEH investigated using the R package, occti, developed by Dennis et al., (2017). The occti method fits occupancy models using Generalised Linear Models (GLMs) separately by season, and offers a frequentist alternative to the Bayesian framework used in sparta (Dennis et al., 2017). It had been shown in previous research to produce occupancy estimates comparable to those from sparta, while offering faster computation times (Dennis et al., 2017). Completion times of occti model fitting for the larger datasets averaged around three hours - substantially faster than the sparta method.
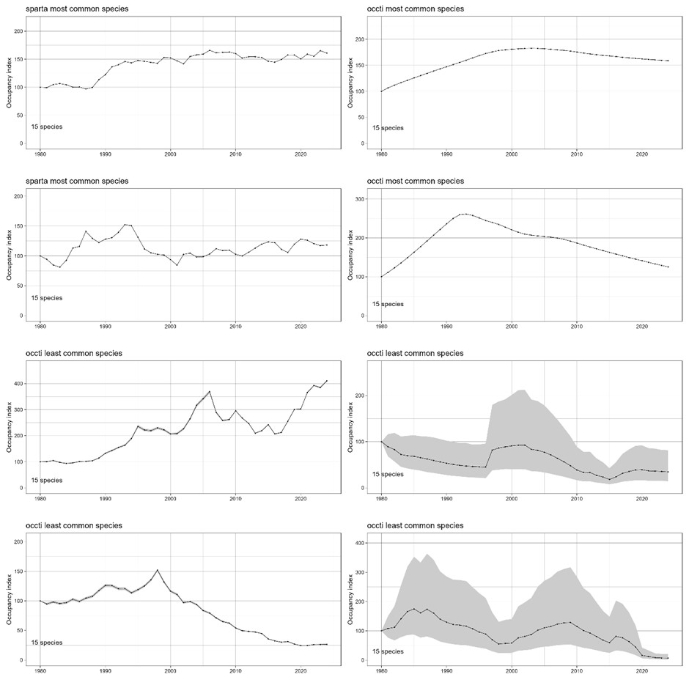
Comparisons between the outputs from occti and sparta show that occupancy trends were broadly similar across the most common (frequently recorded) species. For rarer, less well-recorded reported species, trends diverged more markedly. A common theme (but not exclusively true for all species) was of much larger uncertainty in the occti model outputs compared to that of sparta. Across taxonomic groups, there were also differences. For dragonflies, sparta estimated a steeper increase in the occupancy index, while for hoverflies, sparta suggested a steeper decline than occti. Notably, occti indices had substantially wider 95% credible intervals. This is likely more realistic given the underlying uncertainty in these occupancy model outputs, and the intrinsic variability of the natural dynamics of these groups and in the raw data.
UKCEH also compared the overall composite indicators derived from the Freeman et al., (2021) method, applied to the 15 most and 15 least reported species (that had at least 50 records across all years). The results showed that the indicators for the most well-recorded dragonfly species were broadly similar between occti and sparta. However, all other indicators showed a high level of difference between occti and sparta, and that this was particularly noticeable for the least well-recorded species subsets. For the least reported species there were noticeably larger confidence intervals in the trends derived from the occti method.
Figure 4: A comparison of index scores derived from sparta (left) and occti (right). The first two rows show indices for the 15 most reported species in dragonflies (first row) and hoverflies (second row), while the third and fourth rows show indices for the 15 least reported species in dragonflies and hoverflies. All panels include 95% credible intervals.
Caveats
The Risk-Of-Bias In Temporal Trends (ROBITT) assessment framework (Boyd et al. 2022), was designed to identify and communicate potential sources of bias given the spatial, environmental, and taxonomic scope of an analysis. These risk-of-bias assessments use a range of metrics and figures to highlight patterns in the sample data, helping to judge whether the model outputs are sensible and reliable given the model assumptions and the underlying data.
Here, light-touch risk-of-bias assessments for all the updated insect datasets and the associated occupancy models in this indicator reveal a number of risks of bias. Notably, there are strong spatiotemporal and taxonomic patterns in sampled occurrence of species across the insect groups. These patterns vary across taxonomic groups, with some groups showing overall increases in recorder effort with the broad spatial pattern of recording remaining consistent, while others show large shifts in the spatial pattern of recording over time. For many groups, the data are strongly clustered in space, often with increased recording effort in southern England. There is widespread variation in the temporal pattern, many groups show a temporal increase in the number of 1 x 1 km records. However, this pattern is not always consistent, some groups have bursts of recording activity with distinct core periods of recording, this is potentially a result of targeted effort prior to the publication of a taxonomic group atlas.
Many groups have a substantial increase in available records in the most recent years. While the occupancy modelling approach used here is designed to control for variation in detectability, it is unclear how the model outputs are impacted by these large shifts in recording effort. For example, any change in the pattern in recording effort that correlates with a potential driver of species occupancy change (i.e. habitat destruction), is likely to cause bias in the underlying species trend outputs. It is likely that apparent changes in species trends may in part reflect variation in recorder activity rather than underlying species change.
As discussed above, occupancy models are useful for detecting species change, where they are designed to handle variation in detectability, such as that associated with an increase in recorder effort. While useful, these models are data hungry, requiring repeat visits to grid cells in the same year to estimate detectability. While no clear threshold for the number of repeat visits is available, a minimum of >4 repeat visits on average has been previously suggested. Here, the average number of repeat visits to a site across all groups was approximately 2.4 with the mean number of repeat visits to sites generally increased with time. As with other aspects of the data, the mean number of repeat visits varied across taxonomic groups ranging from 1.4 for the aquatic bugs and longhorn beetles to a high of 11.9 for the moths. The lack of repeat visits is therefore likely inhibiting the ability of the occupancy model to account for detection bias in the analyses, in turn influencing the ability to detect genuine change.
The performance of the Freeman et al. (2021) method is currently being explored in relation to the species abundance indicator. Many of the development plans for the abundance indicator are also relevant to the use of the Freeman et al. (2021) method in this indicator. The results and recommendations of that work will be considered in future versions of this indicator.
Development plan
We are keen to hear feedback from users of these statistics, please send your feedback to: biodiversity@defra.gov.uk.
Development plans over the next few years:
- We will update the remaining groups that were unable to be updated in this publication, such as moths.
- We will incorporate any developments that arise from the development plan of the species abundance indicators.
- We will further explore differences between the outputs of the occti and sparta models to decide on an approach that suits all taxonomic groups and has a viable computation time.
References
-
Boyd, R. J., Powney, G. D., Burns, F., Danet, A., Duchenne, F., Grainger, M. J., Jarvis, S. G., Martin, G., Nilsen, E. B., Porcher, E., Stewart, G. B., Wilson, O. J. & Pescott, O. L. (2022). ROBITT: A tool for assessing the risk-of-bias in studies of temporal trends in ecology. Methods in Ecology and Evolution, 13, 1497–1507. https://doi.org/10.1111/2041-210X.13857
-
Dennis, E. B., Morgan, B. J. T., Freeman, S. N., Ridout, M. S., Brereton, T. M., Fox, R., Powney, G. D. & Roy, D. B. (2017) Efficient occupancy model-fitting for extensive citizen-science data. PLOS ONE,12, 1-17.
-
de Valpine, P., Turek, D., Paciorek, C. J., Anderson-Bergman, C., Lang, D. T., & Bodik, R. (2017). Programming With Models: Writing Statistical Algorithms for General Model Structures With NIMBLE. Journal of Computational and Graphical Statistics, 26(2), 403–413. https://doi.org/10.1080/10618600.2016.1172487
-
Eaton, M. A., Burns, F., Isaac, N. J. B., Gregory, R. D., August, T. A., Barlow, K. E., … Williams, J. (2015). The priority species indicator: measuring the trends in threatened species in the UK. Biodiversity, 16(2 to 3), 108 to 119. https://doi.org/10.1080/14888386.2015.1068222
-
Fewster, R. M., Buckland, S. T., Siriwardena, G. M., Baillie, S. R., and Wilson, J. D. (2000). Analysis of population trends for farmland birds using generalized additive models. Ecology, 81(7), 1970 to 1984. https://doi.org/10.1890/0012-9658(2000)081[1970:AOPTFF]2.0.CO;2
-
Freeman, S.N., Isaac, N.J.B., Besbeas, P. et al. A Generic Method for Estimating and Smoothing Multispecies Biodiversity Indicators Using Intermittent Data. JABES 26, 71 to 89 (2021). https://doi.org/10.1007/s13253-020-00410-6
-
Hill, M.O. (2012), Local frequency as a key to interpreting species occurrence data when recording effort is not known. Methods in Ecology and Evolution, 3: 195-205. https://doi.org/10.1111/j.2041-210X.2011.00146.x
-
Isaac, N. J. B., August, T. A., Harrower, C. and Roy, D. B. (2013). Trends in the Distribution of UK native species 1970 to 2010. Preliminary report to JNCC. JNCC Report No 488.
-
Isaac, N. J. B., van Strien, A. J., August, T. A., de Zeeuw, M. P. and Roy, D. B. (2014a). Statistics for citizen science: extracting signals of change from noisy ecological data. Methods in Ecology and Evolution, 5(10), 1052 to 1060. https://doi.org/10.1111/2041-210X.12254
-
Isaac, N. J. B., van Strien, A. J., August, T. A., de Zeeuw, M. P. and Roy, D. B. (2014b). Extracting robust trends in species’ distributions from unstructured opportunistic data: a comparison of methods. BioRXiv. https://doi.org/10.1101/006999
-
Lindskou, M., Tvedebrink, T., Eriksen, S., Højsgaard, S., & Morling, N. (2024). jti and sparta: Time and Space Efficient Packages For Model Based Prediction in Large Bayesian Networks. Journal of Statistical Software, 1-24. https://doi.org/10.18637/jss.v111.i02
-
Outhwaite, C.L., Chandler, R.E., Powney, G.D., Collen, B., Gregory, R.D. and Isaac N. J. B. (2018) Prior specification in Bayesian occupancy modelling improves analysis of species occurrence data. Ecological Indicators, 93, pp.333 to 343
-
Outhwaite, C.L., Powney, G.D., August, T.A., Chandler, R.E., Rorke, S., Pescott, O.L., … Isaac, N.J.B. (2019) Annual estimates of occupancy for bryophytes, lichens and invertebrates in the UK, 1970 to 2015. Scientific Data 6, p.259.
-
Pocock, M. J. O., Logie, M. W., Isaac, N. J. B., Outhwaite, C. L., and August, T. (2019). Rapid assessment of the suitability of multi-species citizen science datasets for occupancy trend analysis. BioRxiv. doi: 10.1101/813626
-
Powney, G.D., Carvell, C., Edwards, M., Morris, R.K.A., Roy, H.E., Woodcock, B.A. and Isaac, N.J.B. (2019) Widespread losses of pollinating insects in Britain. Nature Communications, 10, 1018
-
Szabo, J.K., Vesk, P.A., Baxter, P.W.J. and Possingham, H.P. (2010), Regional avian species declines estimated from volunteer-collected long-term data using List Length Analysis. Ecological Applications, 20: 2157-2169. https://doi.org/10.1890/09-0877.1
-
Van Strien, A. J., van Swaay, C. A. M. and Termaat, T. (2013). Opportunistic citizen science data of animal species produce reliable estimates of distribution trends if analysed with occupancy models. Journal of Applied Ecology, 50(6), 1450 to 1458. https://doi.org/10.1111/1365-2664.12158
Categories:
Published: