Pressure from invasive species
Last updated: 2025
Latest data available: 2024
Introduction
Non-native or alien species are those that have reached Great Britain by accidental human transport (e.g. trade and transportation networks), deliberate human introduction, or which arrived by natural dispersal from a non-native population in Europe. Most non-native species are considered benign or positive, but some have a negative impact on humans (through social and economic impacts), and native species (through the spread of disease, competition for resources, or by direct consumption, parasitism or hybridisation); such species are termed invasive. Invasive non-native species have one or more of these negative impacts and a high capacity to spread to natural and semi-natural habitats. This indicator tracks pressure from the number of invasive species in terrestrial, freshwater and marine (coastal) environments, and the overall rate of invasive alien species establishment in Great Britain (GB). The indicator utilises data from the GB Non-native Species Information Portal (GB-NNSIP).
The different measures that form this indicator cover two main approaches to reporting the data on invasive species. Firstly, there are measures that track the net total number of invasive non-native species established across 10% or more of the land area of Great Britain, or along 10% or more of the extent of its coastline. Species that have arrived since 1500 are included within this indicator.
Secondly, in this iteration of the indicator there is a new measure which tracks the rate of alien invasive species establishments since 1920, using the same underlying database but a different time series (see Further Detail). This second aspect of the indicator is being published as part of the UK’s response to the Convention on Biological Diversity’s Kunming-Montreal Global Biodiversity Framework (GBF). This is the headline indicator for Target 6.
Data for both measures within this indicator can be found in the published datafile.
Type of indicator
Pressure indicator
Type of official statistics
Official statistic
Contents
- Assessment of change
-
Key results
- Number of establishments
- Figure 1: Number of invasive non-native species established in or along 10% or more of Great Britain’s land area or coastline, 1969 to 2024
- Figure 2: Changes in the extent (as listed in Table 1) of invasive non-native species in freshwater (A), marine (coastal) (B), and terrestrial (C) environments of Great Britain, 1969 to 2024
- Rate of establishments
- Figure 3: Modelled rate of invasive alien species establishment, 1920 to 2022, with projection (hashed line) from 2000 onwards
- Further detail
- Acknowledgements
- Technical annex
- References
Assessment of change
Assessment of change of the cumulative net total number of invasive non-native species established in or along 10% or more of Great Britain’s land area or coastline.
| Measure | Assessment | Time period | Result |
|---|---|---|---|
| Freshwater | Long term | 1969 to 2024 | Deteriorating |
| Marine (coastal) | Long term | 1969 to 2024 | Deteriorating |
| Terrestrial | Long term | 1969 to 2024 | Deteriorating |
Assessment of change in the rate of alien species establishment.
| Measure | Assessment | Time period | Result |
|---|---|---|---|
| Rate of establishment | Long term | 1920 to 2022 | Little or no overall change |
| Rate of establishment | Short term | 2017 to 2022 | Little or no overall change |
Notes on the indicator assessment
Analysis of the underlying long-term trends for pressure from invasive species is carried out by the data providers; see Assessing Indicators. The first measure on the number of establishments on land area and coastline show a count of invasive species for each decade, unlike the majority of other indicators that report annually. Therefore, it is only possible to assess long-term trends as there are insufficient data to establish trends over shorter time periods.
Both long-term and short-term assessments of change are shown for the measure on the rate of invasive alien species establishment, as this is based on annual data. The long-term assessment was made by comparing the 95% confidence interval (CI) of the final year with the starting value of rates of invasive species establishment. As the starting value (1.59) of the time series is within the confidence intervals for the final indicator value at the end of the time series (95% CI: 0.95, 7.34), the time series was assessed as showing little or no overall change over the long term.
The same approach was applied to the most recent five-year (2017 to 2022) period to assess the short-term change. As the starting value for the time period (2.58) is within the confidence intervals for the most recent year (2022, 95% CI: 0.95, 7.34), the indicator is assessed as showing little or no overall change in the short term.
Key results
Number of establishments
There are 3,343 non-native species reported in the Great Britain Non-native Species Information Portal (GB-NNSIP), 2,074 of which are classified as established (reproducing in the wild). However, only a relatively small number of these are considered to be invasive, due to their negative impacts on native biodiversity.
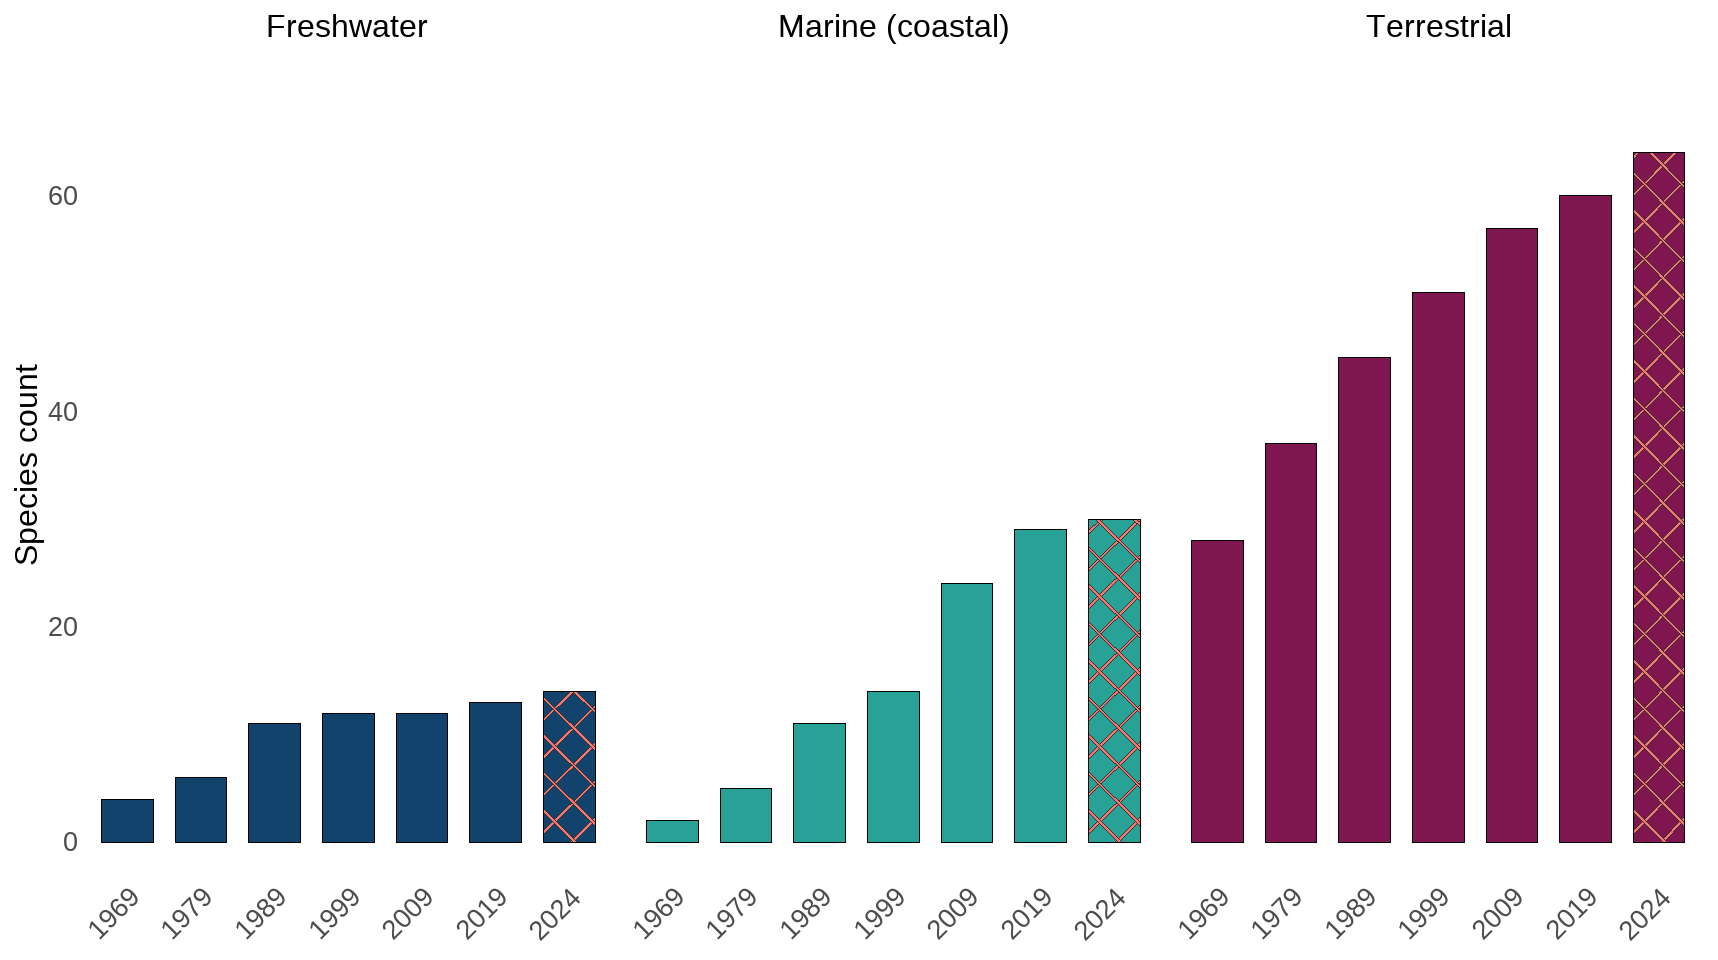
Since 1969, invasive non-native species have become more prevalent in freshwater, marine (coastal) and terrestrial environments, thereby increasing pressure on native biodiversity (Figure 1). As of 2024, there are 14 freshwater, 30 marine, and 64 terrestrial invasive species established in or along 10% of Great Britain’s land area or coastline.
Figure 1: Number of invasive non-native species established in or along 10% or more of Great Britain’s land area or coastline, 1969 to 2024
Source: Botanical Society of Britain & Ireland; British Trust for Ornithology; UK Centre for Ecology & Hydrology; Marine Biological Association; National Biodiversity Network
Notes about Figure 1
- Each data point reported for this measure represents the count of invasive non-native species for the preceding 10 years rather than annual data, i.e., the data point for 1969 relates to the count of invasive species present in the period 1960 to 1969.
- The 2024 data point covers a shorter time period (2020 – 2024) than the previous data points. This partial decade is indicated on the figure with a hashed pattern.
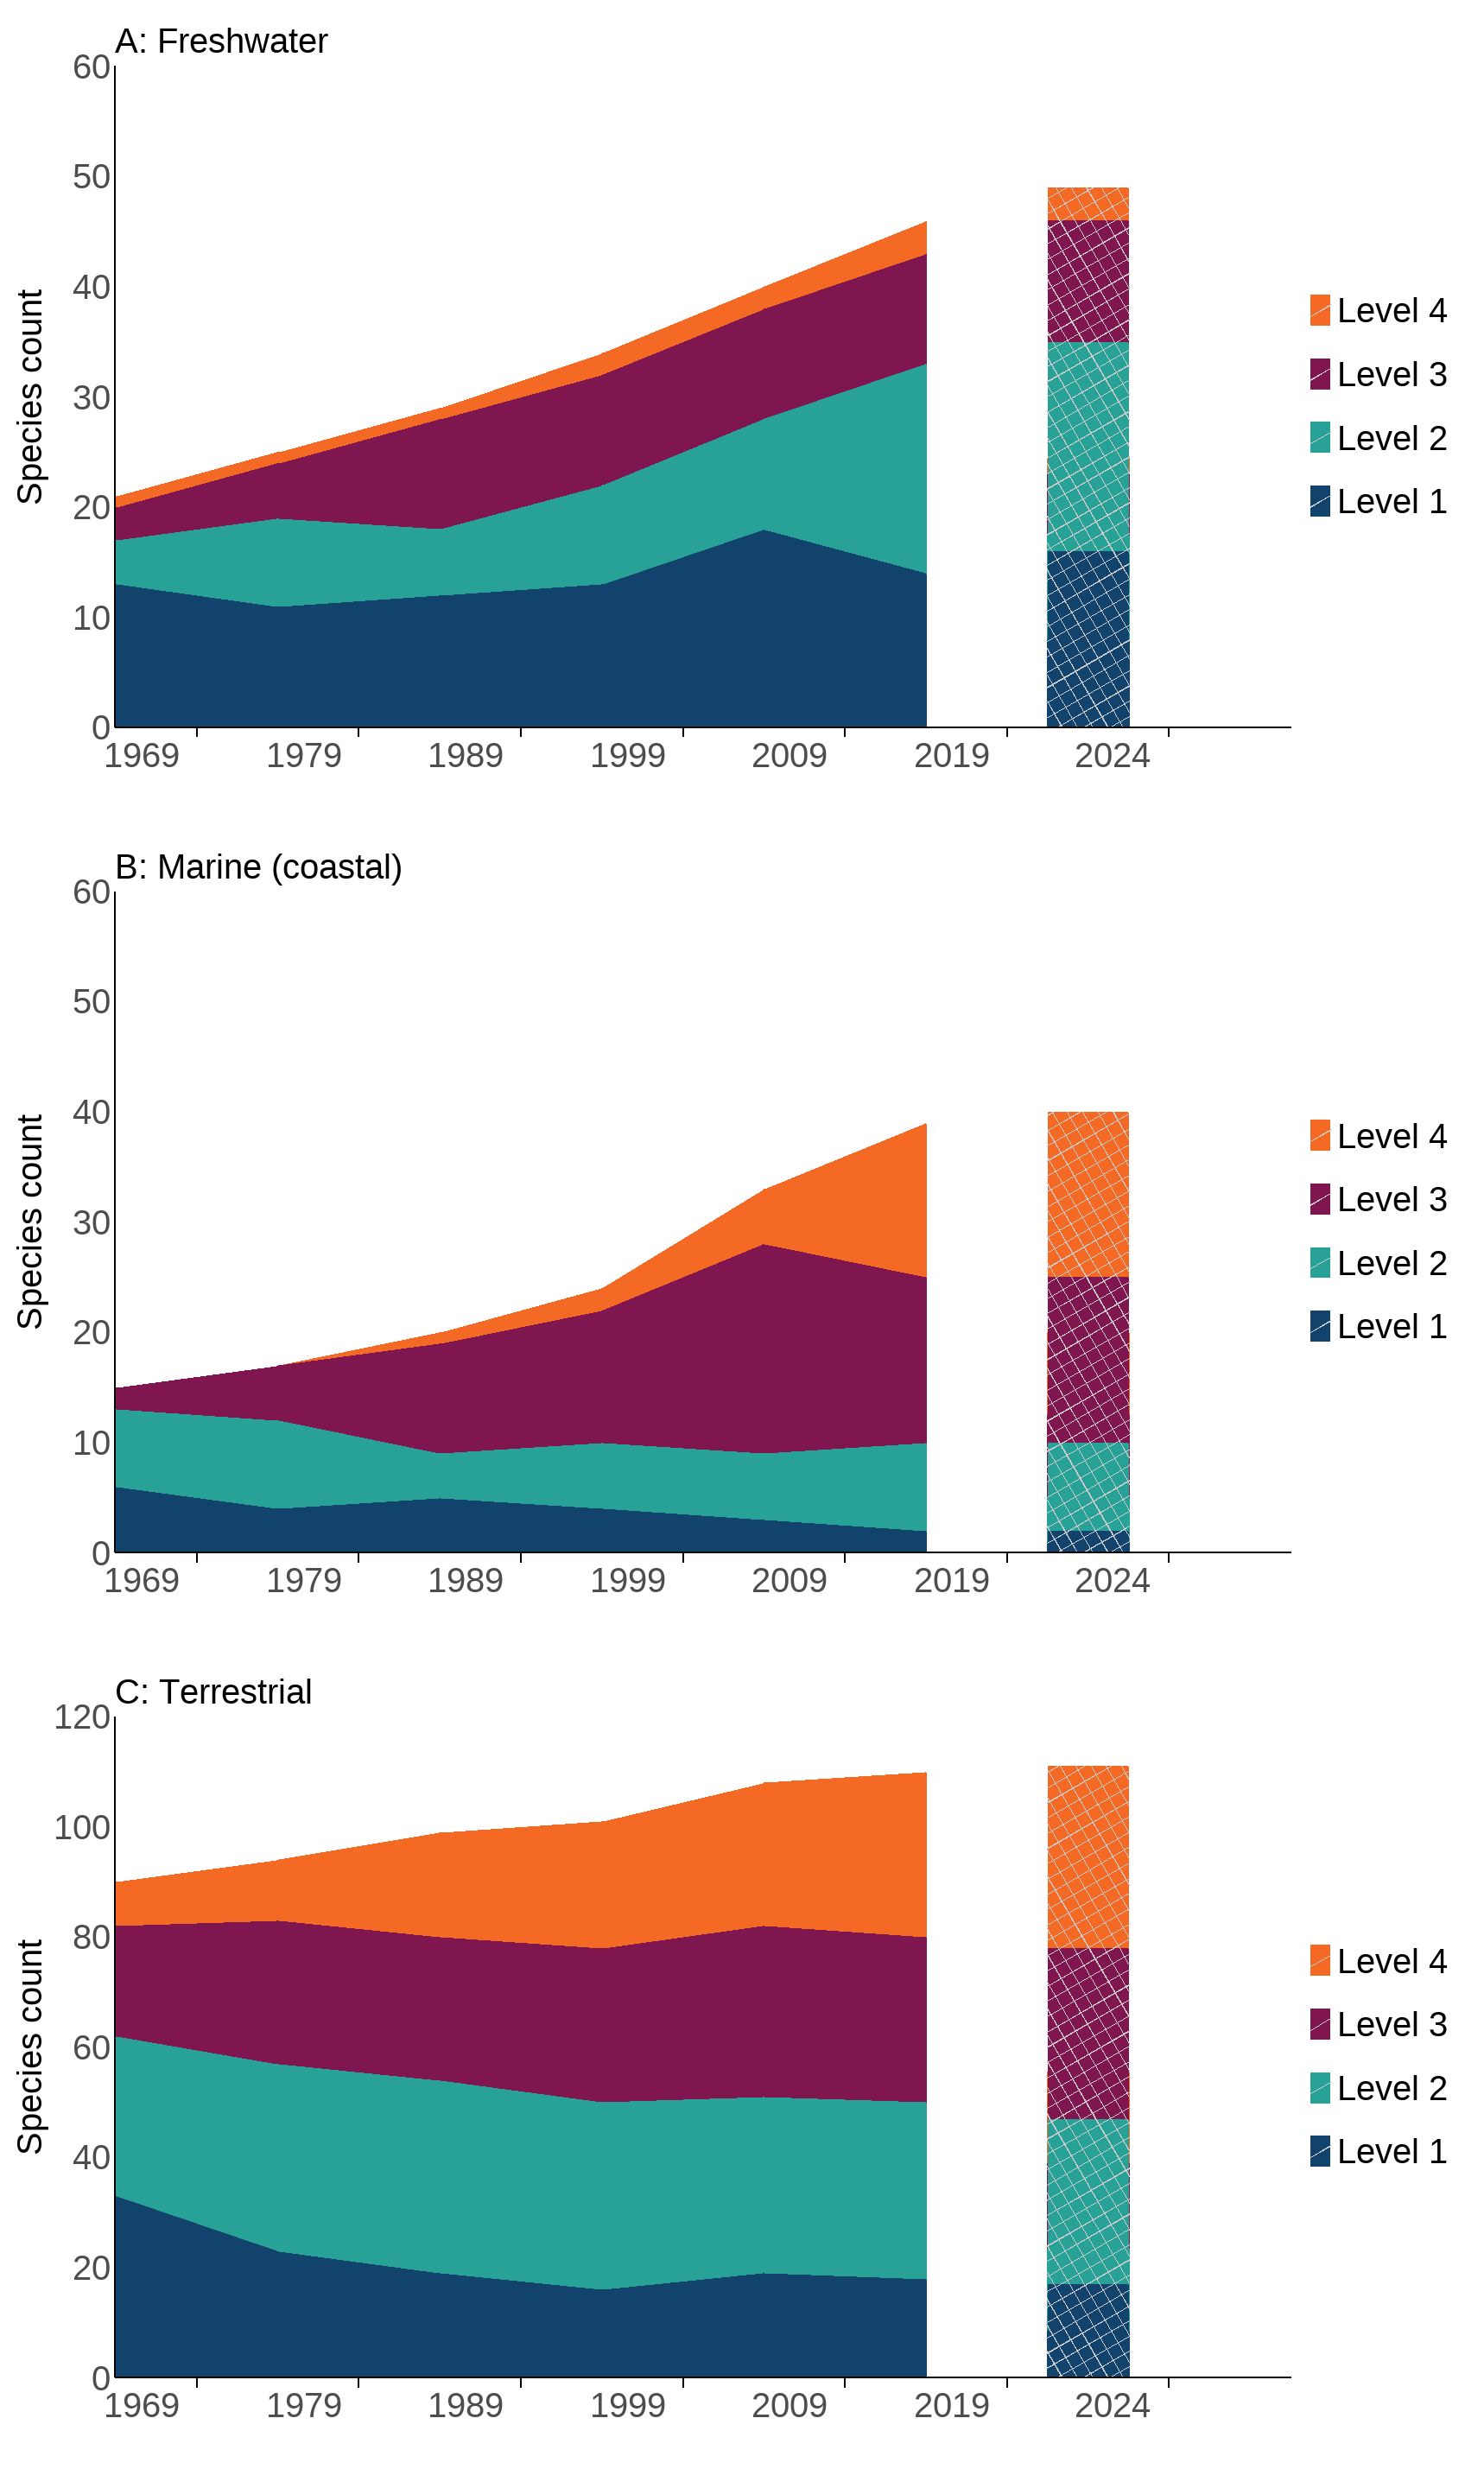
Invasive non-native species were categorised according to the extent of the land area or coastline of Great Britain in which they were found each decade (see Table 1). The categorisation was achieved by combining assessment of modelled distributions based on occurrence data with expert validation (see technical annex for further information). Changes in extent levels within each habitat type are shown in Figure 2.
Figure 2: Changes in the extent (as listed in Table 1) of invasive non-native species in freshwater (A), marine (coastal) (B), and terrestrial (C) environments of Great Britain, 1969 to 2024
Source: Botanical Society of Britain & Ireland; British Trust for Ornithology; UK Centre for Ecology & Hydrology; Marine Biological Association; National Biodiversity Network
Notes about Figures 2a-c
- Each data point reported for this indicator represents the count of invasive non-native species for the preceding 10 years, i.e., the data point for 1969 relates to the count of invasive species present in the period 1960 to 1969.
- The 2024 data point covers a shorter time period (2020 – 2024) than the previous data points. This partial decade is indicated on the figure with a hashed pattern.
- Extent levels (see Table 1) are defined as follows: Level 1 - not or scarcely established, Level 2 - established but still generally absent or at most occasional, Level 3 - established and frequent in part of the territory, Level 4 – widespread.
Rate of establishments
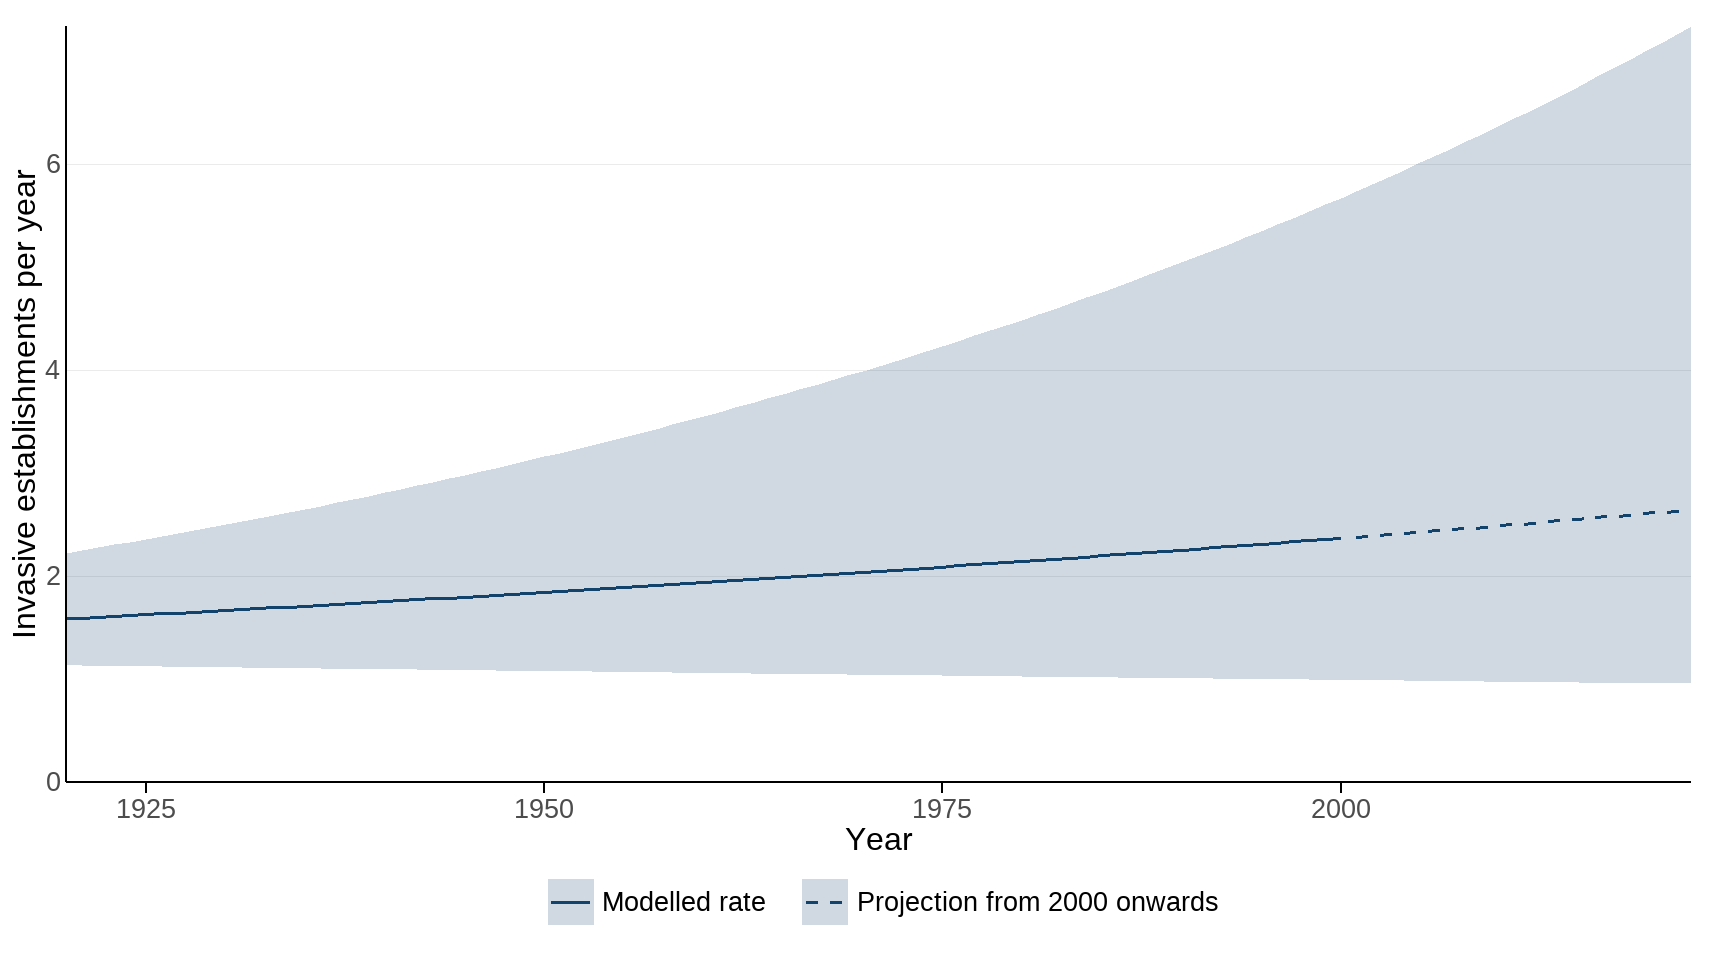
Modelled following the Solow and Costello (2004) method, the measure of rate of invasive alien species establishment shows an increasing trend in both the long term and short term (Figure 3); estimates increased from 1.59 in 1920 to 2.64 in 2022, with a total of 211 species establishing in that time. To account for lags (delays) in the detection and recording of new invasive alien species in the more recent years in the time series, the trend after 2000 is projected based on the data on establishments between 1920 and 2000.
Figure 3: Modelled rate of invasive alien species establishment, 1920 to 2022, with projection (hashed line) from 2000 onwards
Source: Botanical Society of Britain & Ireland; British Trust for Ornithology; UK Centre for Ecology & Hydrology; Marine Biological Association; National Biodiversity Network
Notes about Figure 3
- This model is designed to account for the effect of lags in detection and recording in the latter years of the time series.
- This model includes data for the years 1920-2000 only; later years are extrapolated from this trend and displayed as a hashed line.
- A comparison of multiple models has demonstrated that this approach gives the most accurate assessment of the trend.
- The shaded area shows the extent of the 95% confidence intervals of the model.
Further detail
Number of establishments
This measure is based on species distribution data available through the National Biodiversity Network (NBN), supplemented by expert knowledge and in house datasets of the Botanical Society of Britain and Ireland (BSBI), British Trust for Ornithology (BTO), UK Centre for Ecology & Hydrology (UKCEH), the Environment Agency (EA) and Marine Biological Association (MBA). The list in 2014 comprised of 179 species, but has been subsequently amended each year to comprise of 200 species (see technical annex for further information).
Table 1: Invasion extent of non-native species
| Definition | Interpretation | Extent |
|---|---|---|
| Not present in territory | Absent | 0 |
| Present in territory and either not established; or with established populations that have not spread more than 10 km from their source | Not or scarcely established | 1 |
| Established populations represent less than 10% of territory, with some having arrived from further than 10 km from their source; or if more widespread then populations scattered and sparse | Established but still generally absent or at most occasional | 2 |
| Established populations present in 10% to 50% of the territory | Established and frequent in part of the territory | 3 |
| Established in more than 50% of the territory | Widespread | 4 |
Rate of establishments
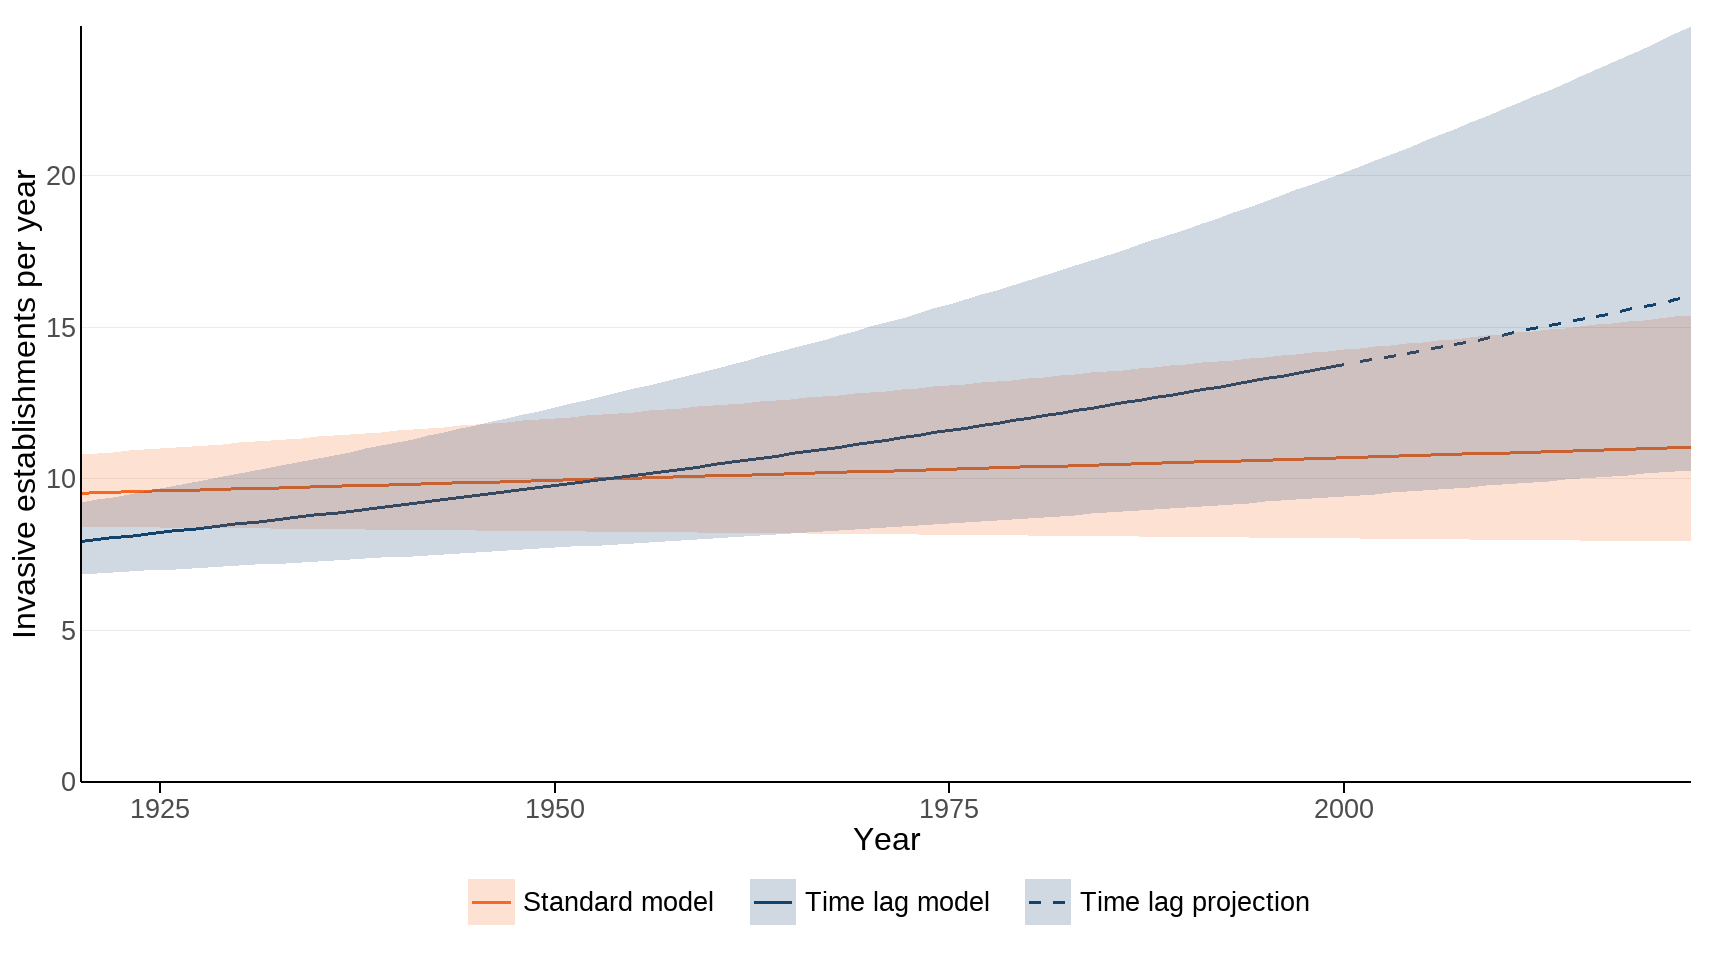
The model shown in Figure 3 is based on real data on establishments of invasive alien species between 1920 and 2000, with a projected trend from 2000 onwards. This approach allows for a significant time lag between the establishment and observation of an invasive species (time lag model). For comparison, the same modelling approach has been applied to the same dataset including all observed data to 2022, to show how this compares to the projection from 2000 onwards. Figure 4 shows that these two models are very similar, with a potential small lag effect.
The same models were run on all alien species establishments (not just invasive alien species) in Great Britain (Figure 5) for comparison with the patterns shown for invasive alien species (Figure 4). The models for all alien species establishments suggest that there is a larger lag effect when considering this suite of species. When data since 2000 are included the trend line increases much less steeply (Figure 5), suggesting the Solow & Costello models may be sensitive to gaps in establishment data since 2000 and may not fully account for these time lags. Excluding data since 2000 is an attempt to avoid bias from incomplete data in this period.
Figure 4: Rate of invasive alien species establishment, 1920 to 2022
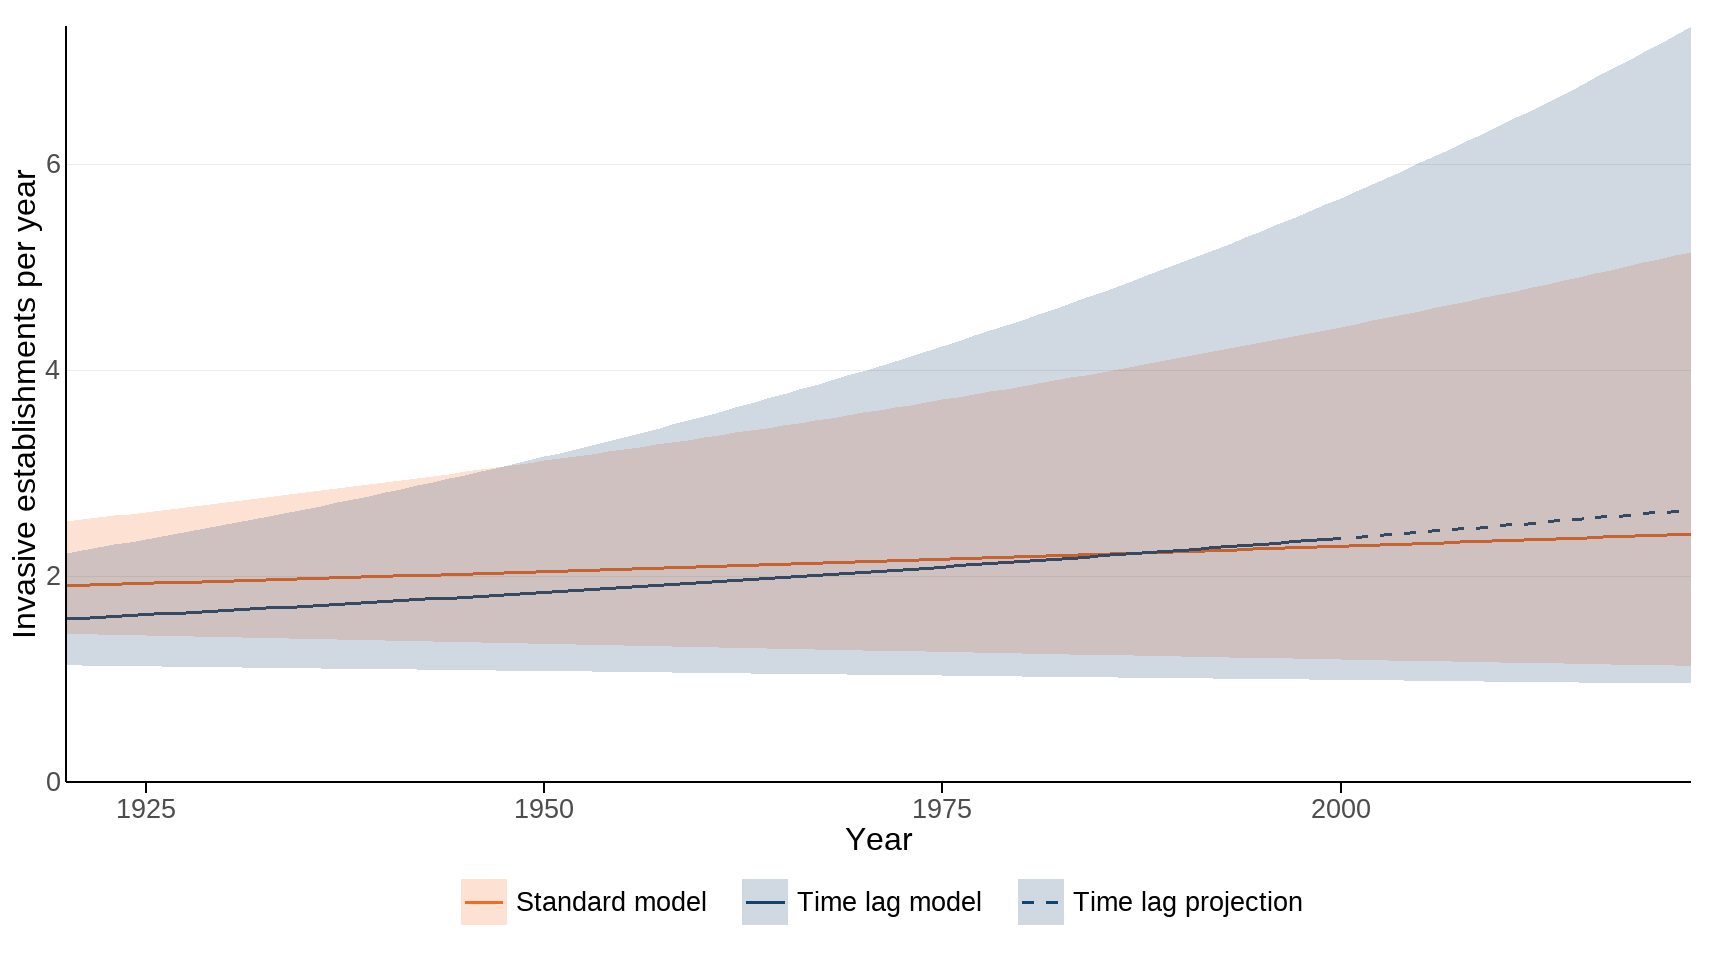
Figure 5: Rate of alien species establishment, 1920 to 2022
Source: Botanical Society of Britain & Ireland; British Trust for Ornithology; UK Centre for Ecology & Hydrology; Marine Biological Association; National Biodiversity Network
Notes about Figures 4 and 5
- Modelling approaches are from Solow and Costello (2004).
- To increase accuracy, neither of the above models assume constant rates of detection or establishment; both are allowed to vary with time. The Solow & Costello method assumes that the probability of detecting an alien species increases (exponentially) with years since has it been introduced. This approach does not use any actual data on survey effort.
- The lag model is designed to account for the effect of potential time lags in detection and recording in the latter years of the time series.
- The lag model includes data for the years 1920-2000 only; later years are extrapolated from this trend.
Relevance
The United Nations Convention on Biological Diversity (CBD) identifies invasive non-native species as a major threat to biodiversity because they can spread disease, hybridise with native species, modify ecosystems and drastically reduce populations of native species.
International/domestic reporting
The suite of UK Biodiversity Indicators has been revised and updated to bring it in line with the Kunming-Montreal Global Biodiversity Framework (GBF) of the Convention on Biological Diversity (CBD). Some UKBIs will be used for the forthcoming UK national reports to CBD. This indicator links to Target 6 in the Global Biodiversity Framework, which aims to reduce the introduction of invasive alien species by 50% and minimise their impact.
This indicator also feeds into the Environmental Indicator Framework (previously known as the Outcome Indicator Framework), a set of indicators describing environmental change related to the ten goals within the Environmental Improvement Plan. As part of the Environmental Indicator Framework, this data contributes towards the evidence base used to prepare the annual progress report for the Environmental Improvement Plan. This indicator contributes to indicator H1: Abatement of the number of invasive non-native species entering and establishing against a baseline.
Web links for further information
- Metadata factsheet for GBF Headline Indicator 6.1
- Developing an indicator of the abundance, extent and impact of invasive non-native species
- DAISIE - Inventory of alien invasive species in Europe
- The Invasive Alien Species (Enforcement and Permitting) Order 2019
- NBN Atlas
- GB Non-native Species Secretariat
- The Great Britain invasive non-native species strategy
Acknowledgements
Thank you to the many people who have contributed by providing data and to the many colleagues who have helped produce this indicator, with thanks in particular to colleagues at the UK Centre for Ecology & Hydrology, as well as:
- GB Non-native Species Information Portal
- NBN Atlas
- iRecord
- Botanical Society of Britain & Ireland (BSBI)
- Marine Biological Association
- British Trust for Ornithology
- Biological Records Centre
- UK Species Inventory
This indicator relies upon the opinions and assessments of taxonomic experts without whom it wouldn’t be possible to produce the indicator. The following lists the experts, and their affiliations, that were involved in production of this indicator in 2014 and/or that have been involved in the subsequent reviews of the indicator, which were conducted in 2015 and annually between 2017 and 2025:
- Kevin Walker and Tom Humphrey (Botanical Society of Britain & Ireland)
- Jack Sewell, Christine Wood, and John Bishop (Marine Biological Association)
- David Noble and John Marchant (British Trust for Ornithology)
- Alice Hiley and Trevor Renals (Environment Agency)
- John Murphy and Iwan Jones (Queen Mary University of London)
- Oliver Pescott and Ian Winfield (UK Centre for Ecology & Hydrology)
- Rob Britton (Bournemouth University)
- David Smith (Buglife)
We are also grateful to the national recording schemes and societies for regular updates on non-native species.
Technical annex
Number of establishments
Methodology
There are 200 invasive non-native species in Great Britain that are included within the indicator for the 2025 publication. These species have been assessed as extent levels 1-4 (five species were scored as extent level 0 for the 2020-2024 time period). The current indicator is the result of incremental updates to an indicator originally produced in 2014, which was developed using a two-stage process. This process began with extent estimation using a statistical method fitted to occurrence data available through the National Biodiversity Network (NBN Gateway), which were then validated and modified, where necessary, by taxonomic experts. The occurrence data used in the 2014 statistical analyses were obtained from the NBN Gateway at a minimum resolution of 10km and downloaded in October 2014. These data were divided into 10-year time slices to enable independent calculation extent for each decade. The method used to calculate area of extent was based on the approach developed the England Vascular Plant Red List (Stroh et al., 2014).
An initial list was derived from the GB-NNSIP (Roy et al., 2014) by selecting all non-native species within the database that are noted to have, or potentially have, a negative or strongly negative ecological effect. This list was subsequently reviewed by experts (see published datafile for full list).
The rationale for using a statistical method to produce extent estimates was to address the patchy nature of the occurrence data. Expert validation in 2014 found that the algorithmically produced extent estimates typically underestimated the true extent, largely because much of the occurrence data, particularly for earlier decades, was not readily available. As a result, most of the estimates required revision by taxonomic experts.
Since 2015, the species list and the classification of extent derived for the 2014 indicator have been reviewed and updated by taxonomic experts. Given the paucity of available occurrence data these subsequent updates of the indicator omitted the statistical estimation and the review undertaken was based on expert assessment alone.
Caveats and limitations
There are 3,343 species recorded in the GB-NNSIP; there are likely to be many more alien species in Great Britain that have not yet been recorded.
The indicator is compiled from those invasive non-native species established in or along 10% or more of Great Britain’s land area or coastline (that is, extent categories three and four). There are limitations to this approach:
-
Data collection to inform the method is ongoing but due to time lags in both establishment and observation of non-native species, the list of invasive non-native species has been derived through expert assessment of observed impacts.
-
The extent value is based on relatively broad categories. The extent of some species can increase multi-fold within a single category; for example, the number of invasive non-native species in 10% to 50% of the land area of Great Britain can contain a wide range of values, which can reduce the sensitivity of the indicator.
-
The occurrence data obtained from the NBN may not be representative of the species distribution in each decade, especially for both the earlier and most recent time periods, because observation and detection methods have improved but there is often a time lag before occurrence data appear on the NBN. Furthermore, the availability of occurrence data reflects the intensity of survey effort applied in a time period that has subsequently been submitted to the NBN. The attribution of extent categories has, however, been supplemented by expert opinion and in some cases by more complete datasets.
Recent developments
Review of the species lists and associated extent category scores in 2025 resulted in the addition of five species. Two freshwater fish species were added for the current decade: Micropterus salmoides (extent level 1) and Rhodeus amarus (level 2). Three terrestrial invertebrate species were also added: an ant, Tapinoma pygmaeum (level 1) and a flatworm, Obama nungara, were added for 2010 and the current decade. Another flatworm species, Caenoplana variegata, was included for the past three decades: 2000 and 2010 at level 1, increasing to level 2 for the current decade.
The extent category scores of all the current species on the list were also reviewed but no changes were considered necessary this year.
Rate of establishments
Methodology
A major challenge in understanding trends in invasive species establishment is the time lag between the actual date of establishment in the wild and their discovery (Buba et al. 2024). There is frequently an additional lag between discovery and the retrospective entry of first records and establishment status into the GB-NNSIP database (see the addition of new species in Recent Developments above). These lags can be attributed to several factors:
- Some non-native species are more difficult to detect than others and this will contribute to delays in recording.
- In some cases, those wishing to publish first records of new arrivals will wait until after publication of a paper before sharing details of the new species, although this is increasingly not the case.
- Lack of awareness of the reporting route and requirements.
- Delays can also occur due to unresolved taxonomy.
This section of the indicator uses a different time series than the one used for the pressure indicator (1960-2024). The trend presented here was modelled using data from 1920 to 2000, thereby excluding the most recent 22 years of available data. This approach accounts for lags in detection and recording which can lead to underestimates in the number of establishments, particularly in the most recent years of a time series. It generates a more accurate trend by incorporating historical data that is less affected by detection delays, and by down-weighting more recent data, where establishments may be under-reported. The establishment trends presented here were modelled using the recommended Solow and Costello (2004) method, as implemented in the R package ‘alien’ (Buba et al. 2024), which assumes increasing observation effort with time.
Three invasive species are included here as long term residents, while noting that there is not yet sufficient evidence that they are fully established; these are the pond slider (Trachemys scripta), the European pond turtle (Emys orbicularis), and the pink salmon (Oncorhynchus gorbuscha).
Caveats and limitations
The measure of the rate of invasive alien species establishment is modelled based on a number of assumptions (as outlined in Methodology above) and represents the estimated rate of establishment.
Development plan
The measure on rate of invasive alien species establishment is a new aspect of this indicator. We plan to review this measure during the coming years. We would like to assess how representative it is of the UK overall and whether a future iteration could have UK coverage. In addition, the use of data describing trends in UK trade and transport networks and biological recording has potential to improve the accuracy of the indicator. Models using these additional data tended to forecast trends more accurately, but these models will require further development.
We are keen to hear from our users about these plans, the language and visualisations used in this indicator, as well as our published development plan for the biodiversity indicators: please email us.
References
-
Buba, Y., Kiflawi, M., McGeoch, M.A., Belmaker, J. (2024) Evaluating models for estimating introduction rates of alien species from discovery records. Global Ecology and Biogeography 33(8): e13859. https://doi.org/10.1111/geb.13859
-
Burgman, M. A., & Fox, J. C. (2003). Bias in species range estimates from minimum convex polygons: implications for conservation and options for improved planning. Animal Conservation, 6(01), 19–28.
-
Hill, M. O., Beckmann, B. C., Bishop, J. D. D., Fletcher, M. R., Lear, D. B., Marchant, J. H., Maskell, L. C., Noble, D. G., Rehfisch, M. M., Roy, H. E., Roy, S. & Sewell, J. (2009). Developing an indicator of the abundance, extent and impact of invasive non-native species. Final report. Defra.
-
Roy, H. E., Preston, C. D., Harrower, C. A., Rorke, S. L., Noble, D., Sewell, J., Walker, K., Marchant, J., Seeley, B., Bishop, J., Jukes, A., Musgrove, A. & Pearman, D. (2014). GB Non-native Species Information Portal: documenting the arrival of non-native species in Britain. Biological Invasions, 16(12), 2495–2505.
-
Solow, A. R., & Costello, C. J. (2004). Estimating the rate of species introductions from the discovery record. Ecology, 85(7), 1822–1825. https://doi.org/10.1890/03-3102
-
Stroh, P. A., Leach, S. J., August, T. A., Walker, K. J., Pearman, D. A., Rumsey, F. J., Harrower, C. A., Fay, M. F., Martin, J. P., Pankhurst, T., Preston, C. D. & Taylor, I. (2014). A Vascular Plant Red List for England. Botanical Society of Britain and Ireland, Bristol.
Categories:
Published: