Plants of the wider countryside in the UK
Last updated: 2025
Latest data available: 2024
Introduction
This indicator measures change in the abundance of plant species considered indicative of good habitat condition in the UK, using modelled abundance data from National Plant Monitoring Scheme (NPMS) plots. Plant populations form the environment in which most other species exist, as well as providing numerous ecosystem services. Drivers of change are well-understood for many UK habitats.
This indicator is presented for four UK broad habitat types: Arable field margins; Broadleaved woodlands and hedges; Bog and wet heath; and Lowland grassland. Within each habitat plant species abundance trends considered indicative of good condition are averaged to provide an indication of the habitat’s current state.
Data for this indicator can be found in the published datafile. We also have a similar indicator at the England level.
Type of indicator
State indicator
Type of official statistics
Official statistics in development – indicator under development: The UK biodiversity indicators project team would welcome feedback on the novel methods used in the development of this indicator. For example, does this new indicator measure something readers feel should be measured, and how well does it measure plant abundance? For more information, please visit the UK Statistics Authority’s website on Types of official statistics – UK Statistics Authority.
Assessment of change
As this is an official statistic in development, it has not been assessed.
Key results
In 2024, all of the 4 habitat types presented are comparable to their 2015 baseline level (Figure 1). Changes to how plant species with limited data are modelled have resulted in some differences that mean the trends have changed slightly across all habitat types, most notably for bog and wet heath (see Technical annex for more information).
In 2024:
- Arable field margins are 109% of the baseline value
- Bog and wet heath are 95% of the baseline value
- Broadleaved woodland and hedges are 106% of the baseline value
- Lowland grassland are 107% of the baseline value
Note that the peaks for 2020 in the Arable field margin, Broadleaved woodland & hedges and Lowland grassland indicators are likely to be due to unmodelled bias in the data resulting from the COVID-19 lockdown restrictions of that year.
Figure 1: Abundance of plant species in four UK broad habitat types, 2015 to 2024
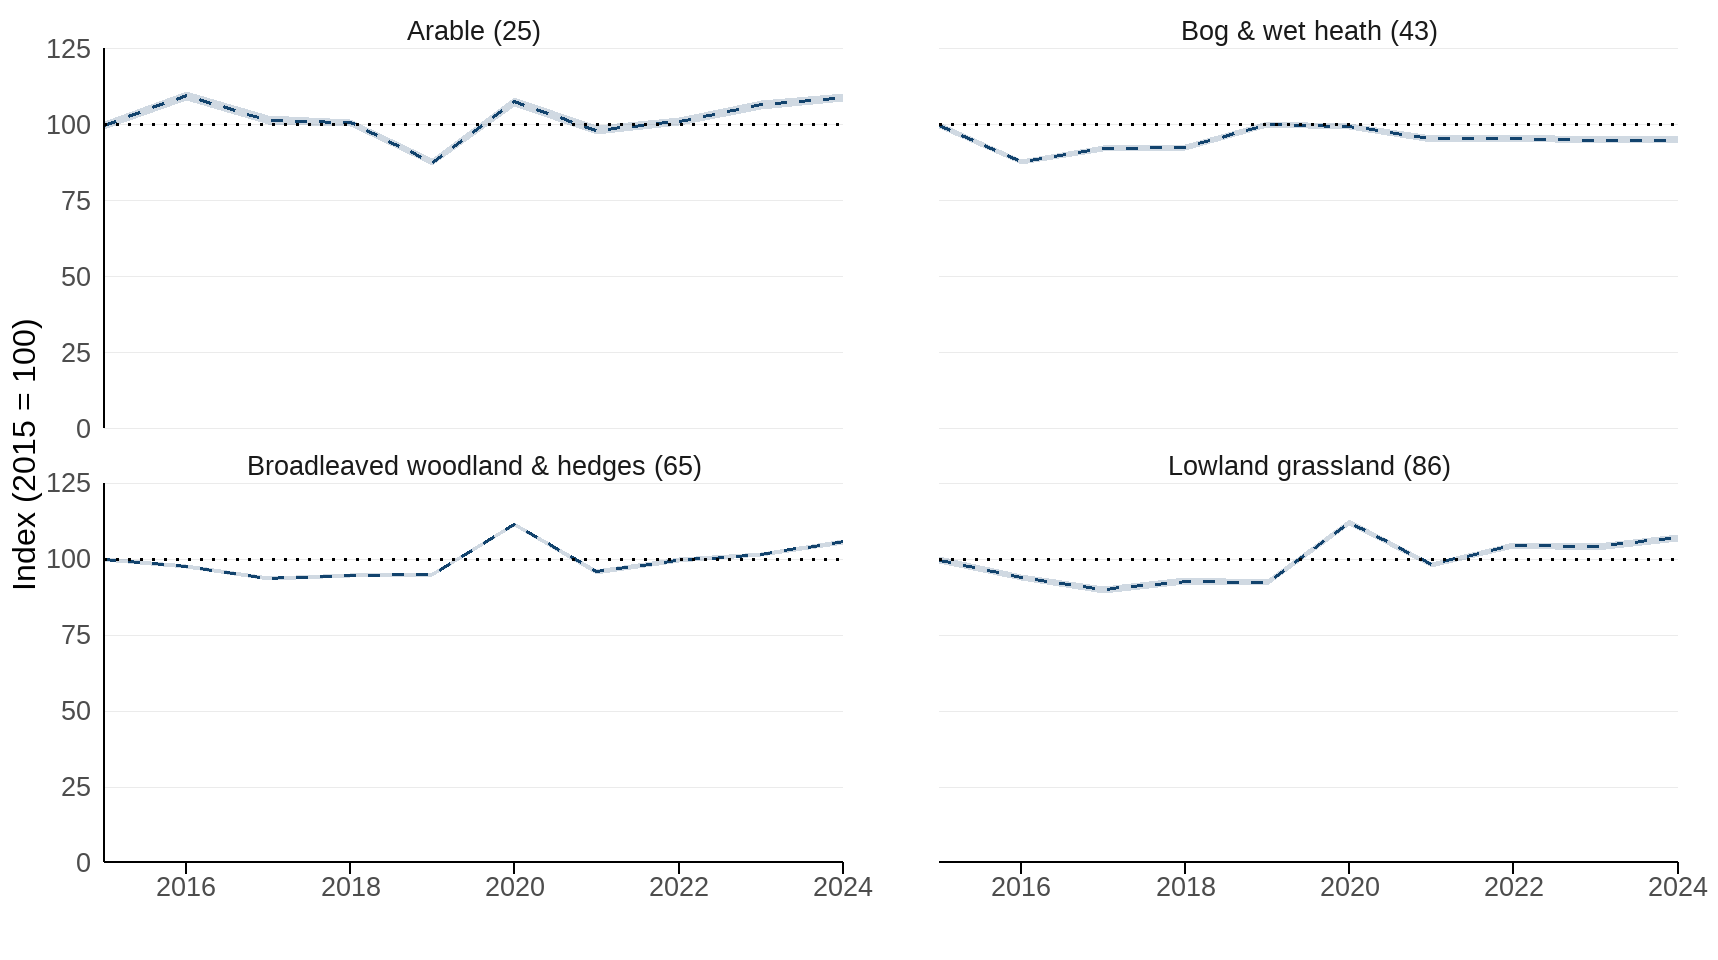
Source: Botanical Society of Britain and Ireland; Joint Nature Conservation Committee; National Plant Monitoring Scheme; Plantlife; UK Centre for Ecology & Hydrology.
Notes about Figure 1
- The line graphs show the unsmoothed trends (dashed line); the variation around the lines shown (the shaded area) is the standard deviation of 1,000 simulated trend indices calculated according to the method of Soldaat et al. (2017).
- Abundance is measured as the average percentage area covered by a species within a plot, including zeros (i.e. absences).
- The figures in brackets indicate the number of species or species aggregates currently included in the composite index for that particular habitat type.
- The standard deviation represents model-based uncertainty and does not necessarily reflect bias in the underlying data relative to real world plant trends.
Further detail
The National Plant Monitoring Scheme (NPMS) was designed to monitor UK habitats of conservation importance. This is achieved through the establishment of small plots in areas of habitats targeted by the scheme. The abundances of plant species, measured as the percentage area covered by a species within a plot, are recorded each year. Surveyors record from different lists of indicator species depending on their level of experience and the habitat within which a plot is located. Both the placement of plots, and the selection of 1 km national grid squares within which the plots are located, are subject to statistical methodologies designed to minimise bias (Pescott et al., 2019a).
The design of the NPMS included the definition of a set of 11 broad habitat types, within which 28 finer habitat types are nested. These fine-scale habitats are linked to existing classifications such as the British National Vegetation Classification. Surveyors can choose, based on their knowledge of a habitat, whether to record a plot at the broader or finer level.
The current indicator summarises species’ percentage cover (abundance) data at the broad habitat level. This is done using a model that is able to account for both the range of percentage covers that a species may exhibit in a habitat when present, and the fact that species may often be absent from any given plot (Pescott et al., 2019b). Such data are often described as “zero-inflated”. This model is applied across years for each species/habitat combination, and the indicators presented here for each broad habitat are the result of combining the resulting species/habitat time trends across the relevant set of NPMS habitat indicator species. The four broad habitat measures presented in this indicator (Arable field margins; Lowland grassland; Broadleaved woodlands and hedges; and Bog and wet heath) are those for which the largest numbers of NPMS plots currently exist. See the Technical annex for more detail.
Relevance
Plants are a large part of the fundamental fabric of which habitats are made and directly indicate changes to environmental conditions and habitat management. Plants provide essential habitats and food for wildlife, and essential ecosystem services for humans, such as reduced erosion, nutrient cycling, oxygen production, and climate regulation. Furthermore, many plants, such as bluebells (Hyacinthoides non-scripta), horse chestnut (Aesculus hippocastanum) fruits (conkers), heather (Calluna vulgaris), oaks (Quercus spp.) and brambles (Rubus spp.) have deep cultural significance and are valued in their own right by the public.
International/domestic reporting
The suite of UK Biodiversity Indicators has been revised and updated to bring it in line with the Kunming-Montreal Global Biodiversity Framework (GBF) of the Convention on Biological Diversity (CBD). Some UKBIs will be used for the forthcoming UK national reports to CBD.
Web links for further information
Acknowledgements
Thank you to the many people who have contributed by providing data and to the many colleagues who have helped produce this indicator, particularly the National Plant Monitoring Scheme, UK Centre for Ecology and Hydrology and their partners.
Technical annex
Comparison to last year
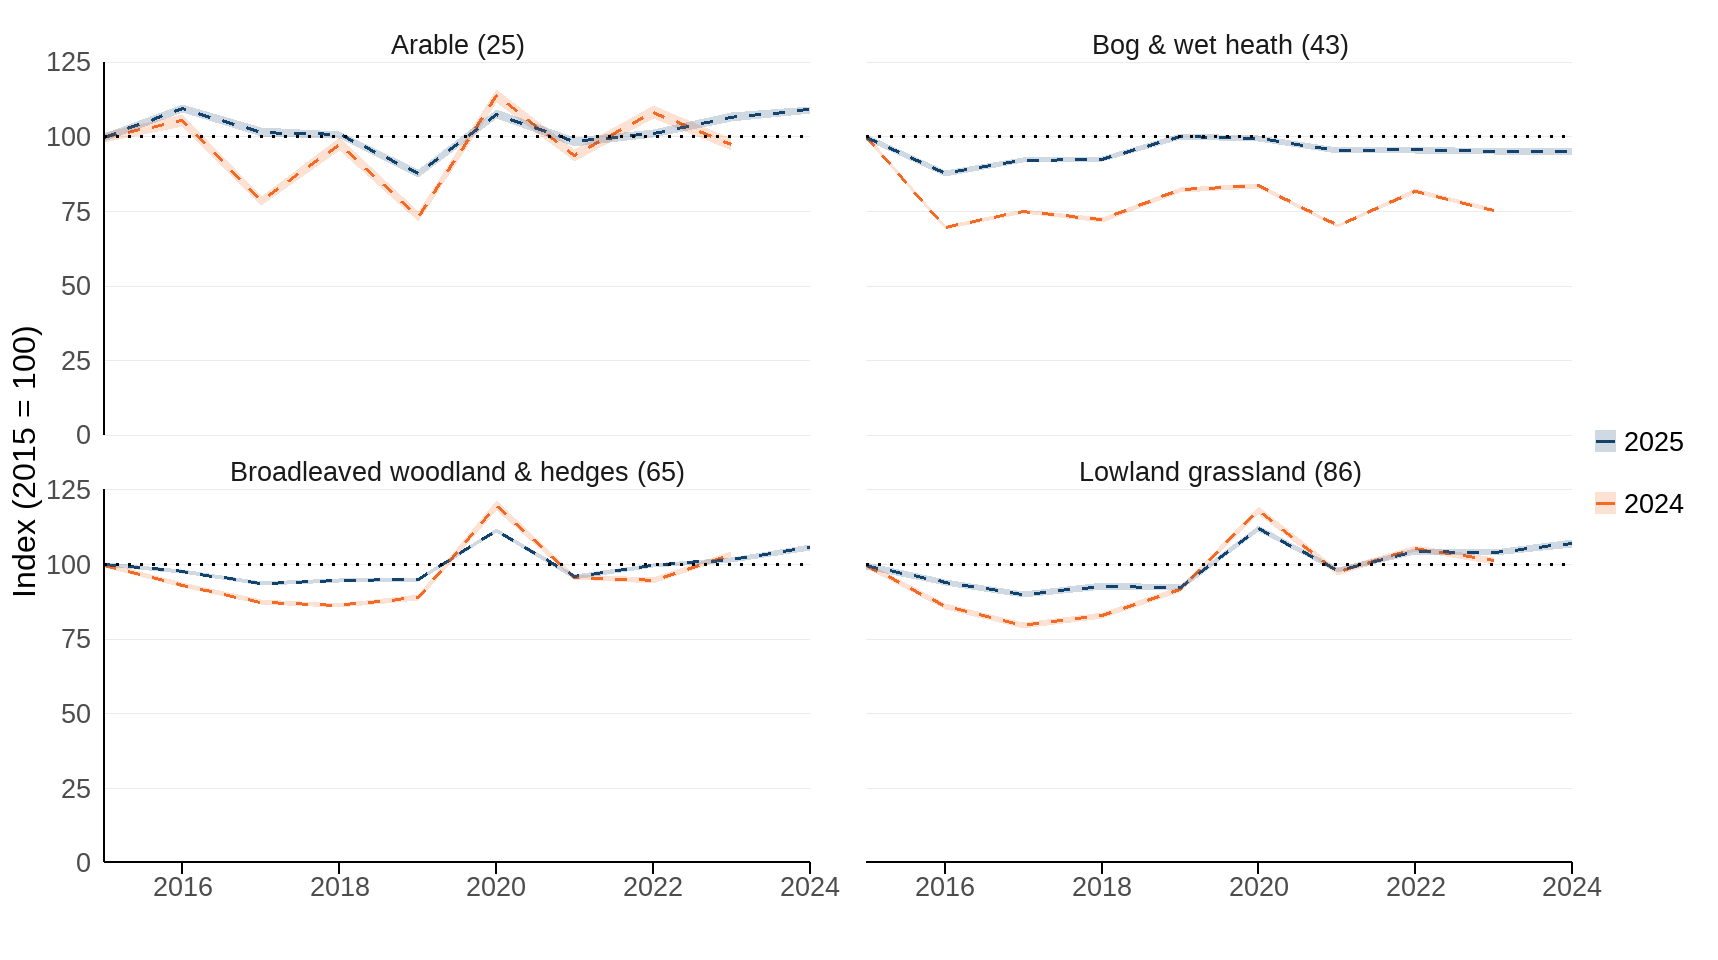
Since the last publication of this indicator, improvements have been made to the species-level models that underlie the trends. This has focused on addressing instability in the trends of less abundant species, with resulting notable differences in the arable and bog and wet heath trends (Figure 2). A full account of these changes can be found in Pescott & Boyd (2025).
Figure 2: Comparison of the plant abundance indices published in 2025 with those published in 2024
Methodology
The creation of the NPMS allowed for the estimation of annual trends in the abundance of plants in habitats of conservation importance. Following five years of development, the scheme was launched by a partnership consisting of the Botanical Society of Britain and Ireland (BSBI), the Joint Nature Conservation Committee (JNCC), Plantlife, and the UK Centre for Ecology & Hydrology (UKCEH) in 2015. This indicator uses species selected by the NPMS as indicative of good condition in those habitat types considered to be of most importance for the conservation of UK biodiversity – see the published datafile for a full list of species included. These species are monitored in small sample plots (between 25 and 100 m2 in area) according to a methodology that was designed to minimise biases in data collection.
Since 2018, UKCEH, with input from all partners, have been developing a method of using NPMS data to indicate annual changes in habitat condition. The method is based on a hierarchical model, formulated in a Bayesian framework, that integrates information on a species’ abundance and occupancy; the occupancy estimates also take advantage of the fact that most plots are surveyed twice a year, allowing model-based adjustments for false negatives (i.e. species that are overlooked during surveys). Simulation tests and applications to real data suggest that the method produces ecologically sensible metrics when the underlying assumptions are met (Pescott et al., 2019b; Pescott & Boyd, 2025).
The 1 km squares of the NPMS were selected according to a weighted-random algorithm designed to introduce a known weighting towards semi-natural habitats. However, within this design, a sampling bias exists in that, in common with other UK structured monitoring schemes based on volunteer participation, squares located within lowland areas are more likely to be sampled. Further work will focus on additional adjustment for bias (Pescott et al., 2019b; Boyd et al., 2023). Please see the Development Plan for more details.
Much of the work undertaken to develop the indicator is documented in a report published by UKCEH (Pescott et al., 2019b). The simulation tests and applications to real data explored in this report indicate that the model performs well in ideal scenarios; biases in less data-rich scenarios could largely be explained by simulated relationships between abundance and detectability. These are likely to be less clear-cut in real datasets. Subsequent to the publication of that report, further work by UKCEH, BSBI, Defra and JNCC explored how additional covariates describing a species’ detectability could be incorporated. The model was also extended to create annual indices, and these have also now been combined into composite species indicators (see below). These extensions to the initial model are now documented in Pescott & Boyd (2025).
The underlying models for each species summarise that species’ percentage cover (i.e. abundance) data at the broad habitat level. This is done using a model that is able to account for both the range of percentage covers that a species may exhibit in a habitat when present, and the fact that a species may often be absent from any given plot (Pescott et al., 2019b; Pescott & Boyd, 2025). Such data are often described as “zero-inflated”. For each NPMS indicator plant species/broad habitat combination, the abundance data for a given year are used to estimate the parameters of an underlying zero-inflated Beta distribution. The mean of this zero-inflated distribution is the annual indicator estimated for a single species within a broad habitat, thus taking into account the frequency with which a species is present across plots and its local abundance when present. This process is repeated across years for each species/habitat combination, creating an annual trend for this metric (Pescott & Boyd, 2025). Subsequently, these individual species/broad habitat trends are combined into a multi species indicator (MSI) as follows:
- Within a broad habitat, simulate 1000 values per species, per year, from the distribution estimated for the mean of the zero-inflated Beta distribution from the appropriate Bayesian model;
- within species, standardise all values to the mean of 2015 (and rescale so that the 2015 mean = 100);
- per year, for each simulation, take the geometric mean of the logged index across species (thus creating 1000 samples of the MSI);
- exponentiate, and calculate the mean and standard deviation across these MSI samples (this yields the indicators presented).
This follows the logic of the method presented by Soldaat et al. (2017). The 4 broad UK habitat indicators presented are those for which the largest numbers of NPMS plots currently exist: Arable field margins; Broadleaved woodland and hedges; Bog and wet heath; and Lowland grassland. Maps of the locations of the 1 km squares contributing plot data to the current indicators by UK NPMS broad habitat are provided in Sampling Sites; lists of species included within each UK broad habitat are provided in Species Included.
Development plan
We are keen to hear feedback from users of these statistics, please send your feedback to: biodiversity@defra.gov.uk.
Longer term development plans:
Below are actions we are advancing with the data providers. This work will take slightly longer and will be part of post-2026 statistical releases.
- Propagate uncertainty. In line with a development made to the England level indicator, we will adapt the modelling such that uncertainty in the species level trends is propagated fully through to the multi-species trends.
- Annual bias adjustments for species’ trends. All monitoring schemes reliant on volunteer-collected data suffer from the potential for geographic bias (Boyd et al., 2023), and any given bias is highly unlikely to be constant over time, especially where species’ populations themselves are changing (Boyd et al., 2024b). Various methods for re-weighting samples to better match a statistical target population have recently been reviewed by ecologists (Boyd et al., 2024a), and we will investigate the possibility of applying one such method to the NPMS species’ trends.
- Review the approach used to produce the multi-species indicator (MSI). The NPMS currently uses the method of Soldaat et al. (2017) to produce its broad habitat level MSI. However, other approaches have been proposed that claim more “generality” (Freeman et al., 2021). Given that any model relies on assumptions about data structures and inferential objectives, a fuller understanding of these in relation to Soldaat et al. (2017) and Freeman et al. (2021) would help to clarify when each of the different approaches is likely to be appropriate. Such an understanding would also aid MSI users.
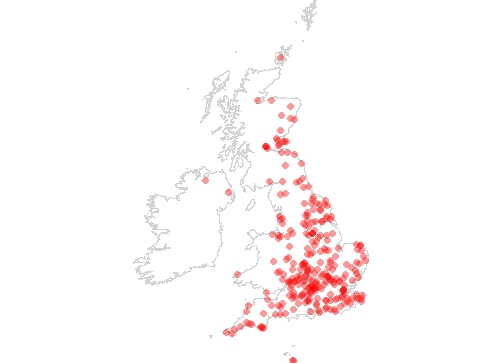
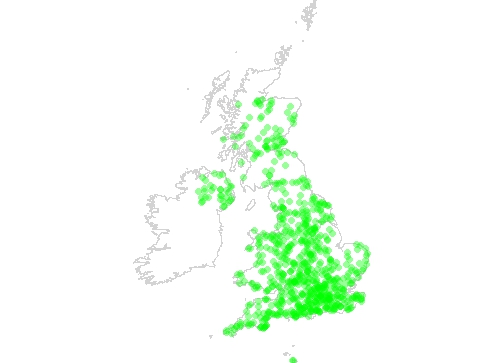
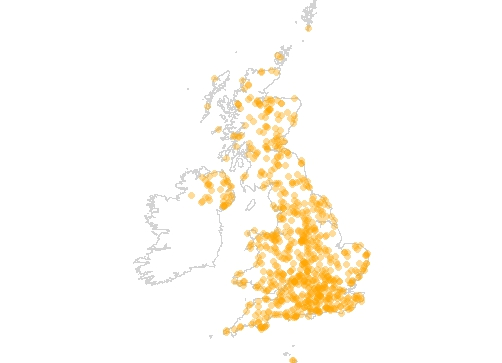
Sampling sites
The distribution of monads with NPMS samples 2015-2024 for each named NPMS broad habitat in the UK
Arable field margins
Broadleaved woodlands and hedges
Bog and wet heath
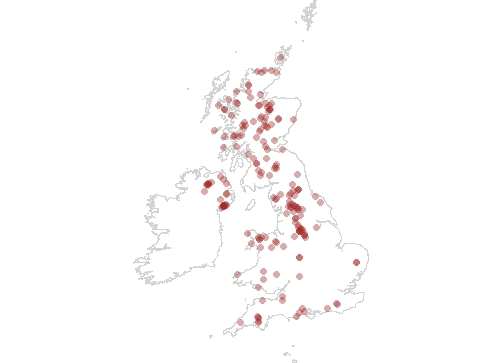
Lowland grassland
Sampling coverage and bias
Scientists at the UK Centre for Ecology and Hydrology have looked at sampling coverage and bias in the NPMS; they wanted to know if the distribution of sampling sites was even across the UK as well as the habitats and environments which make up the UK. A deeper understanding of the likelihood and scale of sampling bias, as well as how this changes over time, can aid in the interpretation of the data derived from the survey (Boyd et al., 2021).
NPMS survey locations were combined with climatic data, both at the 1 km grid square scale. To simplify, these data were then run through a clustering algorithm, which grouped the annual survey locations based on their climactic similarity. The algorithm grouped the data into two clusters, separating 2019–2020 and 2023 from all other years (2015–2018; 2021–2022; 2024). Using a Principle Components Analysis (PCA) based ordination, they then assessed the coverage of sample sites across the UK. Overall coverage across years was high, indicating that sampled locations span most of the environments across the UK, though with some gaps. However, more intensively sampled regions cover a narrower range of climate variables, meaning some environments may still be underrepresented. For instance, sampling in upland environments is relatively low, and we know that these areas experience a different climate to the better sampled lowland areas. Sampling intensity in the NPMS has been shown to be at least partly related to population density (Pescott et al., 2019a).
In summary, the sample locations coverage of the environmental space of the UK is broad and relatively stable across time periods, but intensive sampling is focused on a relatively small subset of conditions, such as the south-east of England. This conclusion supports previous assessments of potential environmental bias in NPMS survey returns (Pescott et al., 2019a).
Species included
As data becomes available for more species, we will incorporate them into the indicators wherever possible, providing users with a better understanding of how our wild plants are faring. For a full species list, please see the published datafile.
References
- Boyd, R.J., Powney, G.D., Carvell, C. and Pescott, O.L. (2021). occAssess: An R package for assessing potential biases in species occurrence data. Ecology and Evolution, 11(22), pp.16177-16187. DOI:10.1002/ece3.8299
- Boyd, R.J., Powney, G.D. and Pescott, O.L. (2023). We need to talk about nonprobability samples. Trends in Ecology & Evolution, 38(6), pp.521-531. DOI:10.1016/j.tree.2023.01.001
- Boyd, R.J., Stewart, G.B. and Pescott, O.L. (2024a). Descriptive inference using large, unrepresentative nonprobability samples: An introduction for ecologists. Ecology, 105(2): e4214. DOI:10.1002/ecy.4214
- Boyd, R.J., Bowler, D.E., Isaac, N.J. and Pescott, O.L. (2024b). On the trade-off between accuracy and spatial resolution when estimating species occupancy from geographically biased samples. Ecological Modelling, 493, p.110739. DOI:10.1016/j.ecolmodel.2024.110739
- Freeman, S.N., Isaac, N.J., Besbeas, P., Dennis, E.B. and Morgan, B.J. (2021). A generic method for estimating and smoothing multispecies biodiversity indicators using intermittent data. Journal of Agricultural, Biological and Environmental Statistics, 26, pp.71-89. DOI:10.1007/s13253-020-00410-6
- Hijmans, R.J., Barbosa, M., Ghosh, A. and Mandel, A. (2025). geodata: Access Geographic Data. R Package version 0.6-4, https://github.com/rspatial/geodata.
- Pescott, O.L., Walker, K.J., Harris, F., New, H., Cheffings, C.M., Newton, N., Jitlal, M., Redhead, J., Smart, S.M. and Roy, D.B. (2019a). The design, launch and assessment of a new volunteer-based plant monitoring scheme for the United Kingdom. PLoS ONE, 14(4): e0215891. DOI:10.1371/journal.pone.0215891
- Pescott, O.L, Powney, G.P. and Walker, K.J. (2019b). Developing a Bayesian species occupancy/abundance indicator for the UK National Plant Monitoring Scheme. Wallingford, NERC/Centre for Ecology & Hydrology and BSBI, 29pp. DOI:10.13140/RG.2.2.23795.48161
- Pescott, O.L. and Boyd, R.J. (2025). Stabilising sparse-data trends in the National Plant Monitoring Scheme: a scalable Bayesian model for plant abundance. Wallingford, UKCEH, 15pp. DOI: 10.13140/RG.2.2.36345.38248
- Soldaat, L.L., Pannekoek J., Verweij, R.J.T., Van Turnhout, C.A.M. and Van Strien, A.J. (2017). A Monte Carlo method to account for sampling error in multi-species indicators. Ecological Indicators, 81(October 2017): 340–347 DOI:10.1016/j.ecolind.2017.05.033
Categories:
Published: