Fish size classes in the North Sea
Last updated: 2025
Latest data available: 2020
|
In 2025 new indicators have been developed and published in the UK Biodiversity Indicators suite. These indicators were developed to report on progress towards the goals and targets of the Kunming-Montreal Global Biodiversity Framework. Alongside this, the Biodiversity Indicators production team have sought feedback from our users, and used this feedback to identify existing indicators which can be discontinued whilst minimising impact on our users. |
Introduction
The indicator shows changes in the proportion, by weight, of large individuals equal to or over 50 cm in length in demersal (bottom-dwelling) fish populations in the North Sea. Changes in the size structure of fish populations and communities reflect changes in the state of the fish community. Fluctuations in values between years are expected given inter-annual fluctuations in the distribution and abundance of North Sea fish populations and sampling variation.
The latest data available for sea areas around the UK are:
- Proportion of large fish by weight in the North Sea - 2020
- Proportion of large fish by weight in the Scottish Continental Shelf - 2020
- Proportion of large fish by weight in the Irish Sea - 2019
- Proportion of large fish by weight in the Celtic Sea - 2020
Data for this indicator can be found in the published datafile.
Type of indicator
State/Benefit indicator
Type of official statistics
Official statistic
Contents
- Assessment of change
-
Key results
- Figure 1: Percentage of large fish (equal to or larger than 50cm), by weight, in the North Sea, 1983 to 2020
- Figure 2: Percentage of large fish (equal to or greater than 35cm), by weight, in the Scottish Continental Shelf, 1985 to 2020
- Figure 3: Percentage of large fish (equal to or greater than 35 cm), by weight, in the Irish Sea, 1993 to 2019
- Figure 4: Percentage of large fish (equal to or greater than 40cm), by weight, in the Celtic Sea, 1997 to 2020
- Further detail
- Acknowledgements
- Technical Annex
- References
Assessment of change
Change in the proportion of large fish in the North Sea, by weight:
| Measure | Assessment | Time period | Result |
|---|---|---|---|
| Fish size in the North Sea | Long term | 1983 to 2020 | Deteriorating |
| Fish size in the North Sea | Short term | 2015 to 2020 | Deteriorating |
Notes on the indicator assessment
Analysis of the underlying trends is carried out by the data providers. See Assessing Indicators. The long-term and short-term assessments have been made by the Centre for Environment, Fisheries and Aquaculture Science (Cefas) by assessing change in the fitted LOESS smoothed trend.
Key results
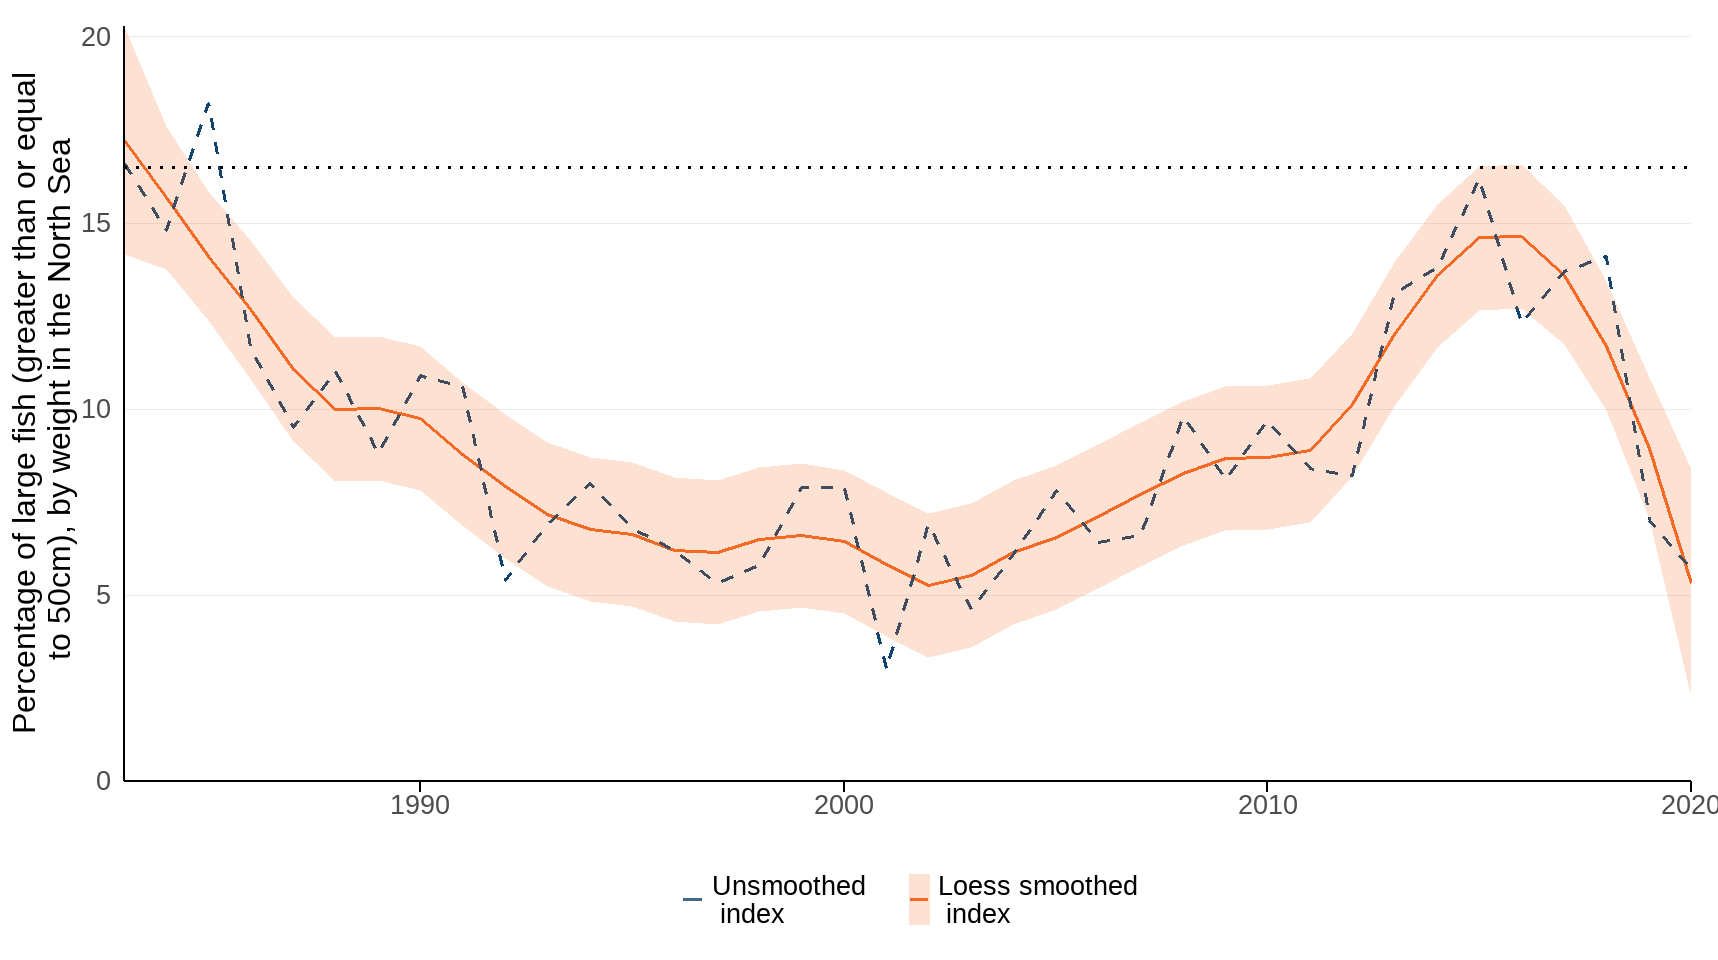
In 2020, large fish in the North Sea survey made up 6% of the weight of the fish community. This is below the value of 17% recorded in 1983, but above the low of 3% in 2001. There was a clear decline in the indicator from 1983 to 2001, followed by a rapid recovery to 16% in 2015 and a dramatic fall between 2018 and 2020.
Figure 1: Percentage of large fish (equal to or larger than 50cm), by weight, in the North Sea, 1983 to 2020
Source: Centre for Environment, Fisheries and Aquaculture Science (CEFAS: DOI: 10.14466/CefasDataHub.126); Marine Scotland
Notes about Figure 1
- LOESS is a non-parametric regression method; it may be understood as standing for “LOcal regrESSion”.
- The horizontal black dashed line is for the OSPAR assessment target.
- The shading around the Loess smoothed index indicates the range within which we can be 95% confident that the true values lie.
Figure 2 shows data for the Scottish Continental Shelf region. In 2020, large fish (equal to or greater than 35 cm) made up approximately 29% of the weight of the surveyed demersal fish community. This was lower than the 46% observed in 1985 and lower than the 51% target. While there was a clear decline in the indicator during the 1990s, to 12% in 2002, the smoothed trend has shown increases with fluctuations since that time.
Figure 2: Percentage of large fish (equal to or greater than 35cm), by weight, in the Scottish Continental Shelf, 1985 to 2020
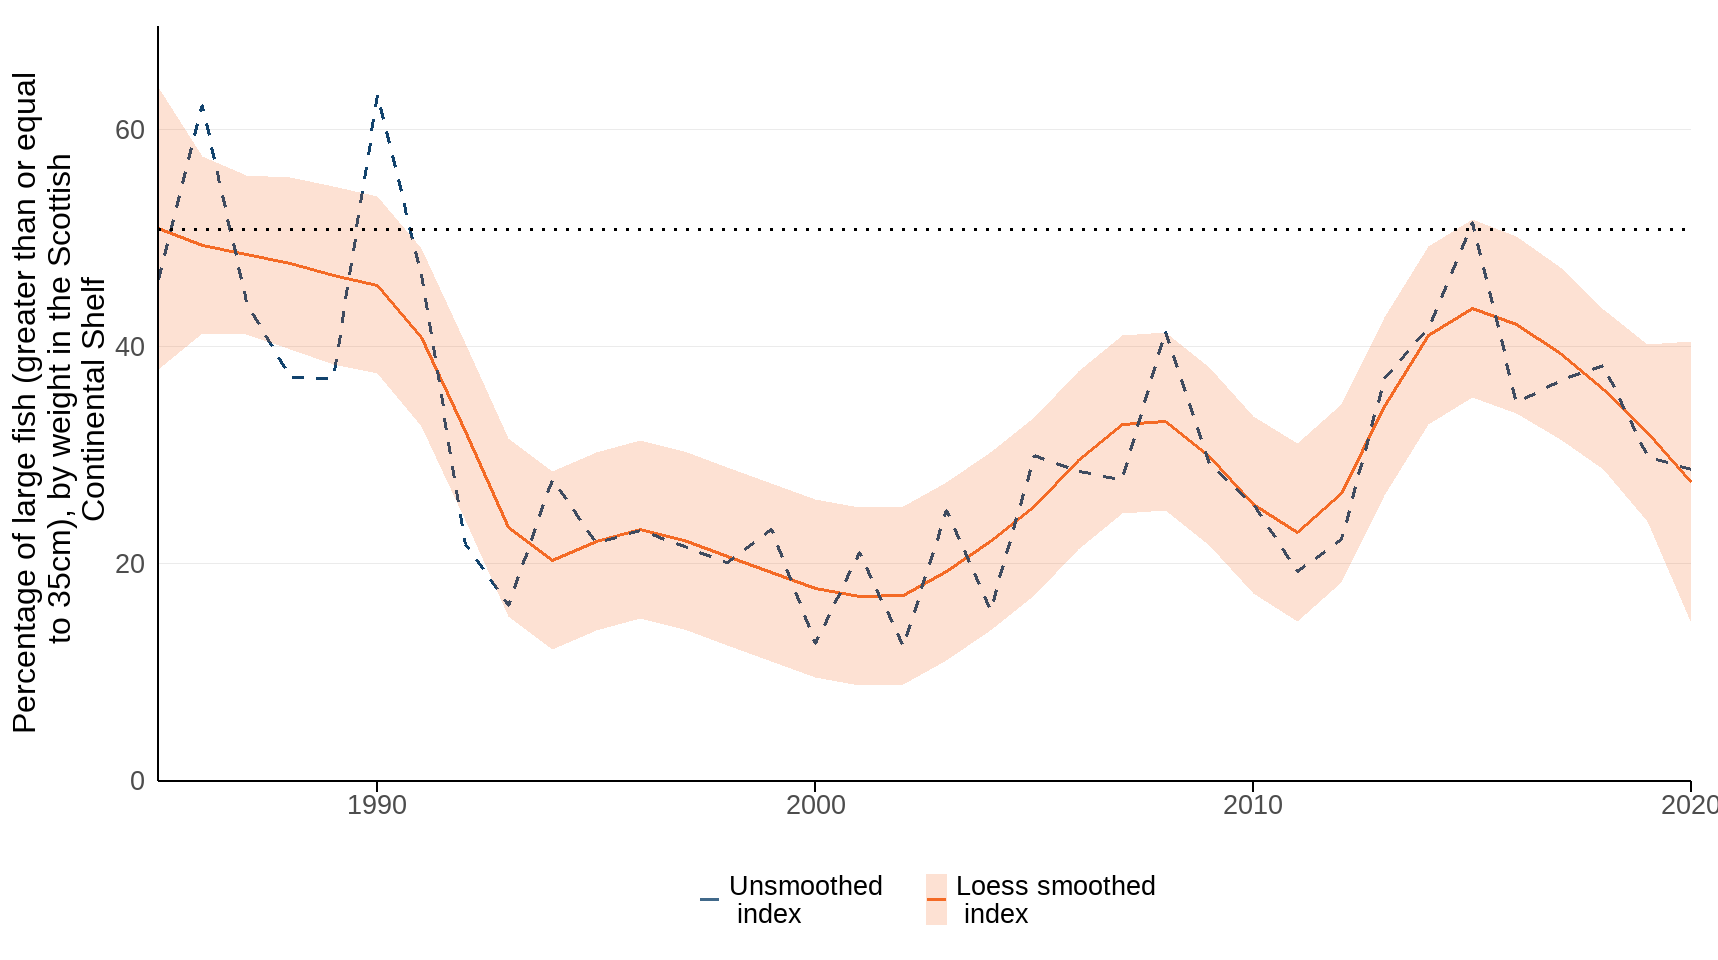
Source: Centre for Environment, Fisheries and Aquaculture Science (CEFAS: DOI: 10.14466/CefasDataHub.126); Marine Scotland
Notes about Figure 2
- LOESS is a non-parametric regression method; it may be understood as standing for “LOcal regrESSion”.
- The horizontal black dashed line is for the OSPAR assessment target.
- The shading around the Loess smoothed index indicates the range within which we can be 95% confident that the true values lie.
Figure 3 shows data for the Irish Sea region. In 2019, large fish (equal to or greater than 35 cm) made up approximately 38% of the weight of the surveyed demersal fish community. This was higher than the 33% recorded in 1993, but lower than the peak of 45% in 2011. Increases have been prominent since the mid-2000s, despite a notable dip in 2014 and 2015.
Figure 3: Percentage of large fish (equal to or greater than 35 cm), by weight, in the Irish Sea, 1993 to 2019
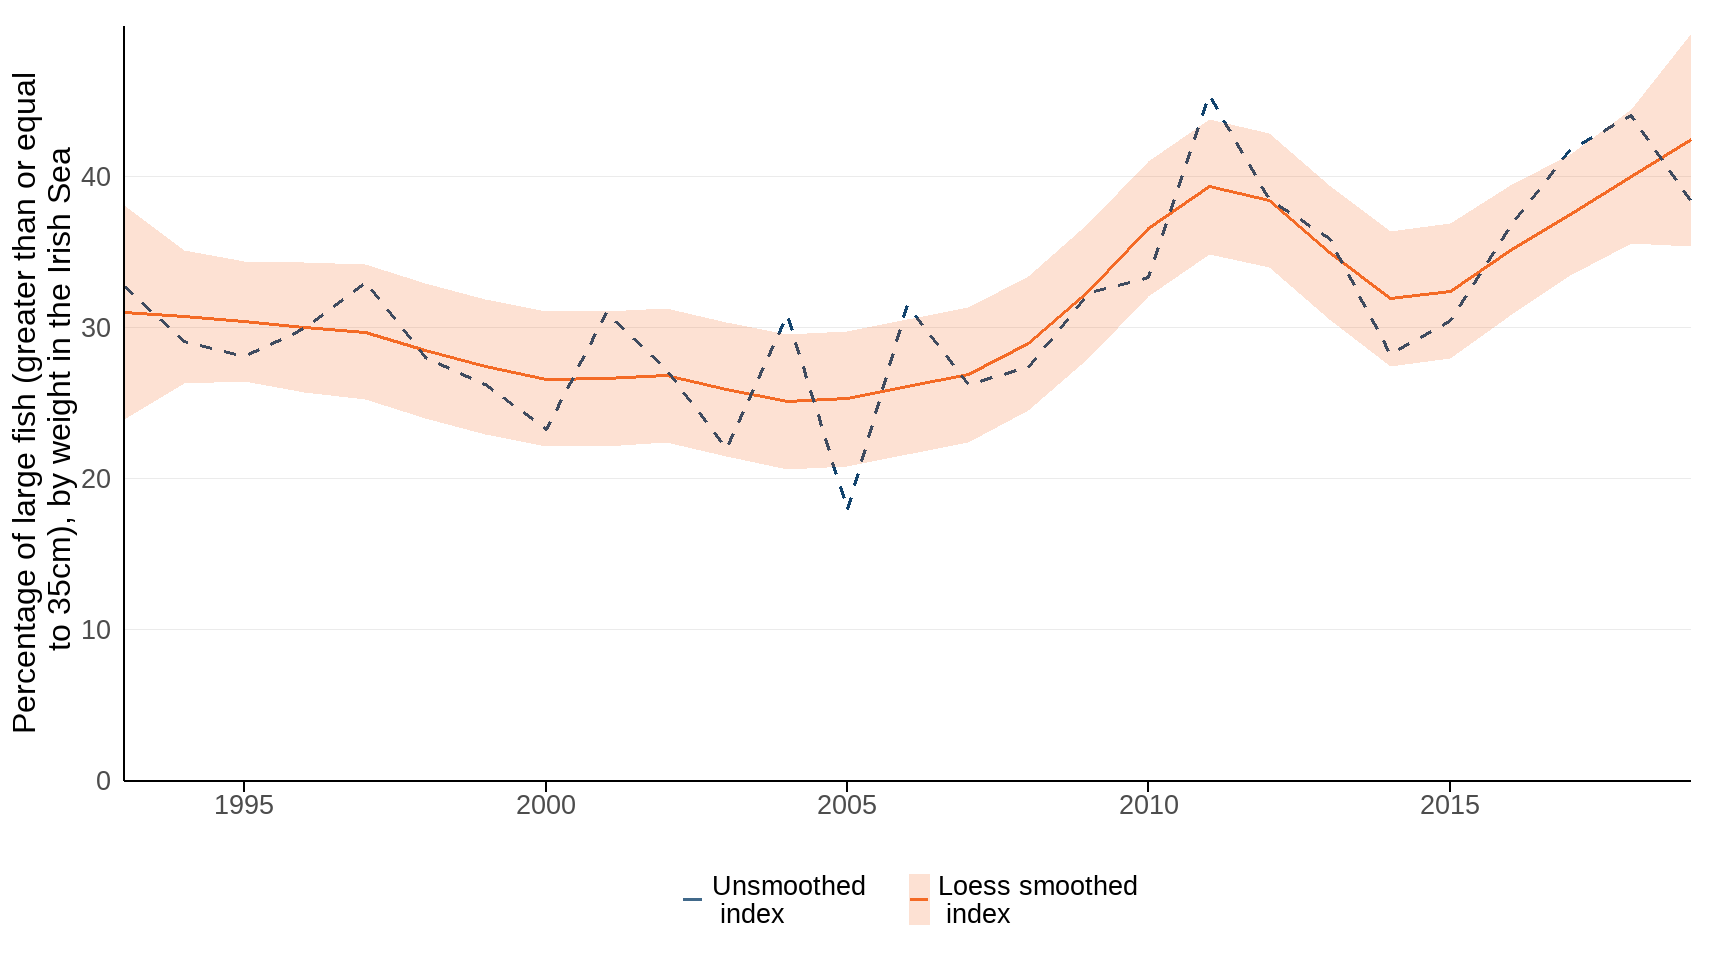
Source: Centre for Environment, Fisheries and Aquaculture Science (CEFAS: DOI: 10.14466/CefasDataHub.126); Marine Scotland
Note about Figure 3:
- LOESS is a non-parametric regression method; it may be understood as standing for “LOcal regrESSion”.
- The shading around the Loess smoothed index indicates the range within which we can be 95% confident that the true values lie.
Figure 4 shows data for the Celtic Sea region. In 2020, large fish (equal to or greater than 40 cm) made up approximately 19% of the weight of the surveyed demersal fish community. This was equal to the initial value recorded in 1997 but below the average across the time series of 21%. The smoothed trend has been stable, but with great fluctuations throughout the survey period.
Figure 4: Percentage of large fish (equal to or greater than 40cm), by weight, in the Celtic Sea, 1997 to 2020
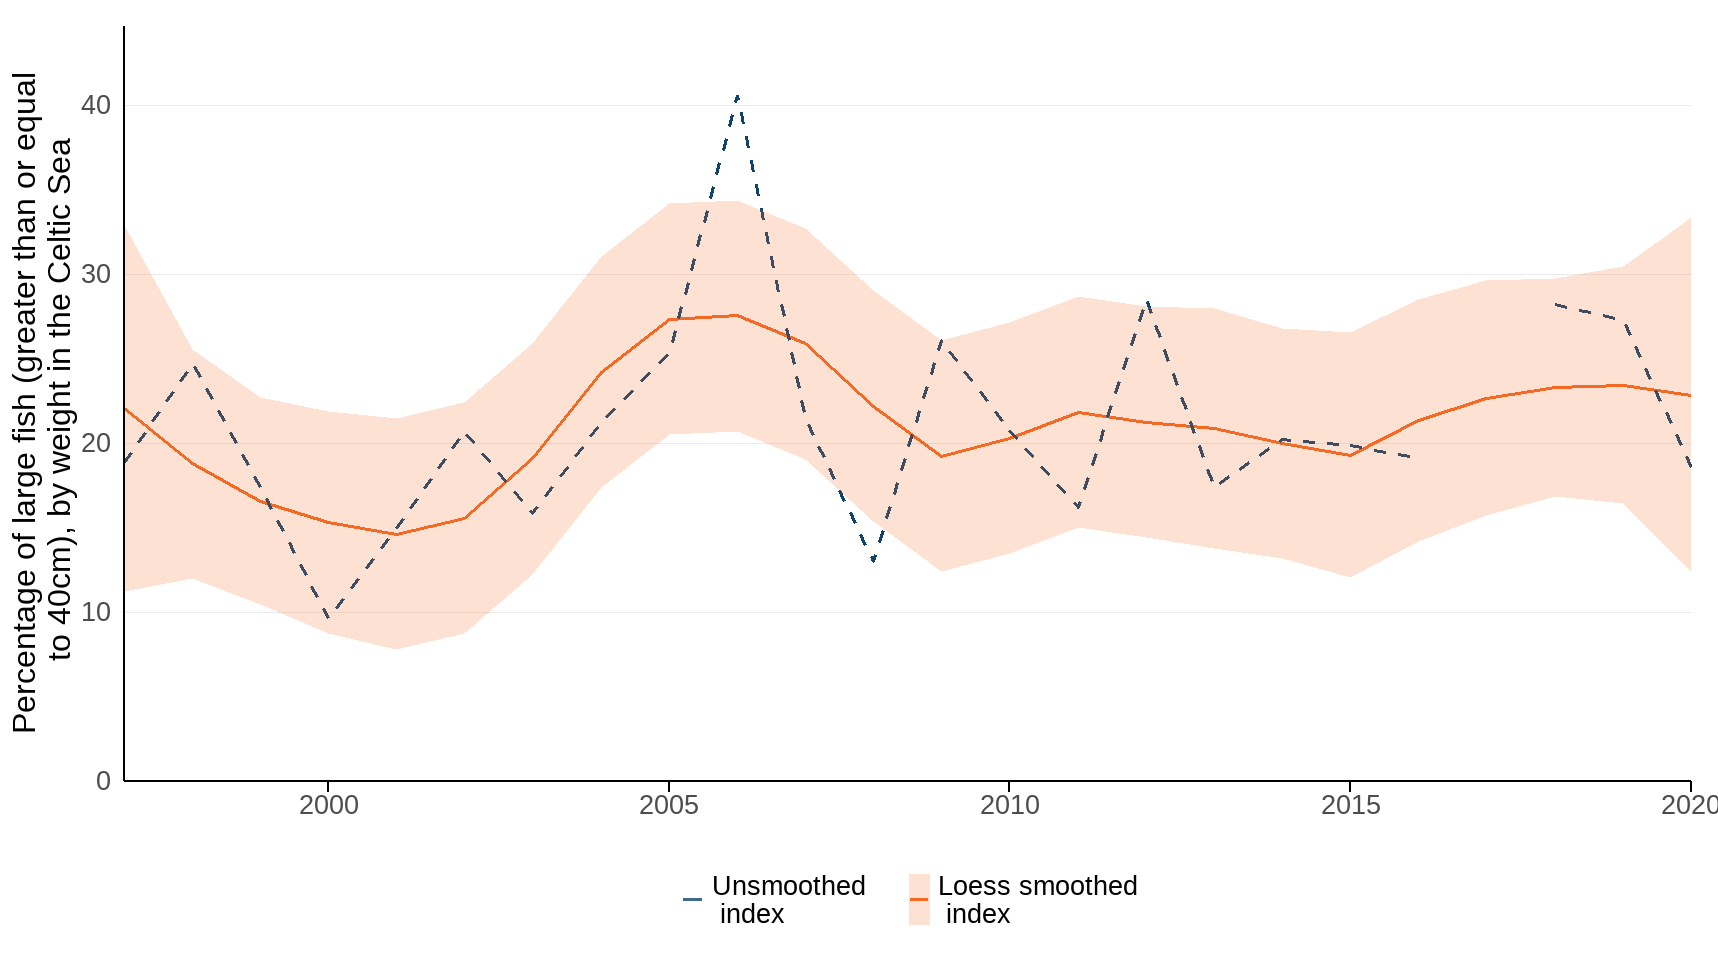
Source: Centre for Environment, Fisheries and Aquaculture Science (CEFAS: DOI: 10.14466/CefasDataHub.126); Marine Scotland
Notes about Figure 4
- LOESS is a non-parametric regression method; it may be understood as standing for “LOcal regrESSion”.
- No data point is provided for 2017 because there was no sampling.
- The shading around the Loess smoothed index indicates the range within which we can be 95% confident that the true values lie.
Further detail
For information on the methods used in this indicator, please see Technical Annex below.
Relevance
Change in the relative abundance of large fishes is likely to affect marine ecosystems in several ways. Fewer large fishes will reduce the amount of predation on smaller prey species and allow increases in their abundance and biomass. In turn, this will affect the structure and stability of the ecosystem. The indicator responds to fishing impacts on the fish community because larger fish are more likely to be caught by trawls, and because larger species of fish are more likely to decline in number for a given rate of fishing (Engelhard et al. 2015; Greenstreet et al. 2012; 2011). When fish communities are more heavily fished the proportion of large fish is expected to fall, and when fishing is reduced the proportion of large fish is expected to rise, albeit with a multi-year delay. Some variation in the proportion of large fish will be driven by environmental variation and, in the long term, increases in temperature may lead to decreased body size of demersal fish in the North Sea (Queirós et al. 2018). However, in the short term (over periods of a few years) environmental effects on this indicator are expected to be relatively small in relation to fishing effects. Under currently prevailing conditions, fishing at Maximum Sustainable Yield (MSY) in the North Sea has been shown to lead to gradual recovery in the indicator in the long term (Spence et al., 2021).
International/domestic reporting
The suite of UK Biodiversity Indicators has been revised and updated to bring it in line with the Kunming-Montreal Global Biodiversity Framework (GBF) of the Convention on Biological Diversity (CBD). Some UKBIs will be used for the forthcoming UK national reports to CBD.
Web links for further information
- OSPAR’s website on the Proportion of Large Fish (Large Fish Index)
- UK Marine Strategy Assessment 2019 website on the Proportion of Large Fish
- Defra’s Science web page on the Development of a Marine Trophic Index for UK waters and recommendations for further indicator development (Cotter et al. 2008)(PDF, 1.4Mb)
- International Council for the Exploration of the Sea (ICES) home page
Acknowledgements
Thank you to the many people who have contributed by providing data and to the many colleagues who have helped produce this indicator. In particular, thanks go to colleagues at Cefas.
Technical Annex
Methodology
The indicator is compiled using methods based on those developed by the International Council for the Exploration of the Sea (ICES) for the analysis of International Bottom Trawl Survey data (ICES, 2007), and further developed for the OSPAR Intermediate Assessment 2017, and since updated (Greenstreet and Moriarty, 2017; Moriarty et al 2017; Lynam et al. 2022; OSPAR, 2023). Data on fish length are taken from surveys carried out in the North Sea during the first quarter of each year. All fish are measured as part of the survey, but only demersal fish species are used in the indicator.
To compile the indicator, the proportions of fish in the North Sea greater than or equal to 50 cm are estimated by weight. For other seas, a different threshold for ‘large’ is selected based on signal-to-noise analyses. Technical documentation for the indicator is available on the Marine Online Assessment Tool’s (MOAT) website. The method involves additional averaging of catch densities across hauls within ICES rectangles, prior to summation of the large and total fish components for the Large Fish Indicator (LFI) ratio calculation.
The background to this indicator previously included information from sub-divisional assessments within the North Sea, but current assessments are only available at the regional sea level (Figures 1 to 4). From the extensive OSPAR assessment, three trawl surveys were selected to provide the key data for each regional sea area, considering the length of the time-series, spatial coverage and quality of data. These surveys are the Scottish otter trawl survey in Quarter one for the Scottish Continental Shelf, the English beam trawl survey in Quarter three for the Irish Sea, and the northern part of the French otter trawl survey in quarter four for the Celtic Sea.
Figure 5: Areas surveyed to generate the fish size class indicator for the seas around the UK
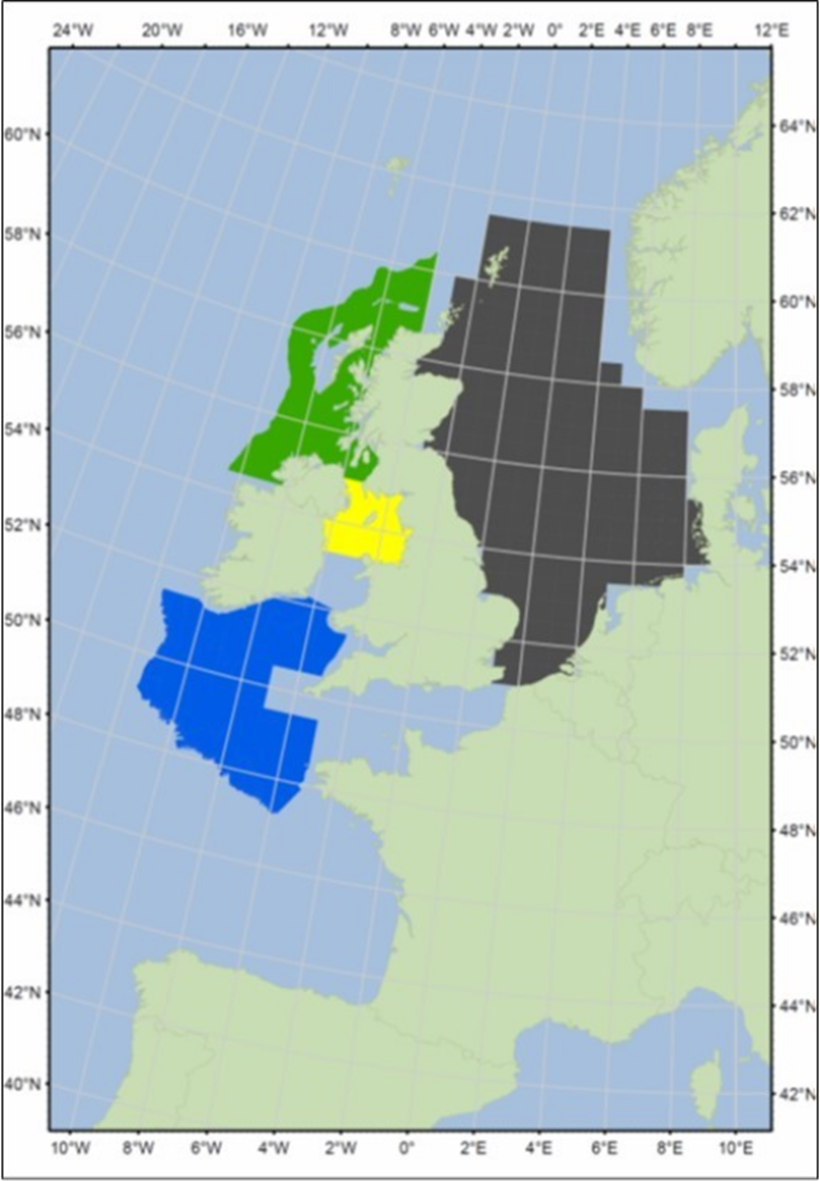
Source: Centre for Environment, Fisheries and Aquaculture Science (CEFAS)
Notes about Figure 5:
- The North Sea area is coloured dark grey in figure 5.
- The Scottish Continental Shelf is coloured green in figure 5.
- The Irish Sea is coloured yellow in figure 5.
- The Celtic Sea is coloured dark blue in figure 5.
Background
The indicator shows changes in the proportion, by weight, of large individuals equal to or over 50 cm in length in demersal fish populations in the North Sea. The indicator is based on standardised trawls from international scientific surveys conducted annually. During the 1980s, large fish in the North Sea fish community included cod (Gadus morhua), ling (Molva molva), haddock (Melanogrammus aeglefinus), saithe (Pollachius virens), anglerfish (Lophius piscatorius) and rays (Batoidea). Recently, lesser spotted dogfish (Scyliorhinus canicula), hake (Merluccius merluccius) and smoothhounds (Mustelus spp.) have also formed a substantial part of the large-fish catches in the northern North Sea. In 2019, a substantial reduction in large cod and saithe was evident in the survey along with an increase in small haddock, whiting (Merlangius merlangus), and dab (Limanda limanda).
The measure for the North Sea is used as the main indicator because it is based on the largest dataset that includes an assessment target period (early 1980s), and it is supported by publications, and therefore provides the most reliable indicator of change.
Figure 1 presents the LOESS smoothed trend that is used to assess both long-term and short-term trends in the proportion of large individuals in North Sea fish populations.
Development plan
Since our previous publication we have adapted the language and visualisations used in this indicator. We are keen to hear from our users about these changes, as well as our published development plan, please email us.
References
- Cotter, J., Rogers, S., Ellis, J., Mackinson, S., Dulvy, N., Pinnegar, J., Jennings, S. & Greenstreet, S. (2008) Marine Ecosystem Integrity: Development of a Marine Trophic Index for UK waters and recommendations for further indicator development. Final report for Defra, Centre for Environment, Fisheries and Aquaculture Science (Cefas)
- Engelhard, G.H., Lynam, C.P., Garcia-Carreras, B., Dolder, P.J. & Mackinson, S. (2015) Effort reduction and the large fish indicator: spatial trends reveal positive impacts of recent European fleet reduction schemes. Environmental Conservation 42: 227-236 (https://doi.org/10.1017/S0376892915000077)
- Greenstreet, S.P.R and Moriarty, M. (2017) Manual for Version 3 of the Groundfish Survey Monitoring and Assessment Data Product. Scottish Marine and Freshwater Science Vol 8 No 18, 77pp. (https://doi.org/10.7489/1986-1)
- Greenstreet, S.P.R., Rogers, S.I., Rice, J.C., Piet, G.J., Guirey, E.J., Fraser, H.M., Fryer, R.J. (2011). Development of the EcoQO for fish communities in the North Sea. ICES Journal of Marine Science 68: 1-11
- International Council for the Exploration of the Seas (ICES). (2007) Development of EcoQO on changes in the proportion of large fish and evaluation of size-based indicators. International Council for the Exploration of the Sea, Copenhagen. ICES ACE Report 2007
- Moriarty, M., Greenstreet, S.P.R. and Rasmussen, J. (2017) Derivation of Groundfish Survey Monitoring and Assessment Data Product for the Northeast Atlantic Area. Scottish Marine and Freshwater Science Vol 8 no 16, 240pp. (https://doi.org/10.7489/1984-1)
- OSPAR (2017). Intermediate Assessment 2017. Available at: (https://oap.ospar.org/en/ospar-assessments/intermediate-assessment-2017)
- OSPAR (2023). Quality Status Report 2023. Available at: (https://oap.ospar.org/en/ospar-assessments/quality-status-reports/qsr-2023/indicator-assessments/proportion-lfi/)
- Queirós A.M., Fernandes J., Genevier L. & Lynam C.P. (2018) Climate change alters fish community size‐structure, requiring adaptive policy targets. Fish and Fisheries. 2018; 00:1–9. (https://doi.org/10.1111/faf.12278)
- Spence, M.A., Griffiths, C.A., Waggitt, J.J., Bannister, H.J., Thorpe, R.B., Rossberg, A.G. and Lynam, C.P. (2021) Sustainable fishing can lead to improvements in marine ecosystem status: an ensemble-model forecast of the North Sea ecosystem. Marine Ecology Progress Series 680:207-221. Available at: (https://doi.org/10.3354/meps13870)
Categories:
Published: