Taking action for nature: volunteer time spent in conservation
Last updated: 2025
Latest data available: 2023
Introduction
This indicator presents an index of the number of hours worked by volunteers for 13 UK conservation charities and public bodies (see background section for a full list). Conservation volunteering includes any voluntary activity for an organisation or community undertaken to: further the understanding, protection or enjoyment of, and better connection with, the natural environment, including wildlife recording and surveying; practical countryside management; providing education, training and guided walks; and administration or other office support.
The data for this indicator can be downloaded from here: JNCC’s Resource Hub. We also have a similar indicator at the England level.
Type of Indicator
Benefit indicator
Type of official statistic
Official statistic
Assessment of change
Assessment of change in volunteer time spent in conservation.
| Measure | Assessment | Time period | Result |
|---|---|---|---|
| Conservation Volunteering | Long term | 2000 to 2023 | Improving |
| Conservation Volunteering | Short term | 2018 to 2023 | Improving |
Notes on indicator assessment
Long- and short-term assessments are based on a 3% rule of thumb. Where possible, the base years for these assessments use a three-year average. See Assessing Indicators.
Key results
The amount of time people spend volunteering to assist with conservation in part reflects society’s interest in and commitment to biodiversity.
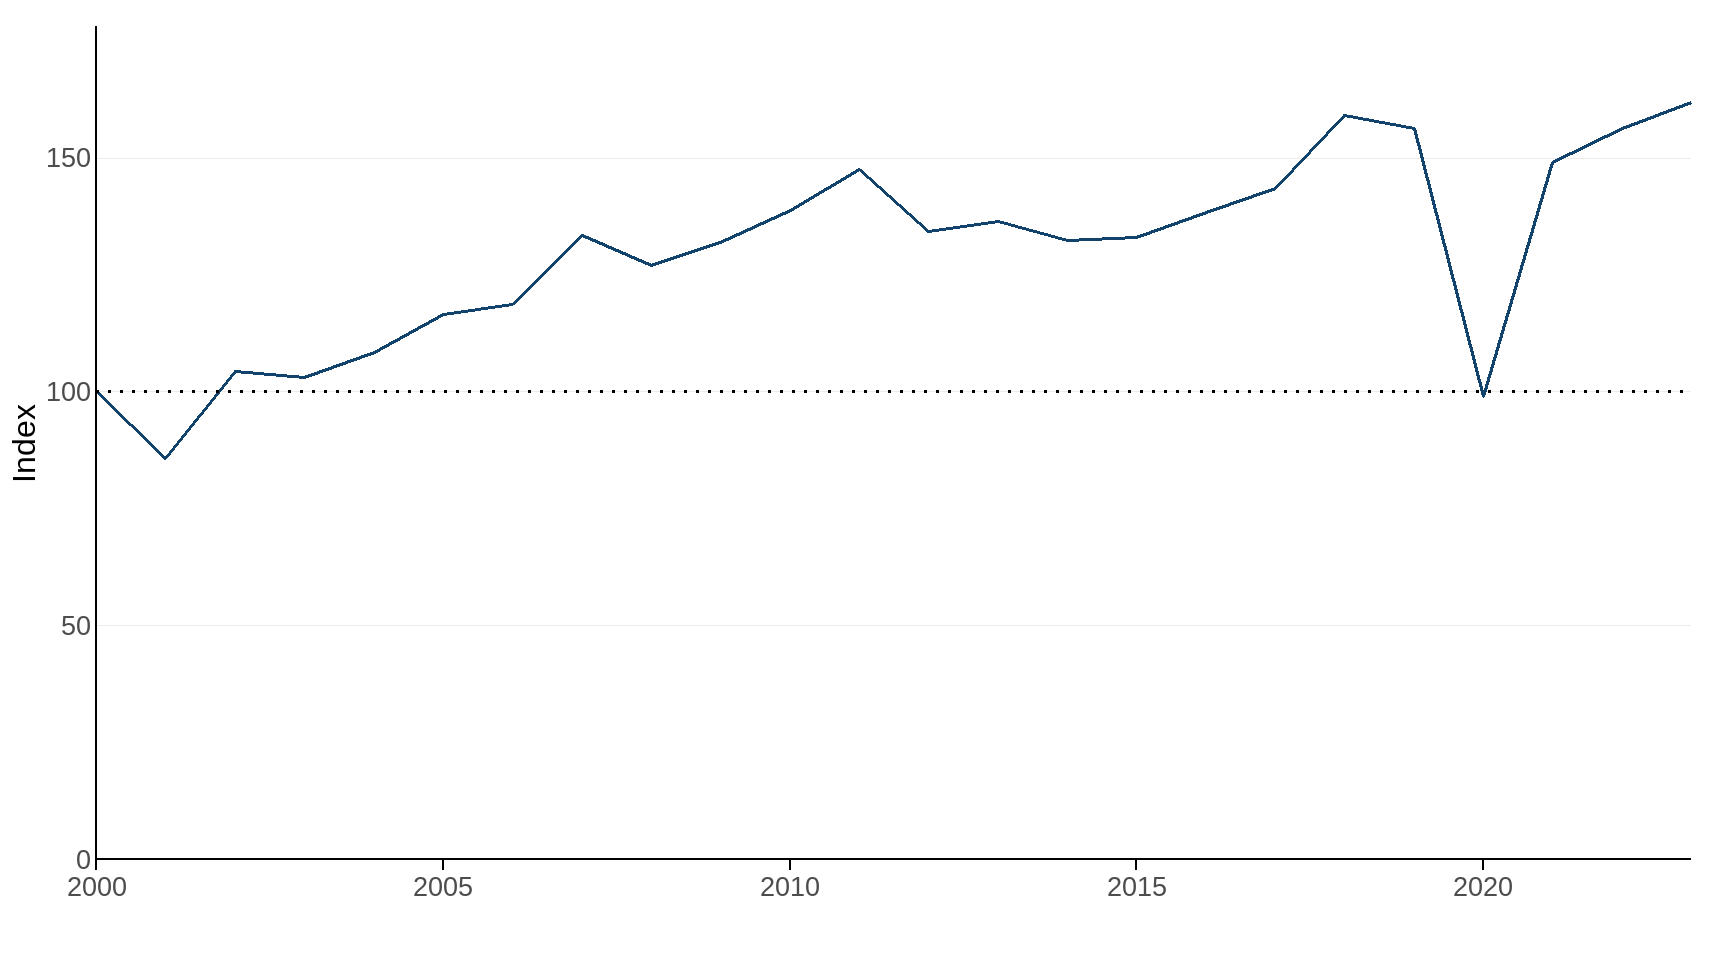
As indicated in Figure 1, between 2000 to 2023, the amount of time volunteers contributed to conservation activities in the UK increased by 62%. Between 2019 and 2020 volunteer hours had fallen substantially but started to increase again from 2021. In the most recent year available, volunteer hours increased by 4%.
The substantial decrease in volunteer time during 2020 can be attributed to the COVID-19 restrictions. Six of the thirteen organisations ceased volunteering entirely during this time, with the remaining organisations significantly reducing volunteer hours over the same period. Time spent volunteering began to increase in 2021 as restrictions eased.
Although the indicator has only increased by 2% in the five years since 2018, trends reported by individual organisations vary considerably. For instance, Natural England reported an increase in volunteer hours of 36% despite ceasing volunteering during 2020, whereas Pembrokeshire Coast National Park reported a decrease of just over 50% over the same period.
Figure 1: Index of volunteer time spent on conservation activities with selected environmental organisations in the UK, 2000 to 2023
Source: Bat Conservation Trust; British Trust for Ornithology; Butterfly Conservation; Canal & River Trust; The Conservation Volunteers; Loch Lomond & The Trossachs National Park Authority; Natural England; National Parks England; Pembrokeshire Coast National Park Authority; Plantlife; Royal Society for the Protection of Birds (RSPB); The Wildlife Trusts, Woodland Trust
Note about Figure 1
- The index is calculated using a non-weighted aggregation across organisations. It is therefore strongly dependent on the trends reported by the organisations recording large amounts for total volunteer hours.
- Historical data were not available for all organisations in all years. To make best use of available data and to allow a combined index to be compiled, interpolation estimates have been used to fill gaps. Further details are given in the background section.
- Data provided by the Canal & River Trust (formerly British Waterways); The Conservation Volunteers; Loch Lomond & The Trossachs National Park Authority; National Parks England; Natural England; Pembrokeshire Coast National Park Authority; RSPB and The Wildlife Trusts were for financial years rather than calendar years. Financial year data have been assigned to the first calendar year (e.g. 2019 to 2020 data were allocated to 2019).
- The Botanical Society of Britain and Ireland no longer contributes data to this indicator. As a result, trends from previous versions are not directly comparable with the current results.
Further detail
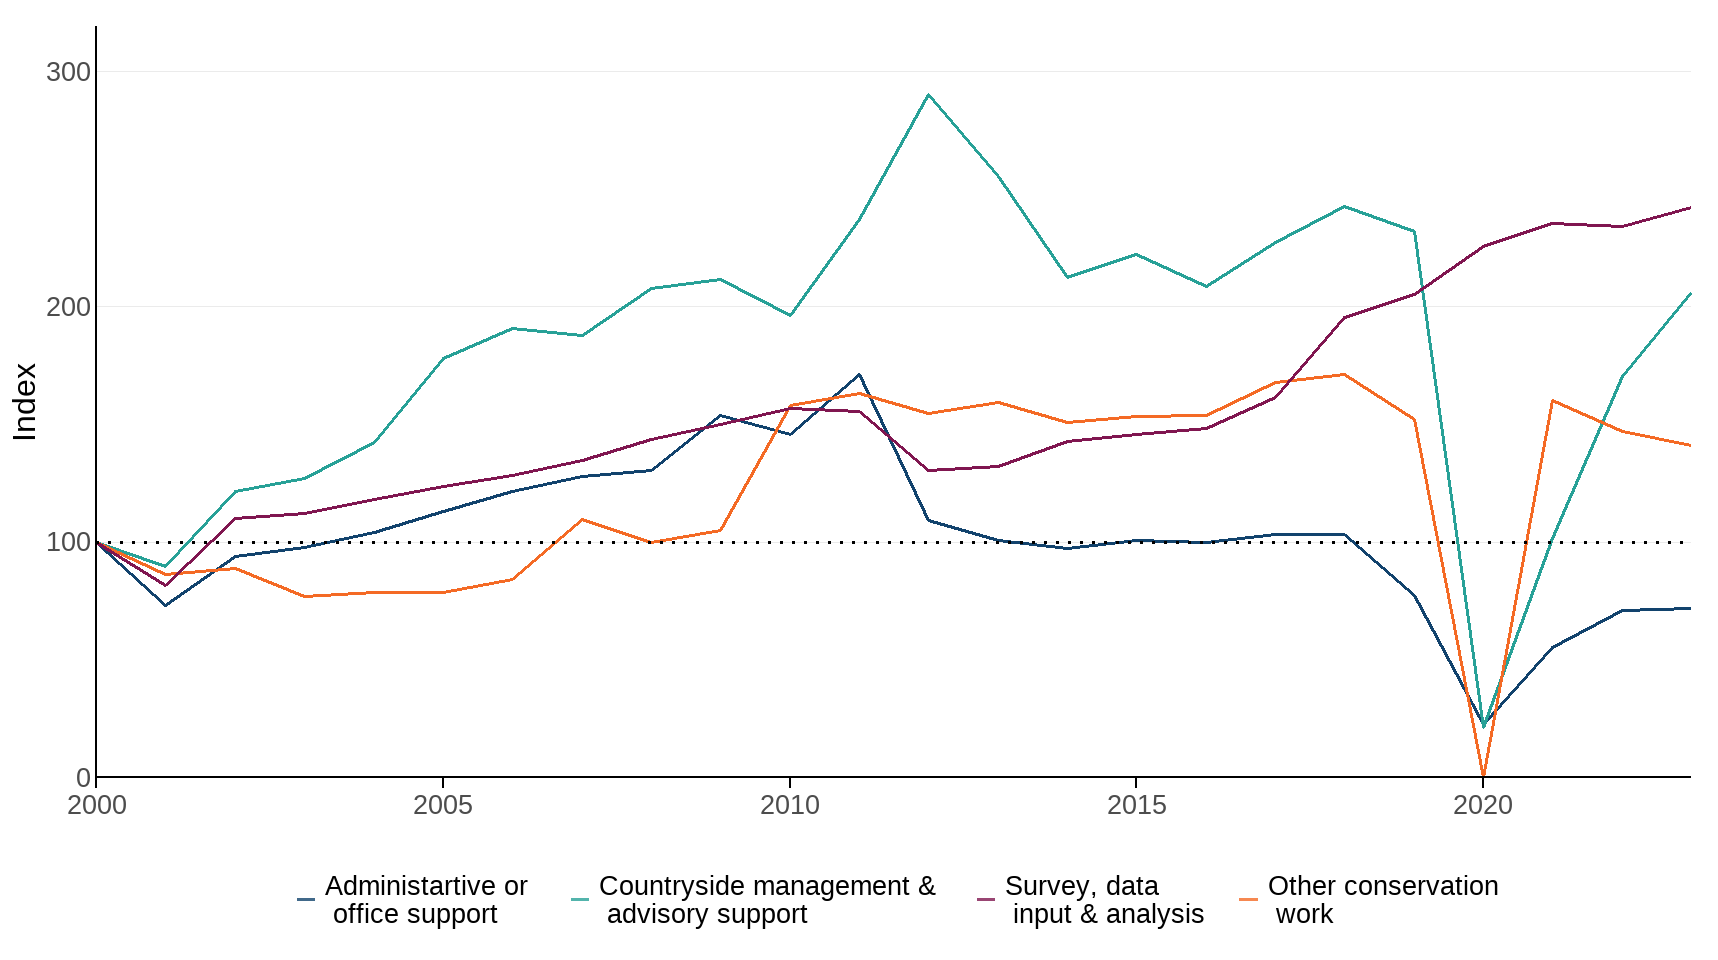
Some organisations provide a breakdown of volunteering hours (Figure 2). As not every organisation provides this breakdown, the trends shown in this figure are different from the overall assessment in Figure 1.
Figure 2: Index of volunteer time spent on conservation activities with selected environmental organisations in the UK, by category of work, 2000 to 2023
Source: Bat Conservation Trust; British Trust for Ornithology; Butterfly Conservation; Natural England; Plantlife; Royal Society for the Protection of Birds; Woodland Trust
Note about Figure 2
- The index is calculated using a non-weighted aggregation across organisations. It is therefore strongly dependent on the trends reported by the organisations recording large amounts for total volunteer hours.
- Historical data were not available for all organisations in all years. To make best use of available data and to allow a combined index to be compiled, interpolation estimates have been used to fill gaps. Further details are given in the background section.
- Data provided by the Canal & River Trust (formerly British Waterways); The Conservation Volunteers; Loch Lomond & The Trossachs National Park Authority; National Parks England; Natural England; Pembrokeshire Coast National Park Authority; RSPB and The Wildlife Trusts were for financial years rather than calendar years. Financial year data have been assigned to the first calendar year (e.g. 2019 to 2020 data were allocated to 2019).
- The Botanical Society of Britain and Ireland no longer contributes data to this indicator. As a result, trends from previous versions are not directly comparable with the current results.
For information on the methods used in this indicator, please see the technical annex.
Volunteer hours relating to ‘countryside management and advisory support’ and ‘Survey, data input and analysis’ categories have increased in 2023 (Figure 2). Over the last year there has been a slight decrease in volunteer hours relating to the ‘Other conservation work’ category whereas time spent volunteering on ‘Administration or office support’ has remained the same.
Due to COVID-19 restrictions there was a significant drop in volunteer hours in 2020 across all four work categories. All organisations, except Butterfly Conservation, ceased volunteering in ‘countryside management and advisory support’ and only one organisation, Bat Conservation Trust, reported volunteer hours in the ‘other conservation work’ category during this period. Three organisations, Bat Conservation Trust, British Trust for Ornithology and Butterfly Conservation, recorded hours in the ‘survey, data input and analysis’ during 2020. This can be explained by the option to undertake bat, bird and butterfly surveys locally, complying with COVID-19 restrictions, as well as the option for lone working. The same three organisations recorded volunteer hours in the ‘administrative or office support’ category while all other organisations ceased volunteering across all categories during this time.
The 2011 to 2013 peak in ‘countryside management & advisory support’ was driven by several organisations, most notably the RSPB and the Woodland Trust reporting a higher than average number of volunteer hours for this category. The sharp rise in hours relating to ‘other conservation work’ in 2010 was driven by the RSPB and the sharp fall in hours relating to ‘administrative or office support’ by the British Trust for Ornithology. The latter reporting an end to the ‘Bird Atlas Project’ as a reason for the decrease. Historically, organisations have reported that changes are due to shifts in strategic focus that result in significant adjustments to projects such as tree planting. They have also cited the need to consider changes to volunteer numbers in order to comply with health and safety regulations.
A decrease in time spent volunteering between 2000 and 2001 (Figure 1) can be attributed to a decline in all conservation activity due to controls on countryside access during the Foot and Mouth Disease outbreak. The small peak in volunteer time in 2007 was largely driven by an increase in volunteer numbers at The Conservation Volunteers which initiated a number of large youth programmes in that year. The 2011 high point, however, was driven by increases in the volunteer hours reported by nine of the 13 organisations in the indicator and the subsequent decrease in 2012 was due to a drop in the number of volunteers across seven of the organisations, most notably: the British Trust for Ornithology, The Wildlife Trusts, The Conservation Volunteers and the RSPB. The high point in 2018 is due to all organisations except one recording an increase in volunteer time. These changes reflect the cyclical nature of some projects undertaken, such as tree planting and work on specific nature reserves and the revised methodologies used to survey and record the number of volunteer hours.
Relevance
Volunteer time is one way of assessing the level of public engagement with biodiversity. Volunteering for conservation charities is critical to the successful delivery of many of the objectives of the country biodiversity and environment strategies – for example, volunteers collect much of the data used for monitoring the status of species and also undertake practical work to manage threatened habitats.
International/domestic reporting
The suite of UK Biodiversity Indicators has been revised and updated to bring it in line with the Kunming-Montreal Global Biodiversity Framework (GBF) of the Convention on Biological Diversity (CBD). Some UKBIs will be used for the forthcoming UK national reports to CBD.
Web links for further information
- Association of Inland Navigation Authorities Quantifying the extent and value of volunteering in relation to inland waterways (PDF, 508 kb))
- Bat Conservation Trust
- British Trust for Ornithology
- Butterfly Conservation
- Canal & River Trust
- The Conservation Volunteers
- Loch Lomond & The Trossachs National Park Authority
- Pembrokeshire Coast National Park Authority
- Plantlife
- National Parks England
- Natural England
- Royal Society for the Protection of Birds
- The Wildlife Trusts
- Woodland Trust
Acknowledgements
Thank you to the many people who have contributed by providing data, particularly the volunteers who make such a significant contribution to the time spent on nature conservation in the UK.
Technical annex
Methodology
Data on volunteer time spent in conservation is submitted annually by the organisations that are reported in this indicator. Data is either provided as number of volunteer hours per year, or number of volunteer days per year. Where data is submitted as volunteer days per year, each day is recorded as 7.5 hours of volunteer time. Some organisations have been able to provide accurate figures for the number of hours worked; others provided estimates based on the number of volunteers and an estimate of average days worked by their volunteers each year. For the analysis, the number of volunteer hours is converted to an index. The index is calculated using a non-weighted aggregation across organisations (set to 2000 = 100). The indicator also presents volunteer hours by category.
In broad terms, the type of work undertaken by volunteers falls into four categories:
- Countryside management & advisory support.
- Surveys, data input & analysis.
- Administrative or office support.
- ‘Other conservation work’, which includes activities such as fundraising, training and educational events.
Not every organisation provides the breakdown of volunteering hours shown in Figure 2, and therefore the trends shown in this figure are different from the overall assessment in Figure 1. For the organisations that did return data, some were able to provide accurate figures for the number of hours worked; others provided estimates based on the number of volunteers and an estimate of average days worked by their volunteers each year.
Data are not available for all organisations in all years. For the current indicator, missing values have been estimated by Defra statisticians. In the historical dataset estimates have been used in the index calculations for the Canal & River Trust (formerly British Waterways) (2000 to 2009), Butterfly Conservation (2000 to 2002, 2021 to 2022), The Conservation Volunteers (2000 to 2005), Loch Lomond & The Trossachs National Park Authority (2000, 2001 and 2003), National Parks England (2000 to 2008), Natural England (2000 and 2002), Plantlife (2000 to 2006), The Wildlife Trusts (2000 to 2003 and 2006), and the Woodland Trust (2000,2001, 2017 and 2018). The estimates were based on (a) the trend in the data provided by the organisation, and (b) the trend in the data provided by other organisations for the missing years.
Data provided by Butterfly Conservation for 2021, 2022 and 2023 does not include the full volunteer hours from the Butterflies for the New Millennium recording scheme and the National Moth recording scheme. These data are still being processed by Butterfly Conservation. Interpolation estimates, based on the 2020 volunteer data, have been used to fill these gaps. These figures will be updated when these data become available.
The methodology used by conservation charities can change from year to year. This can cause fluctuations in the data, particularly where there are revised methods used by charities that have previously recorded large amounts for total volunteer hours. In 2014, The Wildlife Trusts improved their methodology to more accurately record volunteer hours and to only report activities undertaken by registered volunteers, rather than those undertaken by registered and casual volunteers. This resulted in a 40% drop in recorded hours for that year. As The Wildlife Trusts accounted for 20% of the total number of volunteer hours in 2014, this change had a noticeable effect on the overall trend and it was largely responsible for the significant fall in the indicator from 2013 to 2014 that has been reported in previous publications. It also had a negative impact on the short-term assessments of this indicator reported in 2016 and 2017. Rather than continuing to allow this methodological change to adversely affect the results, when the actual fall in volunteer hours was much smaller than that previously reported, Defra statisticians obtained additional information from The Wildlife Trusts. This information has been used to scale the data from 2000 to 2013 in such a way that it now provides estimates for volunteering that are broadly equivalent to those provided under the new methodology. While the chart, values and accompanying datasheet are therefore not comparable to those in previous publications, they do present a clearer trend for conservation volunteering in the UK since 2000. In addition, Butterfly Conservation are working to improve their methodology for calculating hours spent on survey work due to a shift over the past 5+ years in how volunteers record butterflies (largely driven by the introduction of recording apps). The number of volunteers recording butterflies has continued to increase but the calculation of hours needs revision, which will likely result in a decrease in total volunteer hours.
Background
The indicator is based on data on volunteer hours supplied by 13 conservation charities and public bodies operating in the UK:
- Bat Conservation Trust.
- British Trust for Ornithology.
- Butterfly Conservation.
- Canal & River Trust.
- The Conservation Volunteers.
- Loch Lomond & The Trossachs National Park Authority.
- National Parks England (National Park data for England are now collected through the National Parks England Head Office, rather than by contacting individual National Parks directly).
- Natural England.
- Pembrokeshire Coast National Park Authority.
- Plantlife.
- Royal Society for the Protection of Birds.
- The Wildlife Trusts.
- Woodland Trust.
National Park data for England is now collected through the National Parks England Head Office, rather than by contacting individual National Parks directly.
Table 1 provides information on whether the organisations contributing to the indicator provided data for the whole or part of the United Kingdom (UK) or Great Britain (GB) (England, Scotland and Wales).
Table 1. Organisations contributing data to the indicator
Assessment of change in volunteer time spent in conservation.
| Providing UK or GB wide data | Providing data for part of the UK |
|---|---|
| Bat Conservation Trust | Canal & River Trust |
| British Trust for Ornithology | National Parks England |
| Butterfly Conservation | Natural England |
| The Conservation Volunteers | Pembrokeshire Coast National Park Authority |
| Plantlife | Loch Lomond & The Trossochs National Park Authority |
| The Royal Society for the Protection of Birds | |
| The Wildlife Trusts | |
| Woodland Trust |
Development plan
Since our previous publication we have adapted the language and visualisations used in this indicator. We are keen to hear from our users about these changes, as well as our published development plan, please email us.
Categories:
Published: