Global biodiversity impacts of UK economic activity / sustainable consumption
Last updated: 2025, with corrections made to the water data in March 2026
Latest data available: 2023
Introduction
This indicator estimates the global environmental impacts of UK consumption of agricultural crop commodities (and additionally for some metrics, cattle-related and timber commodities), between 2005 and 2023.
Data for this indicator can be found in the published datafile.
Type of indicator
Pressure indicator
Type of official statistics
Official statistic
Contents
- Assessment of change
-
Key results
- Figure 1: Area of deforestation worldwide associated with UK consumption annually, 2005 to 2023
- Biodiversity loss
- Figure 2: LIFE (Land cover change Impacts on Future Extinctions) score worldwide associated with UK consumption of crop commodities annually, 2005 to 2023
- Predicted regional species loss
- Figure 3: Predicted regional species loss (global total) associated with UK consumption annually, 2005 to 2023
- Species richness-weighted crop area
- Figure 4: Species richness-weighted crop area worldwide associated with UK consumption annually, 2005 to 2023
- Carbon dioxide (CO2) emissions related to deforestation
- Figure 5: Deforestation emissions (including peat drainage) worldwide associated with UK consumption annually, 2005 to 2023
- Water consumption and scarcity-weighted water footprint
- Figure 6: Scarcity-weighted blue water use equivalent worldwide associated with UK consumption annually, 2005 to 2023
- Cropland area harvested
- Figure 7: Cropland area harvested (land use footprint for crop commodities) worldwide associated with UK consumption annually, 2005 to 2023
- Material consumption (tonnes of biomass production)
- Figure 8: Crop production (biomass) worldwide associated with UK consumption annually, 2005 to 2023
- Further detail
- Acknowledgements
- Technical annex
- References
Assessment of change
Area of deforestation worldwide associated with UK consumption.
| Measure | Assessment | Time period | Result |
|---|---|---|---|
| Area of deforestation | Long term | 2005 to 2023 | Improving |
| Area of deforestation | Short term | 2018 to 2023 | Improving |
Notes on the indicator assessment
Long- and short-term assessments are based on a 3% rule of thumb. Where possible, the base years for these assessments use a three-year average. See Assessing Indicators. The assessment of change method for this indicator is being kept under review.
Key results
Impacts considered in this indicator include:
- Deforestation (headline result)
- Biodiversity loss
- Carbon dioxide (CO2) emissions related to deforestation
- Water consumption and scarcity-weighted water footprint
- Cropland area harvested
- Material consumption (tonnes of biomass production)
Results shown here are for total UK consumption of agricultural crop commodities (such as wheat, soy, palm oil), and additionally for some metrics, cattle-related (such as beef, leather) and timber commodities (such as wooden furniture). The underlying dataset (see technical documentation and accompanying datafile) also breaks this down by the commodity responsible for the impact, and the production countries and territories in which the impacts take place. The production countries and territories included align with those reported by the Food and Agriculture Organisation of the United Nations (FAO). The indicator includes impacts of UK consumption of commodities produced both domestically and overseas.
The breakdown of results for each impact (as well as data for nations beyond the UK) can also be visualised through an external dashboard as the GEIC (Global Environmental Impacts of Consumption) indicator.
The entire time series for all aspects of this indicator have been recalculated in this data release, to ensure consistency across the time series following updates to underlying data sources, including the FAO data. The underlying MRIO (multi-regional input-output) data comes from GLORIA (Global Resource Input-Output Assessment) in this year’s release (EXIOBASE data were used in the 2024 release).
Annual UK consumption of crops, cattle-related commodities and timber in 2023 (the latest year for which data are available) was associated with an estimated 29 thousand hectares of agriculture-driven deforestation worldwide (Figure 1). This is compared with 65 thousand ha in 2005, which was when the time series began, and 48 thousand ha in 2018.
Figure 1: Area of deforestation worldwide associated with UK consumption annually, 2005 to 2023
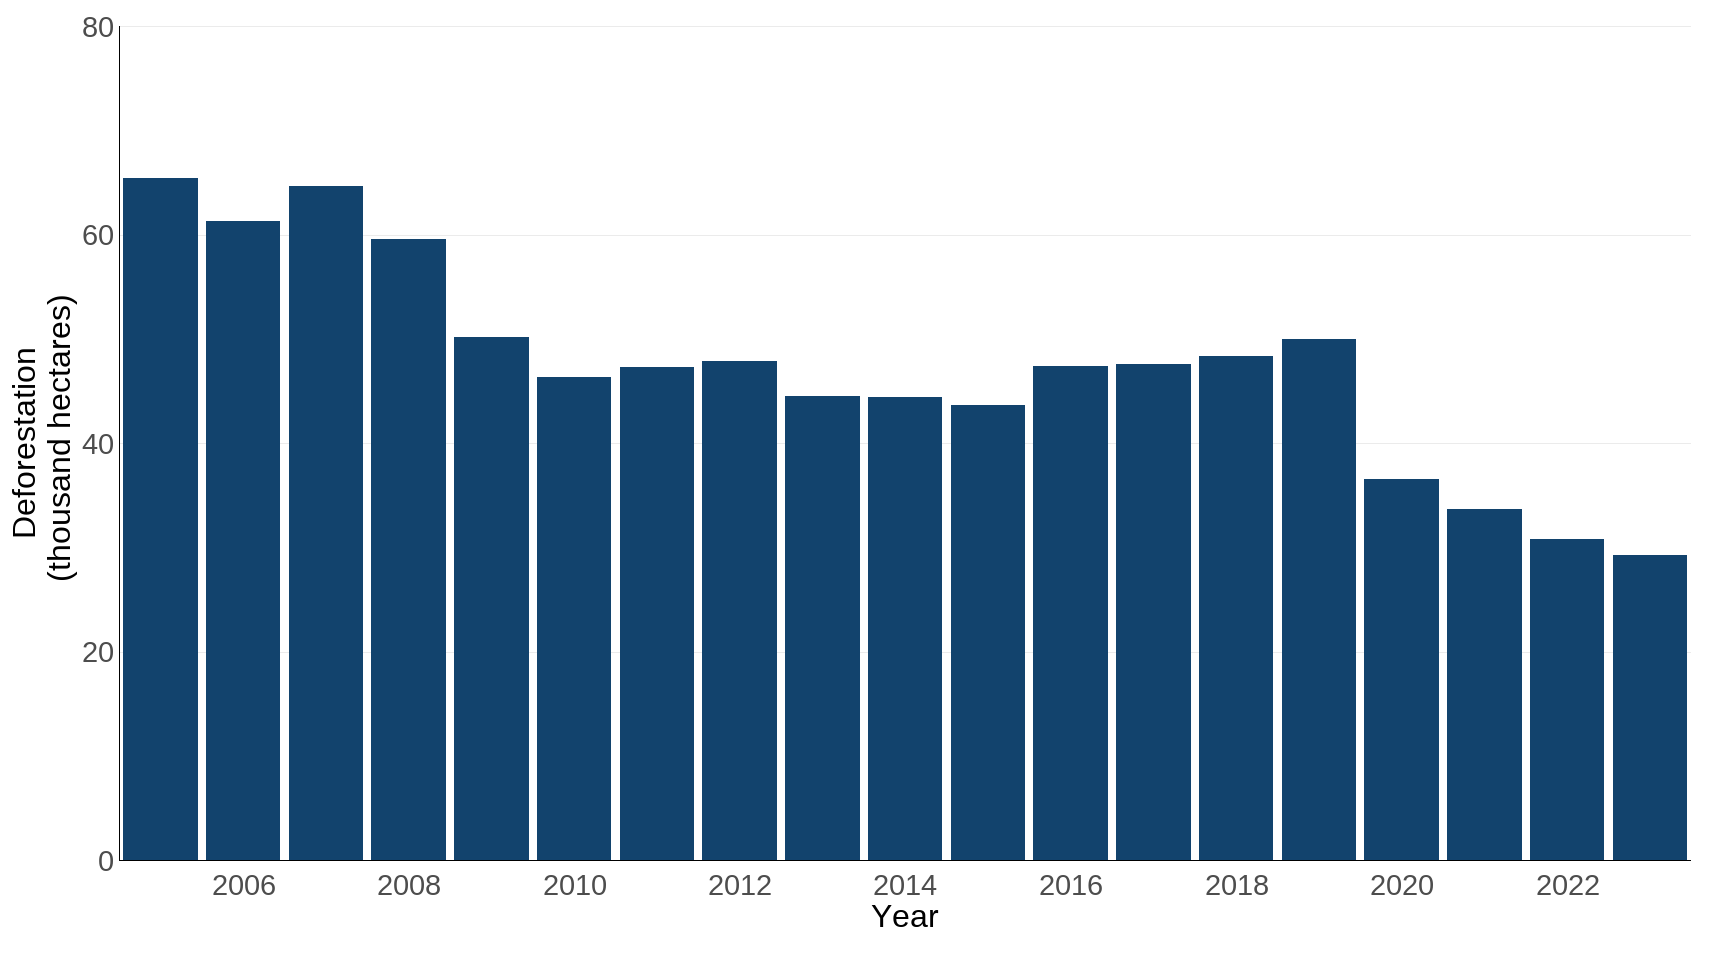
Source: Calculated via the IOTA (Input Output Trade Analysis) framework (Croft et al., 2018, 2025) using data from GLORIA; the Food and Agriculture Organisation of the United Nations; and a dataset based on Singh & Persson (2024) (data incorporated into this release of the indicator were supplied directly by the authors of this research)
Notes about Figure 1
- Estimates are for crop, cattle-related, and timber commodities only.
- Deforestation refers to conversion of natural forest to any commodity production related land use (including plantation forestry). Felling and replanting of tree areas that are already plantation forests is not considered deforestation.
- Note that the entire time series has been recalculated compared to the previous data release, to ensure consistency across the time series following updates to underlying data sources. This includes the FAO time series data, which is often updated with corrections or additions, and so the most recent version is downloaded for use each year. The underlying MRIO (multi-regional input-output) data comes from GLORIA (Global Resource Input-Output Assessment) in this year’s release (EXIOBASE data were used in the 2024 release). See the technical documentation for further information.
- Note that the quality scores of the underpinning deforestation data tend to be lower for more recent years. Confidence is typically higher for less recent data, given the availability of better data historically.
In addition to the headline metric on deforestation presented above, footprints have also been calculated for biodiversity loss, deforestation-related CO2 emissions, scarcity-weighted water footprint, land use footprint (hectares per commodity) and material footprint (tonnes per commodity). Further graphs (including footprint per tonne of commodity consumption for each metric) can be found in Appendix 1 of the JNCC technical documentation. Additional breakdowns of commodities and producing countries and territories can be visualised using the associated dashboard.
Biodiversity loss
LIFE metric
The LIFE (Land-cover change Impacts on Future Extinctions) score is a metric that provides an estimate of the probability of extinction across about 30,000 terrestrial vertebrate species, using changes in their modelled area of habitat since pre-industrial times. The impact of changes in area of habitat are related to the proportion that has been already lost, so that per unit area losses in habitat will have the greatest impacts on extinction risk for those species which have faced the greatest losses of habitat. The metric provides an estimate of the number of species committed to extinction over approximately 100 years. A score of 1 is equivalent to one global extinction. Consequently, results show the sum of the UK’s contribution to global extinctions across all the world as a result of UK consumption of crop commodities. Annual UK consumption of crop commodities in 2023 was associated with an estimated ‘LIFE score’ (species extinctions within 100 years) of 3.3 (Figure 2), compared with LIFE scores of 5.1 in 2005 and 3.7 in 2018.
Figure 2: LIFE (Land cover change Impacts on Future Extinctions) score worldwide associated with UK consumption of crop commodities annually, 2005 to 2023

Source: Calculated based on the methods for producing the LIFE score of Eyres et al. (2025) and application within the IOTA (Input Output Trade Analysis) framework (Croft et al., 2018, 2025) using data from GLORIA; the Food and Agriculture Organisation of the United Nations; MAPSPAM; Birdlife International; and the IUCN
Notes about Figure 2
- Estimates are for crop commodities only.
- Note that the entire time series has been recalculated compared to the previous data release, to ensure consistency across the time series following updates to underlying data sources (see notes about Figure 1 for further detail).
Predicted regional species loss
Predicted regional species loss represents the number of species predicted to be committed to extinction within each ecoregion (summed to give a global total, i.e. the same species can go extinct in n regions and have a score of n) if current consumption and land use patterns continue. Annual UK consumption of crop commodities in 2023 was associated with a predicted regional species loss of approximately 61 species (Figure 3). This is compared to 79 species in 2005 and 68 species in 2018.
Figure 3: Predicted regional species loss (global total) associated with UK consumption annually, 2005 to 2023
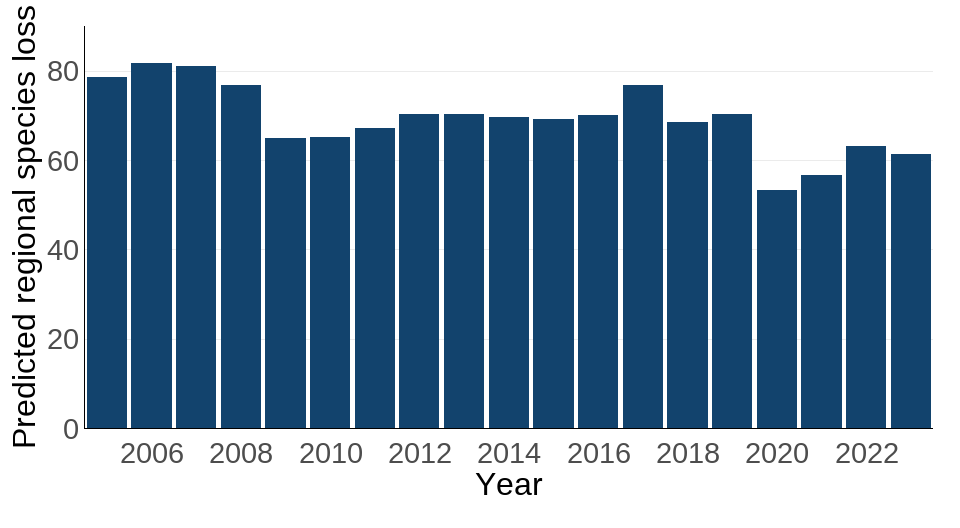
Source: Calculated via the IOTA (Input Output Trade Analysis) framework (Croft et al., 2018, 2025) using data from GLORIA; the Food and Agriculture Organisation of the United Nations; and Chaudhary and Kastner (2016)
Notes about Figure 3
- Estimates are for crop commodities only.
- Predicted regional species loss is defined as the number of species predicted to become extinct if current conditions continue, per ecoregion.
- Note that the entire time series has been recalculated compared to the previous data release, to ensure consistency across the time series following updates to underlying data sources (see notes about Figure 1 for further detail).
Species richness-weighted crop area
Species richness-weighted hectares represent the hectares of crop production multiplied by the number of species present in that hectare, therefore showing where there is potential overlap between production and areas of general biodiversity importance. Annual UK consumption of crop commodities in 2023 was associated with an estimated 5.4 billion species richness-weighted hectares of land use worldwide (Figure 4). This compares with 6.9 billion species richness-weighted ha in 2005 and 5.8 billion species richness-weighted ha in 2018.
Figure 4: Species richness-weighted crop area worldwide associated with UK consumption annually, 2005 to 2023
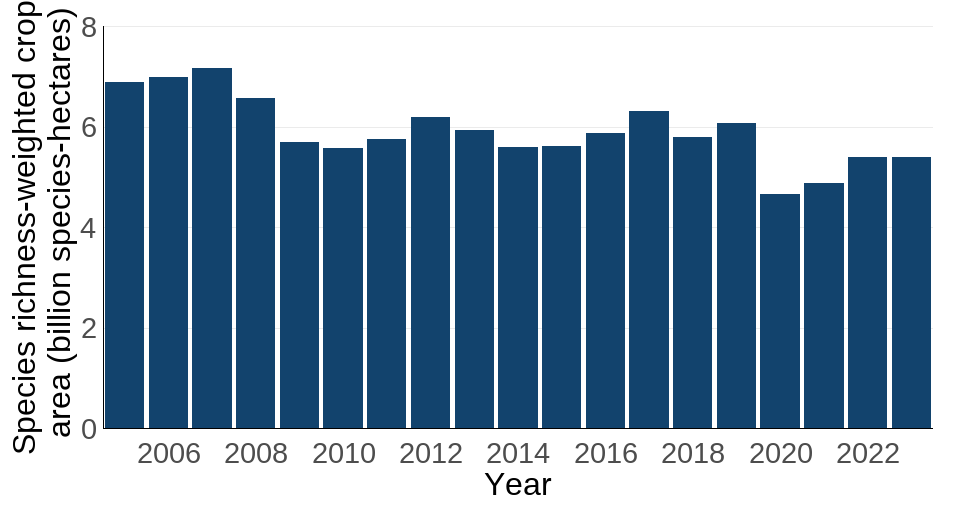
Source: Calculated via application within the IOTA (Input Output Trade Analysis) framework (Croft et al., 2018, 2025) using data from GLORIA; the Food and Agriculture Organisation of the United Nations; MAPSPAM; Birdlife International; and the IUCN
Notes about Figure 4
- Estimates are for crop commodities only.
- As species-hectares represent the hectares of crop production multiplied by the number of species present, the total species-hectares can be significantly more than the total physical hectares, as each hectare of crop overlaps with many species ranges.
- Note that the entire time series has been recalculated compared to the previous data release, to ensure consistency across the time series following updates to underlying data sources (see notes about Figure 1 for further detail).
Carbon dioxide (CO2) emissions related to deforestation
Annual UK consumption of crop, cattle-related and timber commodities in 2023 was associated with an estimated 9.4 million tonnes of CO2 emissions linked to deforestation worldwide, including peat drainage (Figure 5). This compares with 22.2 million tonnes of CO2 emissions in 2005 and 15.3 million tonnes of CO2 emissions in 2018.
Figure 5: Deforestation emissions (including peat drainage) worldwide associated with UK consumption annually, 2005 to 2023
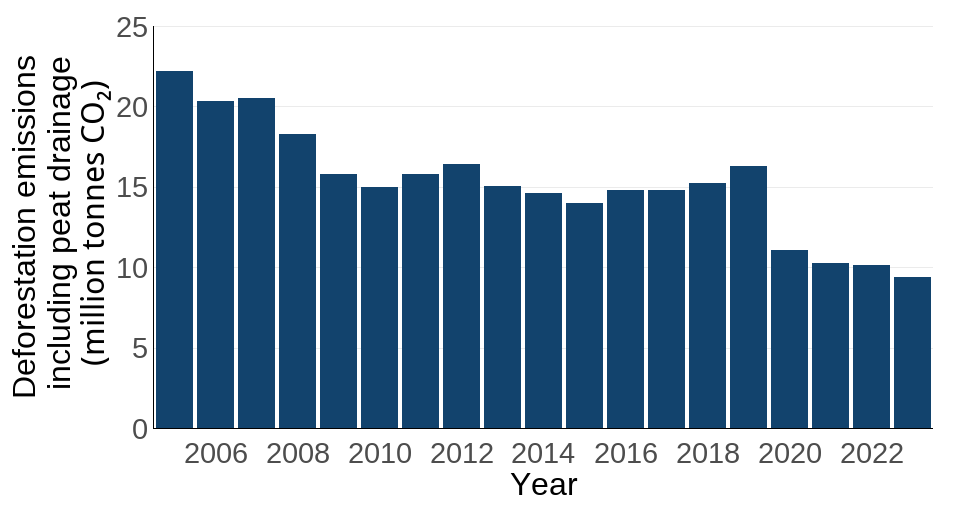
Source: Calculated via the IOTA (Input Output Trade Analysis) framework (Croft et al., 2018, 2025) using data from GLORIA; the Food and Agriculture Organisation of the United Nations; and a dataset based on Singh & Persson (2024) (data incorporated into this release of the indicator were supplied directly by the authors of this research)
Notes about Figure 5
- Estimates are for crop, cattle-related and timber commodities only.
- Deforestation refers to conversion of natural forest to any commodity production related land use (including plantation forestry). Felling and replanting of tree areas that are already plantation forests is not considered deforestation.
- Note that the entire time series has been recalculated compared to the previous data release, to ensure consistency across the time series following updates to underlying data sources (see notes about Figure 1 for further detail).
- Note that the quality scores of the underpinning deforestation data tend to be lower for more recent years. Confidence is typically higher for less recent data, given the availability of better data historically.
Water consumption and scarcity-weighted water footprint
The surface and groundwater consumed as a result of production (the ‘blue water footprint’) has been multiplied by a weighting factor representing the availability of water regionally after human and aquatic ecosystem demands have been met to estimate ‘scarcity-weighted blue water use’. Annual UK consumption of crop commodities in 2023 was associated with an estimated 275 billion cubic metres of scarcity-weighted blue water use worldwide (Figure 6). This is compared with 466 billion cubic metres in 2005 and 333 billion cubic metres in 2018. As geographic location of impact is particularly relevant for this metric, users are reminded that they are able to view breakdowns of the results via the associated dashboard.
As with the other metrics in this indicator, the entire time series has been recalculated. Importantly, the MRIO model used now has higher country/regional resolution in comparison with the previous model. This allows flows between areas to be accounted for with greater resolution and reduces dependency on ‘mass balance’ based flows from aggregated regions. Several areas with high water-scarcity-weighted blue water use intensity were bundled within aggregated regions within the prior release’s MRIO account, and are now disaggregated. This has resulted in a substantial difference in the material flow estimates from these origins linked to UK consumption, and resultant substantial changes in the values for water-scarcity-weighted blue water use compared to the previous release.
Figure 6: Scarcity-weighted blue water use equivalent worldwide associated with UK consumption annually, 2005 to 2023
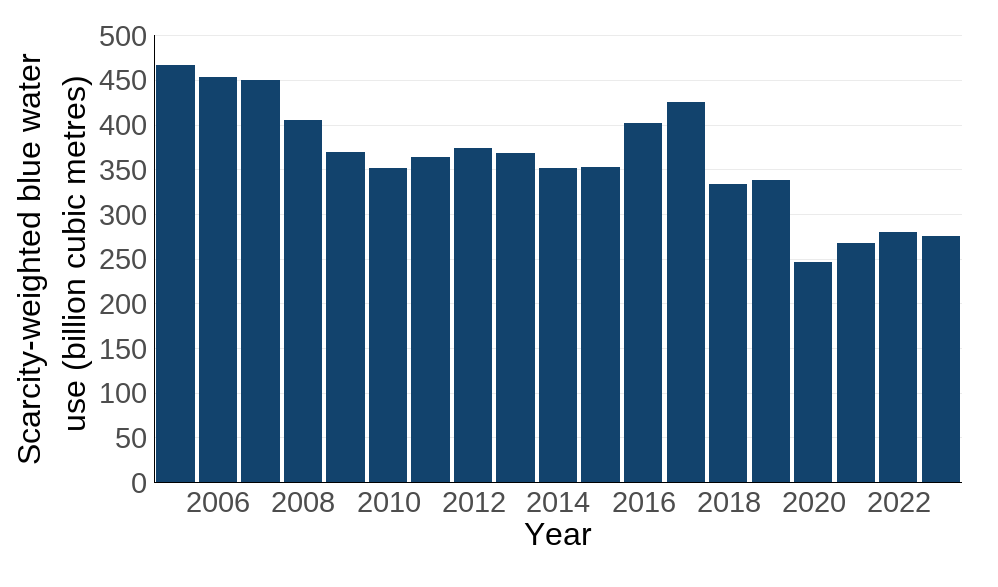
Source: Calculated via the IOTA (Input Output Trade Analysis) framework (Croft et al., 2018, 2025) using data from GLORIA; the Food and Agriculture Organisation of the United Nations; the Water Footprint Network; and Boulay et al. (2018)
Notes about Figure 6
- Estimates are for crop commodities only.
- Note that the entire time series has been recalculated compared to the previous data release, to ensure consistency across the time series following updates to underlying data sources (see notes about Figure 1 for further detail).
Cropland area harvested
Annual UK consumption of crop commodities in 2023 was associated with an estimated total land use footprint of 16.0 million hectares worldwide (Figure 7). This compares with 20.4 million ha in 2005 and 17.5 million ha in 2018.
Figure 7: Cropland area harvested (land use footprint for crop commodities) worldwide associated with UK consumption annually, 2005 to 2023
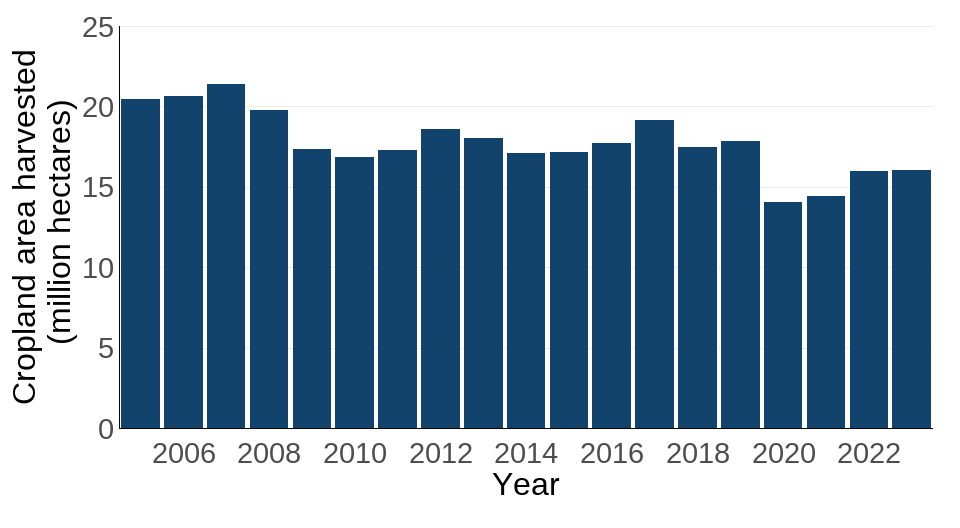
Source: Calculated via the IOTA (Input Output Trade Analysis) framework (Croft et al., 2018, 2025) using data from GLORIA; and the Food and Agriculture Organisation of the United Nations
Notes about Figure 7
- Estimates are for crop commodities only.
- Note that the entire time series has been recalculated compared to the previous data release, to ensure consistency across the time series following updates to underlying data sources (see notes about Figure 1 for further detail).
Material consumption (tonnes of biomass production)
Annual UK consumption of crop, cattle-related, and timber commodities in 2023 was responsible for an estimated 134.7 million tonnes of material (biomass) production worldwide (Figure 8). This compares with 164.5 million tonnes in 2005 and 143.5 million tonnes in 2018.
Figure 8: Crop production (biomass) worldwide associated with UK consumption annually, 2005 to 2023
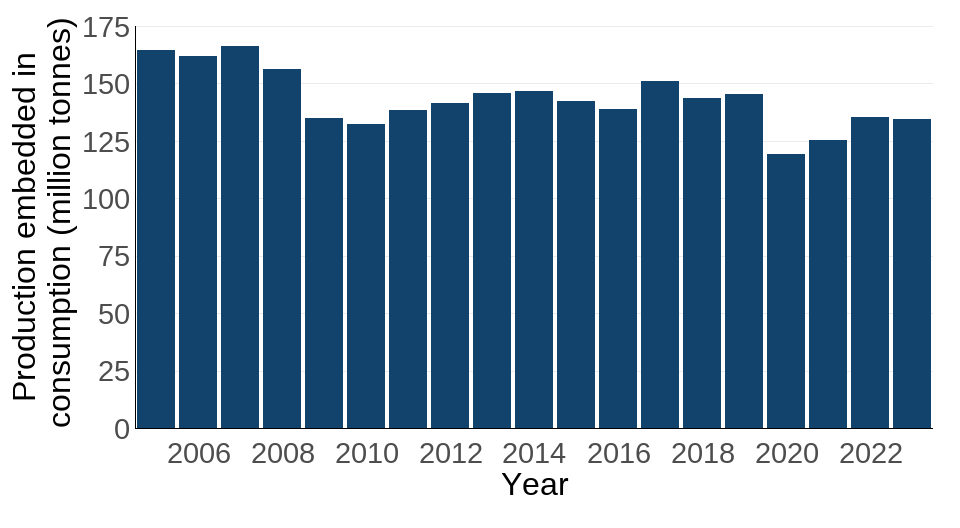
Source: Calculated via the IOTA (Input Output Trade Analysis) framework (Croft et al., 2018, 2025) using data from GLORIA; and the Food and Agriculture Organisation of the United Nations
Notes about Figure 8
- Estimates are for crop, cattle-related and timber commodities only.
- Note that the entire time series has been recalculated compared to the previous data release, to ensure consistency across the time series following updates to underlying data sources (see notes about Figure 1 for further detail).
Further detail
Details on methods are provided in the Technical annex below and in the technical documentation. This indicator was calculated by the Stockholm Environment Institute under a project managed by the Joint Nature Conservation Committee (JNCC) and contracted by the Department for Environment Food and Rural Affairs (Defra) to develop an indicator for the 25 Year Environment Plan (25YEP) Outcome Indicator Framework. It builds on data from a variety of sources, including the GLORIA (Global Resource Input-Output Assessment) trade model, Chalmers University of Technology (based on Singh & Persson, 2024, with data supplied directly by the authors for this indicator release), the Food and Agriculture Organisation of the United Nations, UN Comtrade, the Water Footprint Network, the Water Use in Life Cycle Assessment (WULCA) (Boulay et al., 2018), ETH Zurich and the Institute of Social Ecology Vienna (Chaudhary and Kastner, 2016), BirdLife International, the IUCN, Ball et al. (2025) and Eyres et al. (2025). It also builds on previous work including a proof of concept study which recommended multi-regional input-output (MRIO) modelling as the approach to use for this indicator (Route2 Sustainability & Carbon Smart, 2019) and a separate study investigating an alternative approach which was not recommended to be taken forward (Harris et al., 2019; both of these studies are available on the Defra Science and Research Projects website).
For those wishing to learn more, see the outputs linked to on JNCC’s sustainable consumption webpage.
Relevance
The Government’s 25 Year Environment Plan (25YEP) and its first revision, the Environmental Improvement Plan 2023, recognise the need to measure the environmental risks and impacts associated with UK consumption.
International/domestic reporting
This indicator also feeds into the Environmental Indicator Framework (previously known as the Outcome Indicator Framework), a set of indicators describing environmental change related to the ten goals within the Environmental Improvement Plan. As part of the Environmental Indicator Framework, this data contributes towards the evidence base used to prepare the annual progress report for the Environmental Improvement Plan. This indicator contributes to indicator K1: Global environmental impacts of UK consumption of key commodities.
The suite of UK Biodiversity Indicators has been revised and updated to bring it in line with the Kunming-Montreal Global Biodiversity Framework (GBF) of the Convention on Biological Diversity (CBD). Some UKBIs will be used for the forthcoming UK national reports to CBD.
Web links for further information
- Global Environmental Impacts of Consumption dashboard
- Environmental Improvement Plan
- ‘A Green Future: Our 25 Year Plan to Improve the Environment’
- Official Statistics UK Carbon Footprint
- Official Statistics UK Material Footprint
- GLORIA (Global Resource Input-Output Assessment) trade model
- EXIOBASE (NTNU University of Science and Technology)
- Global Trade Analysis Project (GTAP)
- Food and Agriculture Organisation of the United Nations (FAO)
- UN Comtrade webpage
- Bird species distribution maps of the world Version 2020.1
- The IUCN Red List of Threatened Species
- MapSPAM
- UKRI Trade Hub
- Water Footprint Network
- Water Use in Life Cycle Assessment (WULCA) – Download AWARE Factors
Acknowledgements
Thank you to the many people who have contributed by providing data and to the many colleagues who have helped produce this indicator. In particular, we thank Florence Pendrill, Chandrakant Singh, and Martin Persson at the University of Chalmers, Sweden. We also particularly thank Tom Ball and Alison Eyres from the University of Cambridge, UK for use of their data – including provision of their latest datasets - and for their responses to our technical enquiries. Thanks also to Thomas Kastner at the Senckenberg Research Institute and Michael Lathuillière at the Stockholm Environment Institute for technical advice and guidance, and to Amanda Otley for support on an earlier version of the data. Aspects of technical development and scoping work were also supported by the UKRI Global Challenges Research Fund Trade, Development and the Environment (TRADE) Hub, with the Dashboard development also supported by Trase (with thanks especially to Bernardo Loureiro). Environmental metrics prepared as part of this work are in turn primarily based on the research and data sets of third-parties. References for these resources are contained within the text, and we thank the authors for ensuring that they are available for use in this project.
Technical annex
Methodology
The full methodology for this indicator can be found in the technical documentation. This indicator was previously published as an Official Statistic in Development to facilitate user involvement in its development – information on how the underlying data have been obtained, how the indicator has been prepared, and methodological changes since its original publication in 2021, are available in the technical documentation.
The indicator is based on multi-regional input-output (MRIO) modelling. MRIOs model global trade flows representing the monetary inputs and outputs across different countries and territories and their commercial sectors (for example, oilseeds, cattle farming, and paddy rice). In previous indicator releases, EXIOBASE 3.8.1 MRIO was the underlying data model. However, currently EXIOBASE’s time series only runs to 2022. Therefore, in order to provide an updated time series for the indicator, in the 2025 release we have for the first time utilised GLORIA as the underlying economic model, which provides results to 2028 (later years being projections). Further, GLORIA has higher geographic resolution than EXIOBASE; it contains more individual countries, which not only allows more individual countries to explore their consumption-based impacts, but also improves the resolution with which country-to-country supply chain paths are represented in the modelling framework. The GLORIA dataset has an annual timeseries allowing year-to-year changes in consumption and impacts to be estimated. Separate results based on EXIOBASE and Global Trade Analysis Project (GTAP) (which have different geographic and sectoral resolutions to GLORIA) are available to download from the dashboard for those interested, but these do not form part of the UKBI.
The MRIO data are hybridised (linked) with physical data (tonnes of each commodity) from the FAO and, in the case of timber, UN Comtrade, using the Stockholm Environment Institute’s IOTA (Input Output Trade Analysis) model (Croft et al., 2018). This step allows for a higher resolution breakdown of commodities (for example, palm oil and soybeans, instead of just oilseeds) and of countries and territories of origin than MRIO data would provide alone. This step also allows trade – in physical units – at a commodity level to be included before these data are integrated within the sector-level MRIO framework. This gives results at a greater level of product-specificity, and accuracy, than a standalone MRIO-based account. The FAO Statistics were chosen for use because they are a comprehensive set of global production statistics, collected from official national statistics of each country and territory, which can be easily incorporated into the modelling framework. For timber, UN Comtrade data were used instead due to the discontinuation of FAO timber trade data. The modelling framework allows for an estimation of the country or territory of origin of a commodity, accounting for cases where commodities are embedded within other products as an ingredient or input, and cases where commodities are re-exported through multiple countries or territories before the point of consumption in the UK.
To determine deforestation rates and carbon dioxide (CO2) emissions from deforestation, data from Chalmers University of Technology which link deforestation and commodity production (based on Singh & Persson, 2024, with data supplied directly by the authors for this indicator release) are used to proportionally attribute UK deforestation impacts based on the volumes of each commodity the UK consumes within each production country or territory. For example, if the dataset based on Singh & Persson (2024) links x hectares of deforestation in a given country or territory with the production of a particular commodity, and the UK consumes y% of that commodity, then it is assumed that the UK is responsible for y% of those x hectares. This deforestation dataset was selected as it provides data on deforestation and its associated agricultural commodity drivers, with comprehensive coverage. Positive change (an improvement) would likely be represented by a reduction in deforestation rates and CO2 emissions from deforestation but would need to be interpreted alongside additional information (such as remaining forest area, deforestation per tonne of production, and understanding of the drivers behind the change) for a robust assessment.
Although in the 2021 and 2022 releases of this indicator only tropical and subtropical deforestation were reported, the estimates for area of deforestation in this indicator now refer to deforestation taking place globally, including in temperate and boreal regions.
To estimate biodiversity loss, three separate methods are utilised. The first method, the LIFE score, is based on data and methods from Eyres et al. (2025) and, Ball et al. (2025). It provides quantitative estimates of the marginal changes in the expected number of extinctions (both increases and decreases) across about 30,000 terrestrial vertebrate species, using changes in their modelled area of habitat in the absence of human activity. This approach integrates information on species richness, endemism, and past habitat loss to estimate the impact of land cover change on extinctions. Positive change would be represented by a decrease in the total expected number of global extinctions linked to UK consumption. The second method uses crop-specific and country and territory-specific characterisation factors, provided by Chaudhary and Kastner (2016), which are used to estimate the impact per tonne of production for 152 crops or crop groups in 171 countries/territories. This gives an estimate of regional species loss (the number of species predicted to be committed to extinction if current conditions continue per ecoregion). Positive change would be represented by a decrease in predicted species loss. The third method to estimate biodiversity loss (providing separate results from the other methods) uses MapSPAM data (a modelled global dataset providing information on which crops are grown where) alongside species richness information from the International Union for the Conservation of Nature (IUCN) and BirdLife International to estimate ‘species richness-weighted extent of crop production’. This represents the hectares of crop production multiplied by the number of species ranges overlapping that hectare, and therefore where there is overlap between production and areas of biodiversity importance. Positive change would be represented by a decrease in ‘species richness-weighted extent of crop production’ embedded in consumption.
Water consumption was estimated from the Water Footprint Network. To account for water scarcity in regions of production, blue (irrigated) water consumption was multiplied by a weighting factor representing the water availability in a region after human and aquatic ecosystem demand has been met, using conversion factors sourced from Boulay et al. (2018). Positive change would be represented by a reduction in scarcity-weighted blue water use.
Caveats and limitations
For accurate interpretation of the results presented within this indicator, it is necessary to understand the following caveats:
- Data tracing all commodities exactly back to their countries or territories of origin are not publicly available. Whilst based on empirical statistics, the outputs produced by this indicator are derived from modelling so should be considered as estimates rather than exact values.
- Only the country or territory of origin for each commodity, and not the exact location of origin, can be obtained from the current version of the indicator as only national scale data were used. This means impacts are based on average production practices per country or territory, not the actual impacts at the exact location the product came from. This could be improved by using sub-national data (where available) in subsequent iterations of the indicator.
- Data linking impacts to trade are compiled at the national level, meaning any action by the UK in specific regions will be ‘averaged’ across the full global supply chain. Therefore, it will be hard to differentiate UK action from the actions of other consumer nations. The indicator will be more responsive to multi-national/-lateral action than to UK action specifically.
- The metrics we include are susceptible to commodity-specific and place-based heterogeneity in their impact. Therefore, the objective of this dataset is to identify impacts that are geographically specific. To achieve this, an MRIO is linked to additional data through a modelling framework to estimate consumption via production location. This is a different approach compared to those taken by the UK Material and Carbon Footprints, where there is less of a need to provide this geographic specificity. For example, estimates of carbon from consumption are based on factors applied to the production process, not the location of the process. Methodological differences such as these mean that there are limits to how much this indicator and the Material and Carbon indicators can be directly compared.
- Lags in the underlying datasets mean that data are only available up to 2023 in the current release. Care should be taken in analysing trends over time which can reflect complex changes in production volume, trade distributions, estimated inter-sectoral demands and final consumption expenditure.
- Estimates of the environmental impacts of consumption reported by other sources could differ from results reported here due to differences in the underlying data and methods. Use of different MRIOs as the dataset underlying this could also lead to differences in results, due to factors including geographic and sectoral resolution, temporal coverage and lag. Separate datasets (not forming part of the UK data release) using GTAP and EXIOBASE have been published on the associated dashboard for comparison.
- The presence of oil palm and soy as key sources of UK deforestation risk is common to other assessments, but the data reveal UK linkages to other supply chains (such as beans, cassava, paddy rice) that are not often considered as ‘deforestation risk’ commodities in other publications. These supply chains warrant further investigation to understand which sectors of consumption link to these estimated impacts.
In many of the countries and territories where commodities are driving rapid impacts, the UK represents a small proportion of the total demand. However, the underlying dataset allows the proportion of demand to be identified and the other consumers also contributing to the demand, hence providing better opportunities to work with producer countries and territories and to work multi-laterally with other consumer countries and territories to address sustainable production and reduce impacts.
To discuss the data and methodology, caveats, limitations and uncertainties associated with this indicator, the development team at the Stockholm Environment Institute, University of York, can be contacted at info@commodityfootprints.earth.
Additional notes
- All crops with data recorded in FAOSTAT are included (see technical documentation for further detail and exceptions).
- “Cattle-related commodities” refer to meat, offal, fats and hides from cattle and buffalo as reported within FAOSTAT, and aligning with data usages within the dataset from the Chalmers University of Technology (based on Singh & Persson, 2024). Note that impacts attributed to cattle result from land used for pasture, whilst impacts from commodities used as feed are presented as impacts associated with the raw commodity (for example, soy).
- Underlying datasets currently limit analysis to the years 2005 to 2023. See the technical documentation for further information about planned data updates for each underlying dataset.
- Characterisation factors are used as estimates of an environmental impact per unit of stressor (for example, the land use per kg of production or the biodiversity loss per unit of pollutant).
Recent developments
The underlying MRIO (multi-regional input-output) data comes from GLORIA (Global Resource Input-Output Assessment) in this year’s release. Additional detail on methodological updates since the indicator’s original publication in 2021 (such as the addition of the LIFE metric in the 2024 release) can be found in Appendix 3 of the technical documentation.
Work has also been undertaken on a number of developments that are related to, but planned to be published separately from this official statistic release, due to their more experimental nature. This includes an initial dataset on the material footprint of metal and mineral commodities (which could, at a later date, be extended to include environmental impact metrics).
Development plan
Up until and including the 2023 release, this indicator was published as an Official Statistic in Development. In line with our commitment to the Code of Practice for Statistics, we are setting out a plan for developing these statistics further. This plan outlines what we hope to do to improve our publications in future. This plan is informed by responses from users and stakeholders, as well as the UK Biodiversity Indicators Steering Group. We are keen to hear feedback from users of these statistics, please send your feedback to: biodiversity@defra.gov.uk.
We will look to update our development plan at least annually.
A stakeholder consultation report was published in 2025, summarising the findings of a survey and a series of usability testing sessions. The report provides the consultation results, with a focus on how the indicator was being used, how user-friendly the dashboard was, how outputs were being interpreted and the perceived value of the indicator.
Developments planned ahead of the next statistical release to be published in 2026:
-
Continued scoping work for the addition of agri-chemical related metrics, such as nitrogen and phosphorous pollution. The current impact metrics are mainly associated with areas of new and expanding production. However, many impacts come from intensification of current production. Including metrics related to this will be important. Work this year will scope out whether it is possible to add such data in the 2026 release, or further into the future.
-
Continued intercomparison of datasets available. We are working to understand how the use of alternative datasets affects end results, and what this can tell us about uncertainty. We are investigating ways that this could be presented as part of the dataset, such as by incorporating data flags or reporting on a range of possible values instead of having a single number for each data point.
-
Integration of enhanced methods for the physical trade and processing of commodities. At the current time, the indicator estimates physical trade in primary-commodities alone. Where it is uncommon for primary commodities (e.g. oil palm fruit) to be traded, the model relies on the monetary data within the MRIO to undertake trade-estimates. However, FAO provide processing and trade data for derived commodities, which has been used within the IOTA framework to provide more accurate estimates of trade in the past. This task will apply these previously developed methodologies to produce enhanced data across commodities within the GEIC dataset. It will also investigate the literature for further improvements that could be made for selected high-priority commodities. A decision will be taken following the development work on whether this should form part of the core GEIC dataset going forwards, or remain a more ‘experimental’ supplement to be published separately.
-
Integration of further improvements to the LIFE metric. In 2024, the LIFE score biodiversity metric was included in GEIC for the first time. Further development work is required to improve the sensitivity of the data, such as integrating data across multiple time stamps instead of using LIFE data from a single time point, with any differences across years being solely from the economic data.
Longer term development plans:
-
Continuing work on the metals and minerals data to include environmental impact data.
-
Producing data about sector-linked demand (e.g., the breakdown of the data by government spend vs non-government spend).
-
Scoping work to see if it would be possible to include social impact metrics.
-
Scoping work to see if it would be possible to include food security risk metrics.
-
Improving our understanding of uncertainty in the data.
References
-
Ball, T. S., Dales, M., Eyres, A., Green, J. M., Madhavapeddy, A., Williams, D. R. and Balmford, A. 2025. Food impacts on species extinction risks can vary by three orders of magnitude. Nature Food 6, 848–856
-
Boulay, A.M., Bare, J., Benini, L., Berger, M., Lathuillière, M.J., Manzardo, A., Margni, M., Motoshita, M., Núñez, M., Pastor, A.V. and Ridoutt, B. 2018. The WULCA consensus characterization model for water scarcity footprints: assessing impacts of water consumption based on available water remaining (AWARE). The International Journal of Life Cycle Assessment, 23(2), 368–378.
-
Chaudhary, A. & Brooks, T. 2018. Land Use Intensity-Specific Global Characterization Factors to Assess Product Biodiversity Footprints. Environmental Science & Technology, 52(9), 5094–5104.
-
Chaudhary, A. & Kastner, T. 2016. Land use biodiversity impacts embodied in international food trade. Global Environmental Change, 38, 195–204.
-
Croft S.A., West C.D. & Green J.M. 2018. Capturing the heterogeneity of sub-national production in global trade flows. Journal of Cleaner Production, 203, 1106–1118.
-
Croft, S., West, C., Harris, M., Otley, A. and Way, L. 2021. Towards indicators of the global environmental impacts of UK consumption: Embedded Deforestation. JNCC Report No. 681, JNCC, Peterborough, ISSN 0963-9091.
-
Croft, S., West, C., Harris, M., Green, J., Molotoks, A., Wood, E., Ball, T. and Way, L. 2025. Technical documentation for an official statistic estimating the global environmental impacts of consumption: 2025 Version. JNCC Report No. 808, JNCC, Peterborough, ISSN 0963-8091.
-
Eyres, A., Ball, T. S., Dales, M., Swinfield, T., Arnell, A., Baisero, D., Durán, A. P., Green, J. M., Green, R. E., Madhavapeddy, A. and Balmford, A. 2025. LIFE: A metric for mapping the impact of land-cover change on global extinctions. Philosophical Transactions B 380, 20230327.
-
Harris, M., Hawker, J., Croft, S., Smith, M., Way, L., Williams, J., Wilkinson, S., Hobbs, E., Green, J., West, C. and Mortimer, D. 2019. Is the Proportion of Imports Certified as Being from Sustainable Sources an Effective Indicator of UK Environmental Impact Overseas? Towards Indicators of Environmental Sustainability. Contracted Report to Defra.
-
International Union for the Conservation of Nature (IUCN) .2020. The IUCN Red List of Threatened Species. Version 2020.1. Available from: https://www.iucnredlist.org. Accessed 3 August 2020.
-
Route2 Sustainability & Carbon Smart. 2019. Piloting Indicators for The Global Environmental Impacts of UK Consumption. Defra Report.
-
Singh, C and Persson, M. 2024. Global patterns of commodity-driven deforestation and associated carbon emissions. EarthArXiv pre-print. Available at: https://eartharxiv.org/repository/view/7000/
-
Workman, E. and Harris, M. 2025. A Consultation on the Global Environmental Impacts of Consumption Indicator. JNCC Report No. 797, JNCC, Peterborough, ISSN 0963-8091.
Categories:
Published:
Reviewed: