Aggregated Total Applied Toxicity
Last updated: 2025
Latest data available: 2022
Introduction
Aggregated Total Applied Toxicity (ATAT) is a method for countries to determine the pressure from pesticides on a range of taxonomic groups over time, and these taxonomic-specific rates can be further aggregated into national and global trends. This indicator presents a time-series of toxicity pressure from pesticides applied to arable crops within the UK, and then disaggregates these into impacts on ten key ecological communities.
This indicator is being published as part of the UK’s response to the Convention on Biological Diversity’s Kunming-Montreal Global Biodiversity Framework (GBF). This the headline indicator for GBF Target 7: Reduce Pollution to Levels That Are Not Harmful to Biodiversity. The target aims to reduce the overall risk from pesticides and highly hazardous chemicals by at least half by 2030. At the time of production, full guidance on methods for this headline indicator has not been published, with several aspects of the approach followed here under discussion. The UK has chosen to publish the following exploratory methods as a demonstration of the possibilities and limitations of the outline guidance available at this stage. This indicator will be further developed as appropriate when additional guidance becomes available.
Data for this indicator is provided by the Pesticide Usage Survey (Fera) and the Pesticide Properties DataBase (PPDB), and can be found in the published datafile. This indicator is being produced in parallel with the Defra Pesticide Load Indicator (PLI), which is a similar assessment of the environmental pressure from pesticides over time. While it focuses on the same set of active substances, the calculations for the UK PLI are substantially different to those for the ATAT and do not directly relate to the GBF target. However, the PLI demonstrates domestic progress and is used to measure the target set within the UK Pesticides National Action Plan.
Type of indicator
Pressure indicator
Type of official statistics
Official statistic in development. This first iteration of the indicator is reported as part of the UK’s commitment to the Convention on Biological Diversity and the Global Biodiversity Framework. Comments and feedback on the methods chosen are welcome; please email us. For more information, please visit the UK Statistics Authority’s website on types of official statistics – UK Statistics Authority.
Assessment of change
As this is an official statistic in development, it has not been assessed.
Key results
Normalised aggregated total applied toxicity values show that the pressure on ten taxonomic groups from pesticides applied to UK arable crops increased after 1990, when the time series starts; but the increase appears to slow in the early 2000s and the pressure has substantially reduced since around 2010 (Figure 1). This is echoed in many of the individual taxonomic group TAT (Total Applied Toxicity) scores which show a similar peak in pressure and subsequent decline (Figure 2). There are gaps within the time series data used to produce this figure; see Figure 2 for an explanation and estimations of uncertainty.
Figure 1: Normalised Aggregated Total Applied Toxicity (ATAT) for UK arable crops, 1990 to 2022
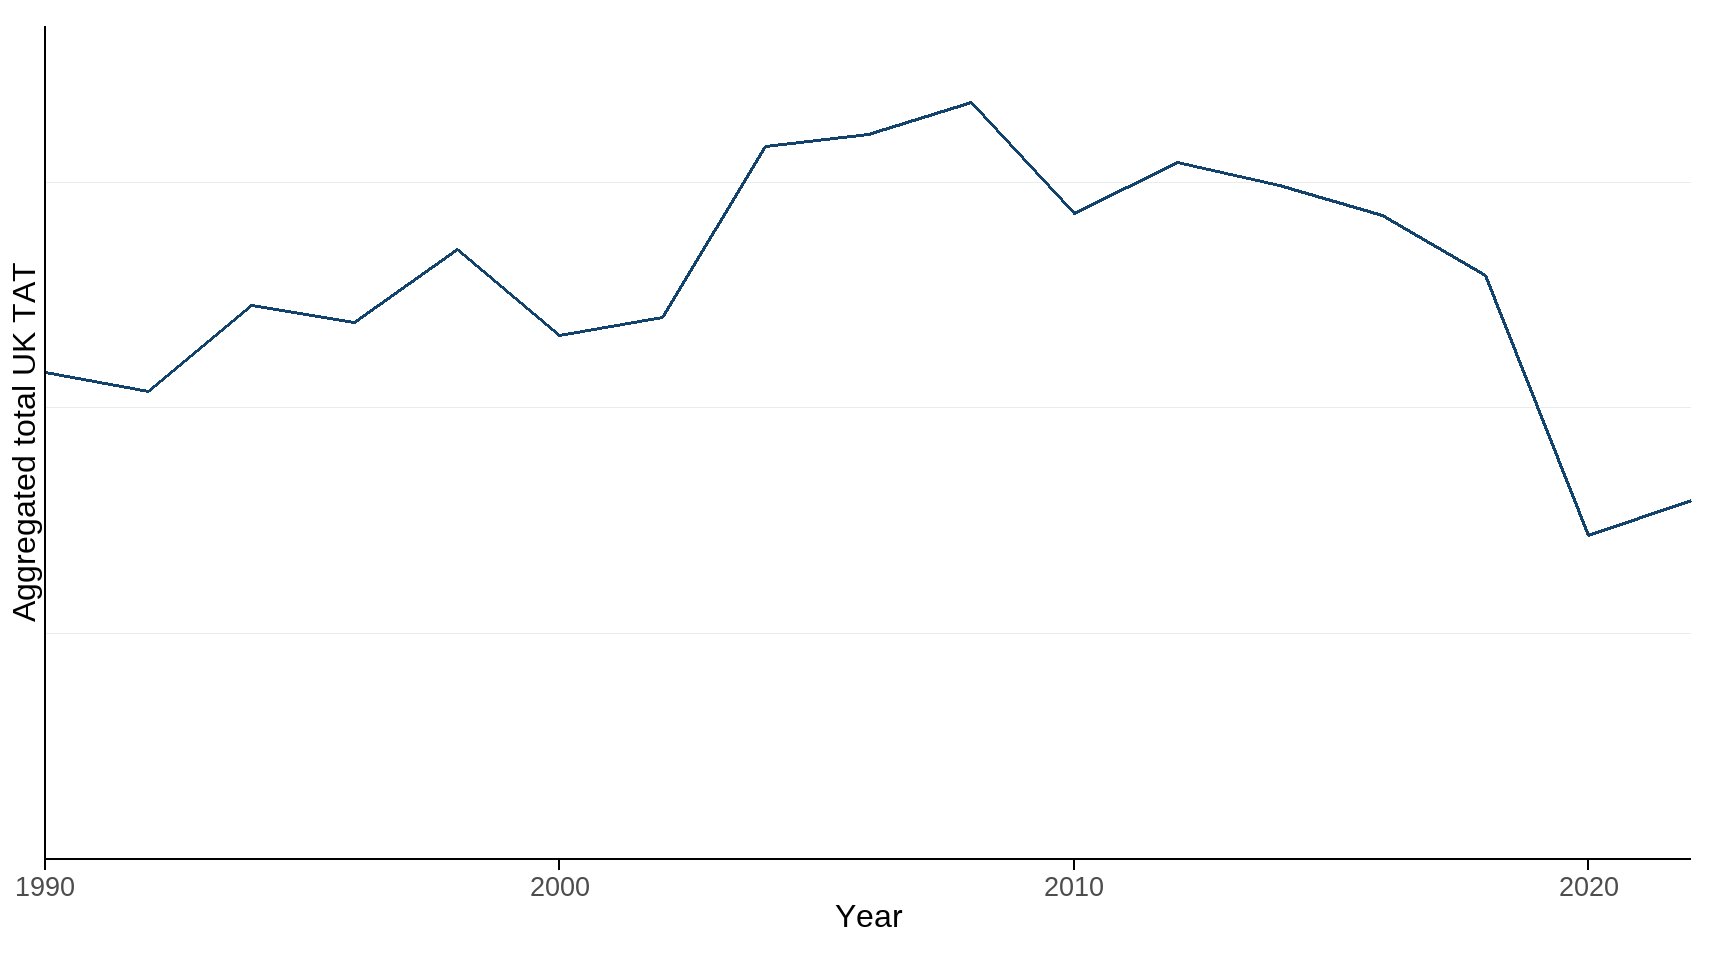
Source: Pesticide Usage Survey, Fera and Pesticide Properties DataBase
Notes about Figure 1
- Total Applied Toxicity (TAT) is calculated from the mass of active substances applied in a year combined with a measure of their hazard.
- Due to the method to calculate this time series, the data is unitless and best presented as change over time.
- This overall time series is aggregated from the ten taxonomic TATs shown in Figure 2.
- Data coverage for the Regulatory Threshold Levels (RTLs) of pesticide active substances, and therefore the proportion of substances included in the indicator, varies across the time series. Figure 2 shows this data availability at the time of indicator production across the time series for each taxonomic group.
The pressure on specific taxonomic groups varies greatly, both between groups and across time (Figure 2). Some groups have little directional trend but others appear to peak and then decline in more recent years. As a result of significant data gaps for Regulatory Threshold Levels (RTLs), especially in earlier years of this time series, Figure 2 includes a representation of confidence in these taxonomic TATs. The hashed line in each panel for Figure 2 represents the proportion of substances where RTL data is available for that taxonomic group over the time series. New RTLs are being generated over time, and therefore these data will become more complete in later iterations of this indicator; however any interpretation of trends, especially in the earlier years of this time series, should be approached with caution.
Figure 2: Normalised Total Applied Toxicity (TAT), by taxonomic group, for UK arable crops, 1990 to 2022, including uncertainty
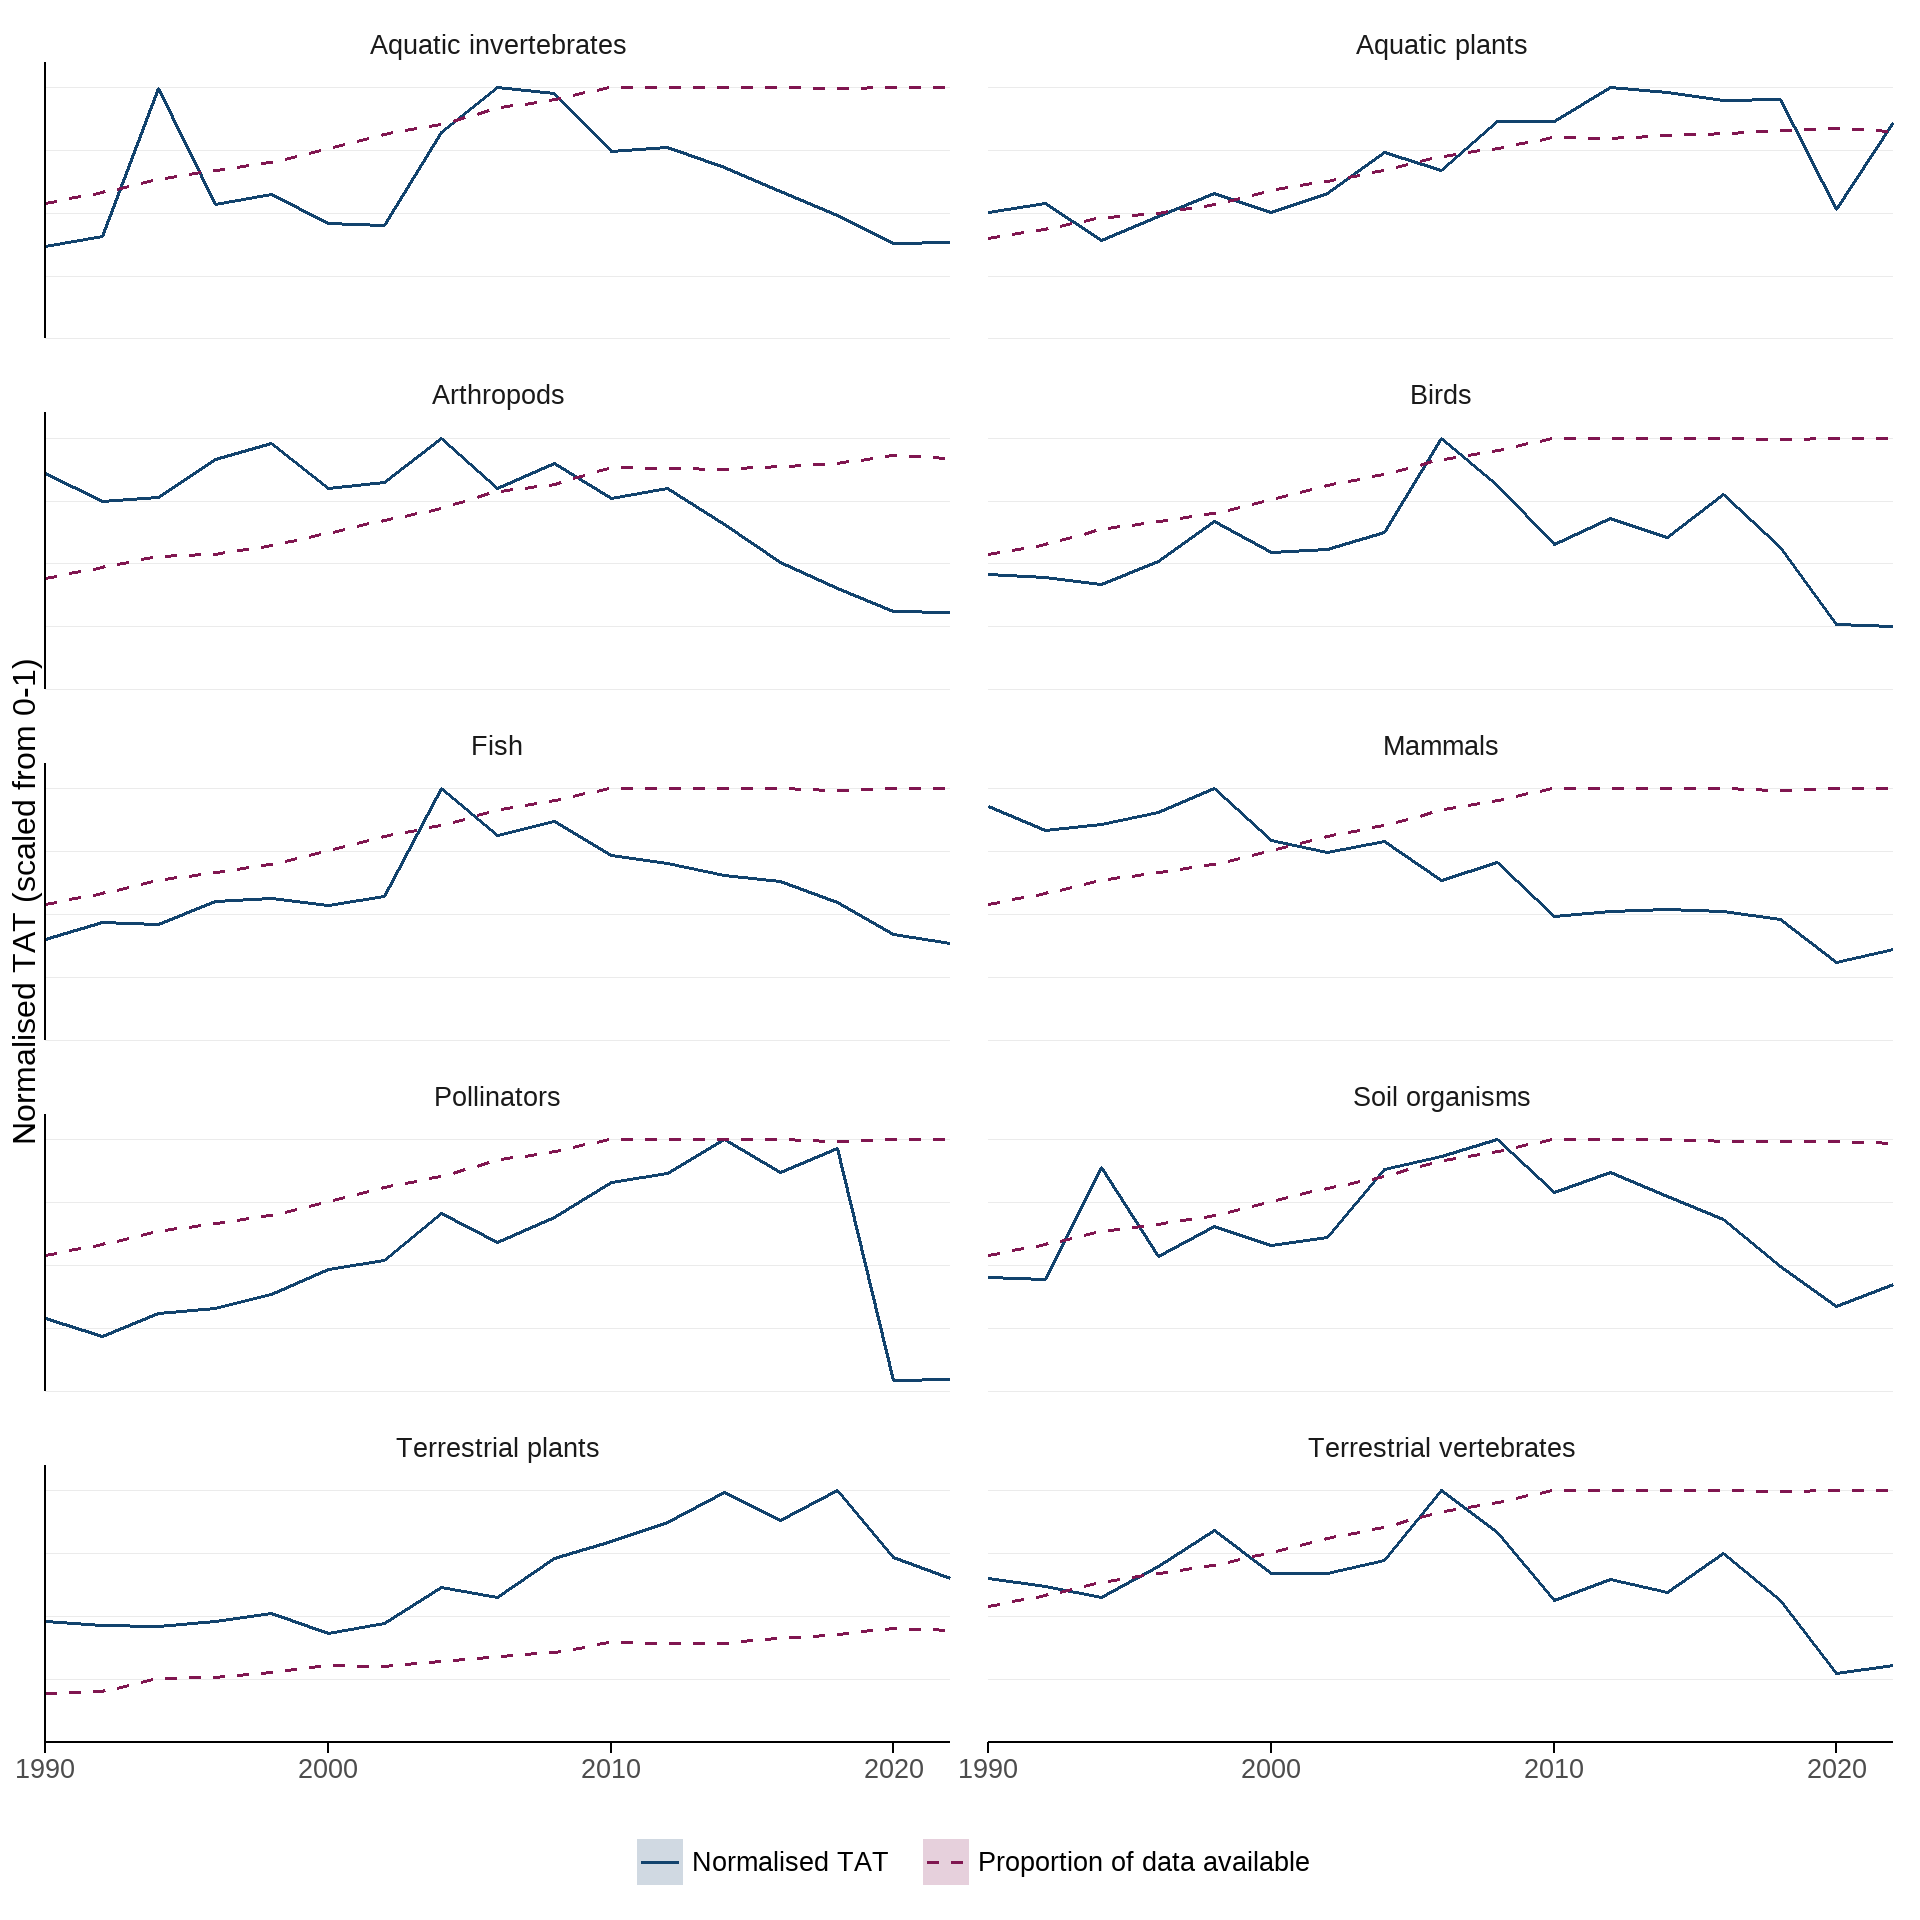
Source: Pesticide Usage Survey, Fera and Pesticide Properties DataBase
Notes about Figure 2
- TAT values are generated for these ten taxonomic groups (see Further detail).
- Due to the method to calculate these time series, the data is unitless and best presented as change over time.
- The data for these taxonomic groups has been normalised and are presented as the proportion of each yearly value compared with the maximum for that group, to allow a comparison between these groups.
- Uncertainty in these measures is represented by the dark red hashed line, which shows the completeness of the RTL data used for the calculation and represents the proportion of RTLs which have been generated for that taxonomic group. These lines demonstrate that RTL data is more complete for the recent years in the time series.
Further detail
The global methodology for this indicator is being developed for the GBF by the UN Food and Agriculture Organisation (FAO). At the time of producing this indicator for the UK, finalised global guidance was not available; however, this preliminary iteration of the indicator has been developed following interim guidance from the FAO and from the Convention on Biological Diversity (CBD) Ad-Hoc Technical Expert Group on Indicators.
Total Applied Toxicity (TAT) (following Schulz et al. 2021) is calculated for ten specific taxonomic groups, and is intended to demonstrate the toxicity pressure on these groups from all active substances in the total weight of pesticides applied. It is calculated from a combination of a measure of risk from specific toxicity endpoints and the mass of usage within each specific year, to give a measure of the total component of risk to that group over time. The taxonomic groups included are:
- Aquatic invertebrates
- Aquatic plants
- Arthropods (except pollinators)
- Birds
- Fish
- Mammals
- Pollinators
- Soil organisms
- Terrestrial plants
- Vertebrates
To calculate TAT (Schulz et al. 2021), two linked datasets are therefore required; firstly substances used and their mass applied, and secondly taxonomic group-specific Regulatory Threshold Levels (RTLs) that link each of those substances to toxicity endpoints for these communities.
The UK Pesticide Usage Survey (PUS) (conducted by Fera) collects information on the use of pesticides in agriculture. This indicator focuses only on those substances applied to arable crops, as these represent the overwhelming majority of pesticide mass applied in UK agriculture, and because focusing on one crop type removes the need to amalgamate data from surveys conducted in other years on other crop types. The arable PUS is conducted every two years and spans 335 active substances (excluding microbial biopesticides; see Ayilara et al. 2023), but not all of these were applied in all years. However, this dataset enables the production of time series for this indicator.
Toxicity is included via RTLs, which are generated from the properties of specific substances and their worst-case impacts on the ecological communities included. These values are relative and unitless, but they represent the maximum potential risk to the communities from the amount of active substances used each year. Some preliminary RTLs have been developed for the majority of the substances in the PUS, using worst-case toxicity endpoints from specific studies, as collated within the Pesticide Properties DataBase (PPDB).
More information about the calculation of this indicator is available in the Technical annex.
Relevance
Pesticides are applied to the environment with the deliberate intention to kill or disrupt target organisms, in order to protect crops or livestock and therefore benefit humans. They can therefore have a significant impact on wider biodiversity and ecosystem functioning. The global usage of pesticides is increasing and current monitoring shows that environmental levels often exceed ecotoxicological safety thresholds determined by risk assessments. Global Biodiversity Framework Target 7 seeks to reduce pollution risks and the negative impact of pollution from all sources by 2030, to levels that are not harmful to biodiversity and ecosystem functions and services.
International/domestic reporting
The suite of UK Biodiversity Indicators has been revised and updated to bring it in line with the Kunming-Montreal Global Biodiversity Framework (GBF) of the Convention on Biological Diversity (CBD). Some UKBIs will be used for the forthcoming UK national reports to CBD.
This is a headline indicator for Target 7: Reduce Pollution to Levels That Are Not Harmful to Biodiversity.
Web links for further information
Acknowledgements
Thank you to the many people who have contributed by providing data and to the many colleagues who have helped with the production of this indicator, including Ralf Schulz, John Tzilivakis, and colleagues at Defra and Fera.
Technical annex
Methodology
To calculate this indicator, TATs (following Schulz et al. 2021) specific to substances, years, and taxonomic groups were generated. These were based on the substance data available in the PUS and all available RTLs for these substances. These were then aggregated by taxonomic group to create a time series of taxonomic TATs. However, because the mass of substances and RTLs included show huge variability, and the TAT calculation means that the outcome is unitless, for ease of display and comparison the final step was to normalise each taxonomic TAT, by dividing each time series value by the highest value for each taxonomic group. This creates ten time series TATs which all vary between 0 and 1, and show the relative change in toxicity pressure on each group across the same time series.
Finally, an aggregated TAT was generated for the UK by summing these taxonomic TATs to show the change in total toxicity pressure over time for the UK.
Caveats and limitations
This indicator is in development. While outline guidance has been available on the development of the ATAT methodology, at the time of production the FAO had not concluded their development of a detailed methodology. This iteration of the indicator has therefore been developed using the most up-to-date pesticide usage data from the PUS, and preliminary Regulatory Threshold Levels. The methods used to generate these values are therefore subject to change. The indicator has been developed in this way to demonstrate data and approaches which are available, but conclusions reached here are provisional until formal guidance on methods is finalised and available.
Development plan
Further development of this indicator will be informed by the finalised methodological guidance for the ATAT when that is available.
We are keen to hear from our users about the methods, language and visualisations used in this indicator, as well as our published development plan: please email us.
References
Ayilara, M. S., Adeleke, B. S., Akinola, S. A., Fayose, C. A., Adeyemi, U. T., Gbadegesin, L. A., Omole, R. K., Johnson, R. M., Uthman, Q. O., Babalola, O. O. (2023) Biopesticides as a promising alternative to synthetic pesticides: A case for microbial pesticides, phytopesticides, and nanobiopesticides. Frontiers in Microbiology 14: 1040901. https://doi.org/10.3389/fmicb.2023.1040901 (Erratum in: Frontiers in Microbiology 14: 1258968. https://doi.org/10.3389/fmicb.2023.1258968)
Schulz, R., Bub, S., Petschick, L. L., Stehle, S. and Wolfram, J. (2021) Applied pesticide toxicity shifts toward plants and invertebrates, even in GM crops. Science 372, 81-84. https://doi.org/10.1126/science.abe1148
Categories:
Published: