Area of forestry land certified as sustainably managed
Last updated: 2025
Latest data available: 2025
|
In 2025 new indicators have been developed and published in the UK Biodiversity Indicators suite. These indicators were developed to report on progress towards the goals and targets of the Kunming-Montreal Global Biodiversity Framework. Alongside this, the Biodiversity Indicators production team have sought feedback from our users, and used this feedback to identify existing indicators which can be discontinued whilst minimising impact on our users. |
Introduction
This indicator shows the percentage of the woodland area in the UK that is certified against agreed environmental standards. Certification of woodlands promotes responsible forest management to safeguard forests’ natural heritage and protect threatened species. Woodland certification schemes are used to demonstrate that wood or wood products come from well-managed forests.
Data for this indicator are sourced from the Forest Research Forestry Statistics 2025 publication, they can be found in the published datafile. We also have a similar indicator at the England level.
This UK Biodiversity Indicator is similar to part of Sustainable Development Goal (SDG) indicator 15.2.1, although there are some differences in the data reported for the UK. SDG indicator 15.2.1 is headline indicator 10.2 under the Kunming-Montreal Global Biodiversity Framework (GBF) (see International/domestic reporting section).
Type of indicator
State indicator
Type of official statistics
Accredited official statistic
![]()
Assessment of change
Area of UK woodland certified as sustainably managed.
| Measure | Assessment | Time period | Result |
|---|---|---|---|
| Percentage of woodland certified | Long term | 2001 to 2025 | Improving |
| Percentage of woodland certified | Short term | 2020 to 2025 | Little or no overall change |
Notes on the indicator assessment
Long- and short-term assessments are based on a 3% rule of thumb. Where possible, the base years for these assessments use a three-year average. See Assessing Indicators.
Key results
In March 2025, there were 1.44 million hectares of certified woodland across the UK, representing almost 44% of the total woodland area (Figure 1).
The overall proportion of woodland certified as sustainably managed in the UK increased from 36% in 2001 to 44% in 2007. Since then, it has remained relatively stable at around 43% to 44%.
The proportion of woodland that is certified has increased in Scotland and Wales, decreased in Northern Ireland and is the same in England compared to 2001 (Figure 2).
Note: The percentage fall observed in Northern Ireland is caused by a change in the data source for estimating the total woodland area in the country between 2011 and 2012. The area certified in Northern Ireland has remained reasonably stable over the entire period, rising slightly (from around 62,000 hectares in 2001 to 66,461 hectares in 2025) (Table 1).
Figure 1: Percentage of woodland area certified as sustainably managed in the UK, 2001 to 2025

Source: Forest Research, Forestry Statistics 2025
Notes about Figure 1
- All figures relate to data at 31 March each year, apart from 2001 (31 December) and 2002 (30 September), with regular data collection from 2004.
Figure 2: Percentage of UK woodland area certified as sustainably managed by country, 2001 and 2025
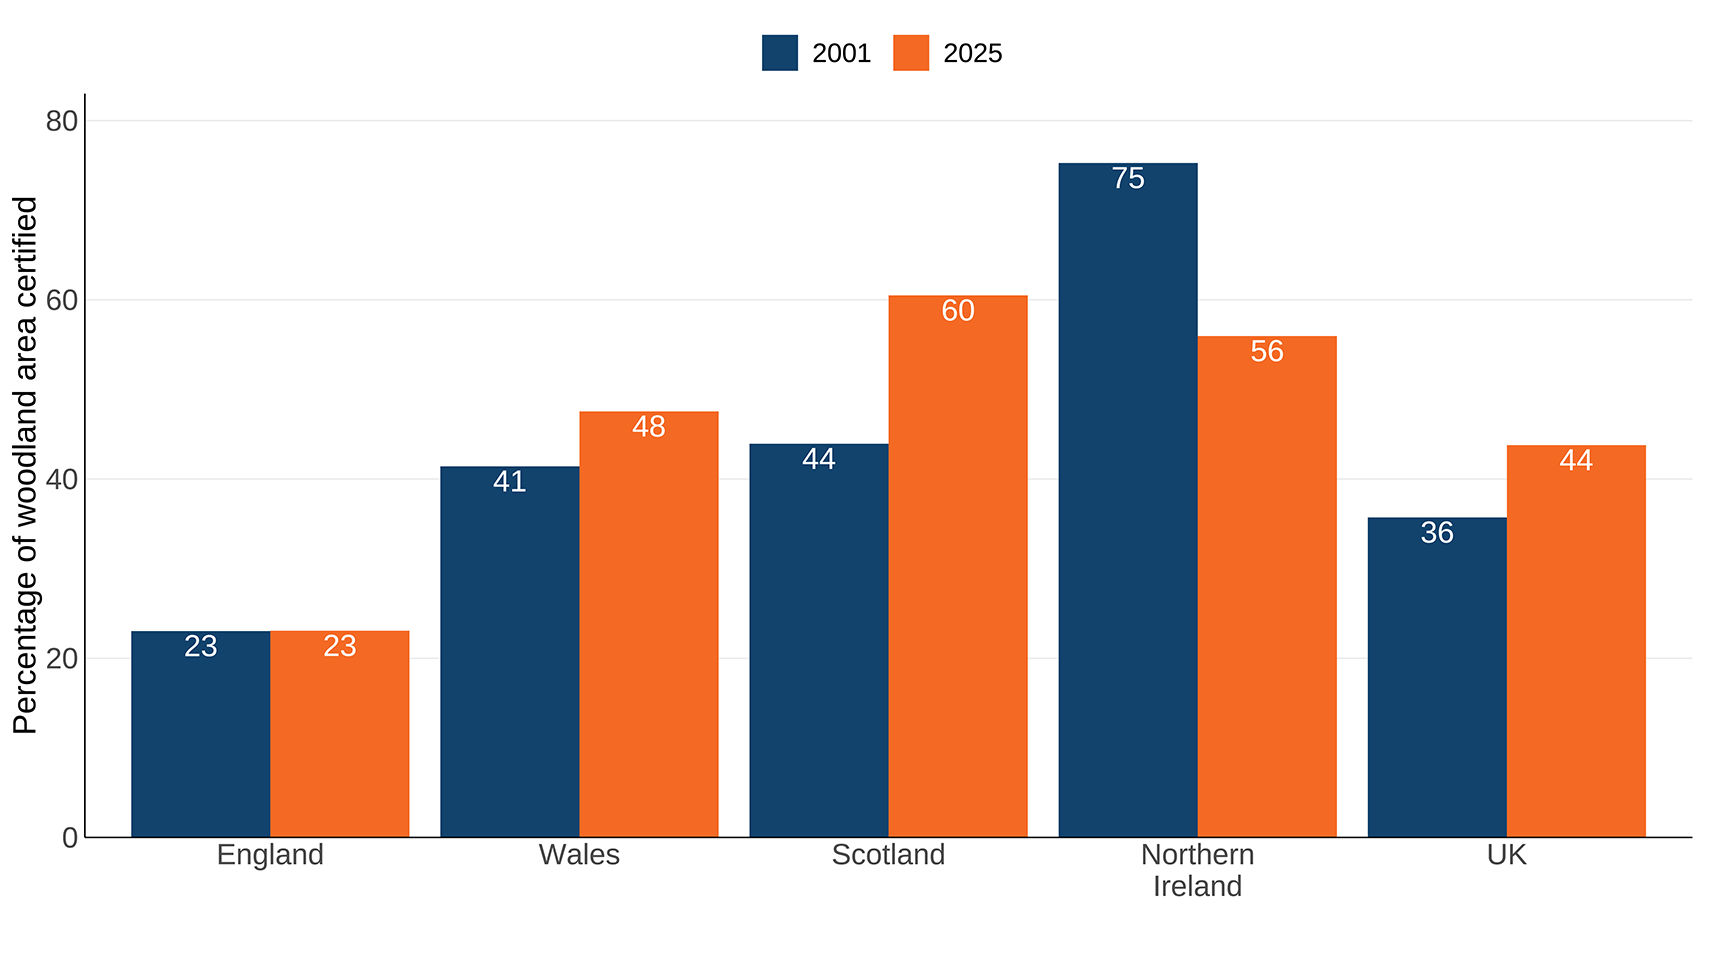
Source: Forest Research, Forestry Statistics 2025
Notes about Figure 2
- Percentage labels have been rounded.
- The percentage fall observed for Northern Ireland should be treated with caution as the data source for estimating the total woodland area in the country changed between 2011 and 2012.
Further detail
The indicator shows the percentage of the woodland area in the UK that is certified against agreed environmental standards, derived from the areas reported on certificates and more detailed assessment of selected certificate holders. The total area certified can change if new woodlands are certified, if existing certificates are not renewed, or if there is a time lag in renewal of an existing certificate. A breakdown by country, giving areas of woodland under certified management by ownership type (either public or private) in 2025 is provided in Table 1.
Table 1: Area of UK woodland under certified management in March 2025, by country and ownership (thousand hectares)
| Ownership | England | Wales | Scotland | Northern Ireland | UK |
|---|---|---|---|---|---|
| Public | 214 | 115 | 468 | 62 | 860 |
| Private | 96 | 34 | 445 | 4 | 579 |
| Total woodland area certified | 310 | 149 | 913 | 67 | 1,439 |
Source: Forest Research, Forestry Statistics 2025
Notes about Table 1
- Public sector owners include: Forestry England, Forestry and Land Scotland, Natural Resources Wales and Forest Service.
- Where possible, calculations have used the total woodland area certified, rather than the total land area certified.
- All Forestry England, Forestry and Land Scotland, Natural Resources Wales and Forest Service woodland is certified, areas shown are latest estimates of woodland areas.
- Natural Resources Wales estimates only relate to the Welsh Government Woodland Estate.
- The totals may not match the sum of figures in the rows above due to rounding.
Certification in the UK began in 1996, with data collation starting in 2001, and regular annual collation commencing in 2004. All certified woodland in 2025 is certified under the Forest Stewardship Council (FSC) scheme or the Programme for the Endorsement of Forest Certification (PEFC) scheme, with many woodlands certified under both schemes. New certificates may relate to existing woodland that was not previously certified or to newly planted areas. In order for products produced from timber to be certified as sustainable, both forest management practices and the Chain of Custody, which tracks timber from forest to retail outlet, must be assessed.
The woodland area statistics used in the 2025 update of this indicator are based on the National Forest Inventory (NFI) woodland map of Great Britain at March 2022. This map replaces an interim NFI woodland map from 2021 used to update the indicator over the last 3 years, and this change has resulted in revisions to woodland area figures for England, Scotland, Wales, and the UK for 2021 to 2023.
Data for Grown in Britain, previously included in this indicator as a valid woodland certification scheme, were removed during the 2024 update. This removal has resulted in revisions to both the total and the private sector area of certified woodland for 2020 to 2023. These reductions amount to up to 8,000 hectares for England (-8%) and less than 1,000 hectares in each of Scotland, Wales and Northern Ireland.
Certified woodland areas are often used as an indicator of sustainable forest management; however, woodland that is not certified may also be sustainably managed. Some choose not to become certified because there is a cost involved in getting certified and there may be little incentive for woodland owners to get their woodlands certified if timber production is not a major objective.
Relevance
Woodland certification assesses management practices against agreed environmental standards. Certification requires that wood products are harvested legally and sustainably, and that important wildlife habitats are identified and are not negatively impacted by management.
International/domestic reporting
The suite of UK Biodiversity Indicators has been revised and updated to bring it in line with the Kunming-Montreal Global Biodiversity Framework (GBF) of the Convention on Biological Diversity (CBD). Some UKBIs will be used for the forthcoming UK national reports to CBD.
This UK Biodiversity Indicator is similar to a sub-indicator included as part of SDG indicator 15.2.1: Progress towards sustainable forest management. There are, however, some differences between these indicators in the data reported for the UK. SDG indicator 15.2.1 is published by the Food and Agriculture Organization of the United Nations (FAO) on the SDG Indicators Data Portal, where the indicator progress assessment can be filtered for UK data. SDG indicator 15.2.1 is headline indicator 10.2 in the GBF monitoring framework, relevant to GBF Target 10: Enhance Biodiversity and Sustainability in Agriculture, Aquaculture, Fisheries, and Forestry.
Web links for further information
Acknowledgements
Thank you to the many people who have contributed by providing data and to the many colleagues who have helped produce this indicator.
Development plan
Since our previous publication we have adapted the language and visualisations used in this indicator. We are keen to hear from our users about these changes, as well as our published development plan, please email us.
Categories:
Published: