Surface water status
Last updated: 2025
Latest data available: 2024
|
In 2025 new indicators have been developed and published in the UK Biodiversity Indicators suite. These indicators were developed to report on progress towards the goals and targets of the Kunming-Montreal Global Biodiversity Framework. Alongside this, the Biodiversity Indicators production team have sought feedback from our users, and used this feedback to identify existing indicators which can be discontinued whilst minimising impact on our users. |
Introduction
The EU Water Framework Directive (WFD) underpins an important mechanism for assessing and managing the water environment, through a six-yearly cycle of river basin management planning and implementing measures to protect and improve the water environment. The Water Environment (Water Framework Directive) (England and Wales) 2017 Regulations transposed WFD into law in England and Wales. Similar regulations transposed WFD in Scotland and Northern Ireland, respectively. These regulations were retained in UK law after EU exit via the EU Withdrawal Act 2018. The UK continues to classify and report water body status under the new legislation. For ease of reference this legislation will be referred to as the WFD throughout this document.
This indicator shows the percentage of surface water bodies in each ecological status classification and assesses the change in the percentage of water bodies in the UK awarded a good or high surface water status classification under the Water Framework Directive (WFD) 2017 Regulations. Around 10,000 water body assessments are included in the indicator each year: including rivers, canals, lakes, estuaries and coastal waters.
This year’s update includes revisions to the time series data to correct errors found in the England, Scotland and Wales data.
Data for this indicator can be found in the published datafile. We also have a similar indicator at the England level.
Type of indicator
State indicator
Type of official statistics
Official statistic
Assessment of change
| Measure | Assessment | Time period | Result |
|---|---|---|---|
| Percentage of UK surface water bodies in ‘High’ or ‘Good’ ecological status | Long term | 2009 to 2024 | Little or no overall change |
| Percentage of UK surface water bodies in ‘High’ or ‘Good’ ecological status | Short term | 2019 to 2024 | Little or no overall change |
Long- and short-term assessments are based on a 3% rule of thumb. Where possible, the base years for these assessments use a three-year average. See Assessing Indicators.
Key results
There has been little change in the overall number of surface water bodies in the UK awarded high or good ecological status since the indicator was first prepared in 2009, and similarly, there has been little change in the short term, between 2019 and 2024 (Figure 1).
In 2024, 33% of surface water bodies were assessed under the Water Framework Directive Regulations (WFD Regulations) as being in high or good ecological status, two percentage points higher than in 2009 and 1 percentage points higher than the figure of 32% reported in 2019.
Figure 1: Status classification of UK surface water bodies under the Water Framework Directive, 2009 to 2024
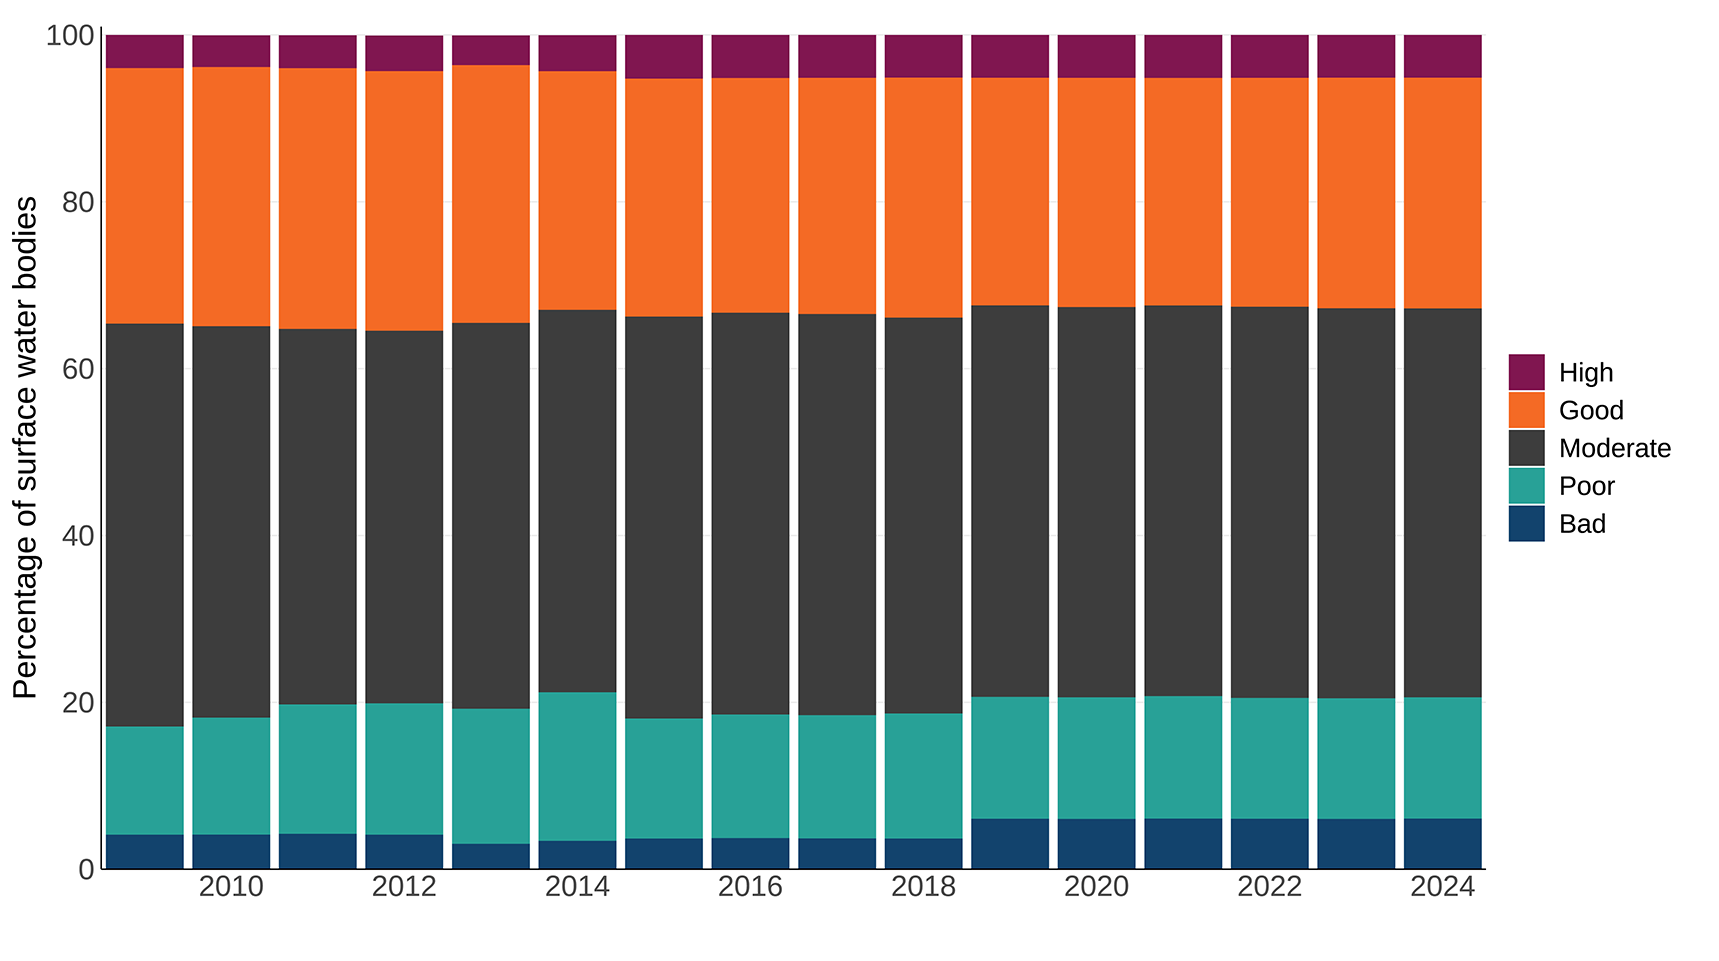
Source: Department of Agriculture, Environment and Rural Affairs for Northern Ireland; Environment Agency; Natural Resource Wales; Scottish Environment Protection Agency.
Notes about Figure 1
- Based on numbers of surface water bodies classified under the Water Framework Directive (WFD) in England, Wales, Scotland and Northern Ireland. Includes rivers, canals (Northern Ireland does not report on canals), lakes, estuaries and coastal water bodies.
- A water body is a management unit, as defined by the relevant authorities.
- Water bodies that are heavily modified or artificial are included in this indicator alongside natural water bodies. Heavily modified or artificial water bodies are classified as good, moderate, poor or bad ‘ecological potential’. Results have been combined; for example, the number of water bodies with a high-status classification has been added to the number of heavily modified or artificial water bodies with high ecological potential.
- The results published each year relate to data reported in that year under the WFD; data reported in a given year relate to data collected over the previous year (for Scotland) and previous three-year period (for England, Wales and Northern Ireland). This indicator was updated in 2024 with new data for Scotland, Wales and Northern Ireland. To calculate totals for the 2024 data point, the most recent classification data available at the time of publication was: 2023 (cycle 3) for Scotland; 2024 (cycle 3) for Northern Ireland; 2024 (cycle 3) for Wales and 2019 (cycle 2) for England. Classifications are valid until they are next assessed; therefore, for years where a country does not report, their latest available data are carried forward.
- The percentage of water bodies in each status classification has been calculated based on the total number of water bodies assessed in each year.
- The total number of assessments varies slightly from year to year (see Table 2).
- This year’s update includes revisions to the time series data to correct errors found in the England, Scotland and Wales data.
Further detail
In 2024, 3,047 surface water bodies (33%) in the UK were in high or good ecological status (Figure 1). A breakdown of the headline measure by water body type is presented in Figure 2 and in Table 1. In 2024, 29% of rivers and canals, 26% of lakes and 75% of estuaries and coastal water bodies in the UK were in high or good ecological status. Table 1 also shows a further level of disaggregation, splitting the data by country.
Figure 2: Surface water status classification of UK surface water bodies, by water body type, under the Water Framework Directive, 2009 to 2024
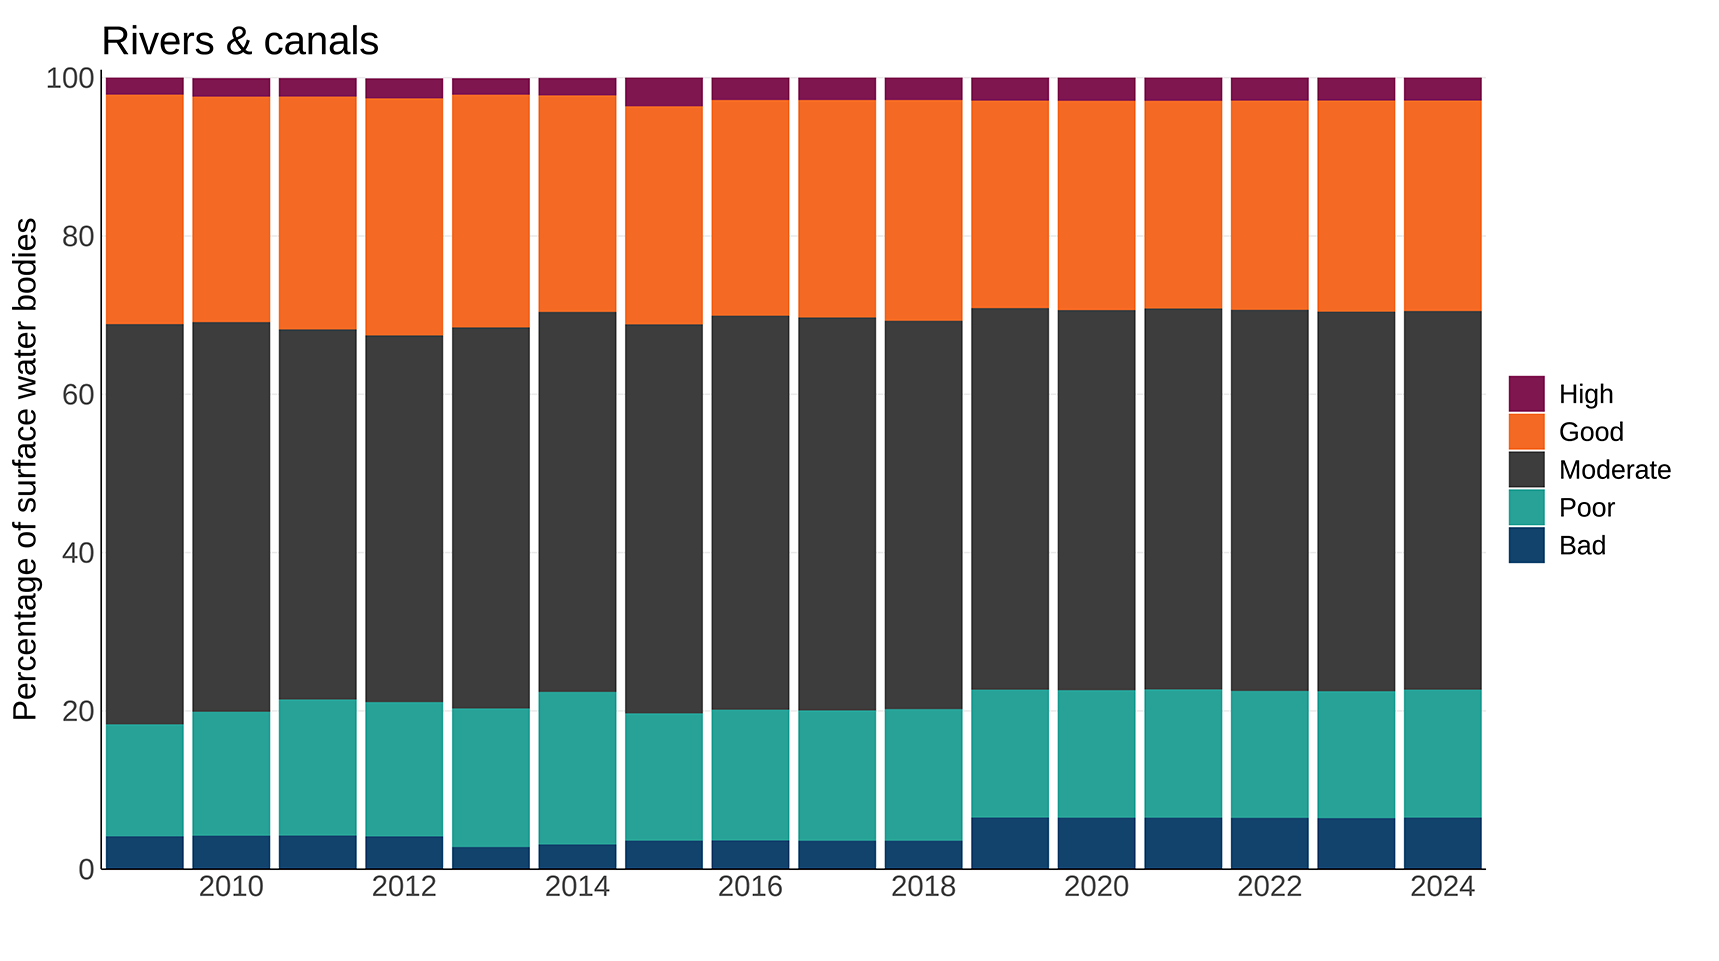
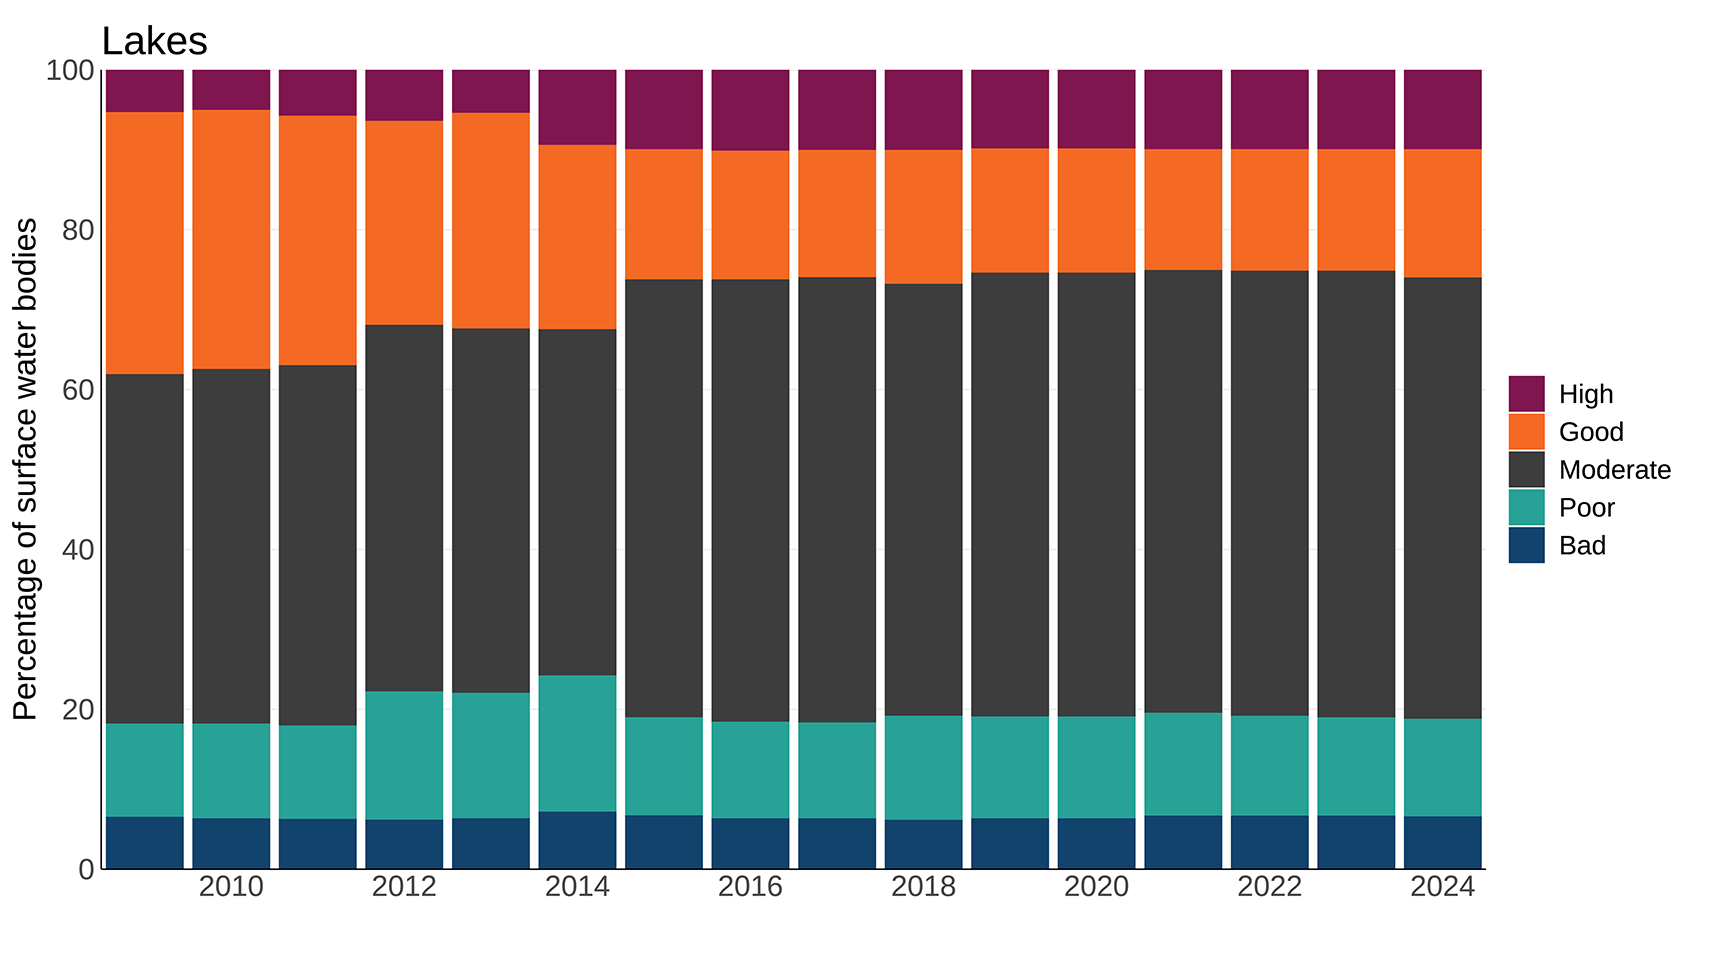
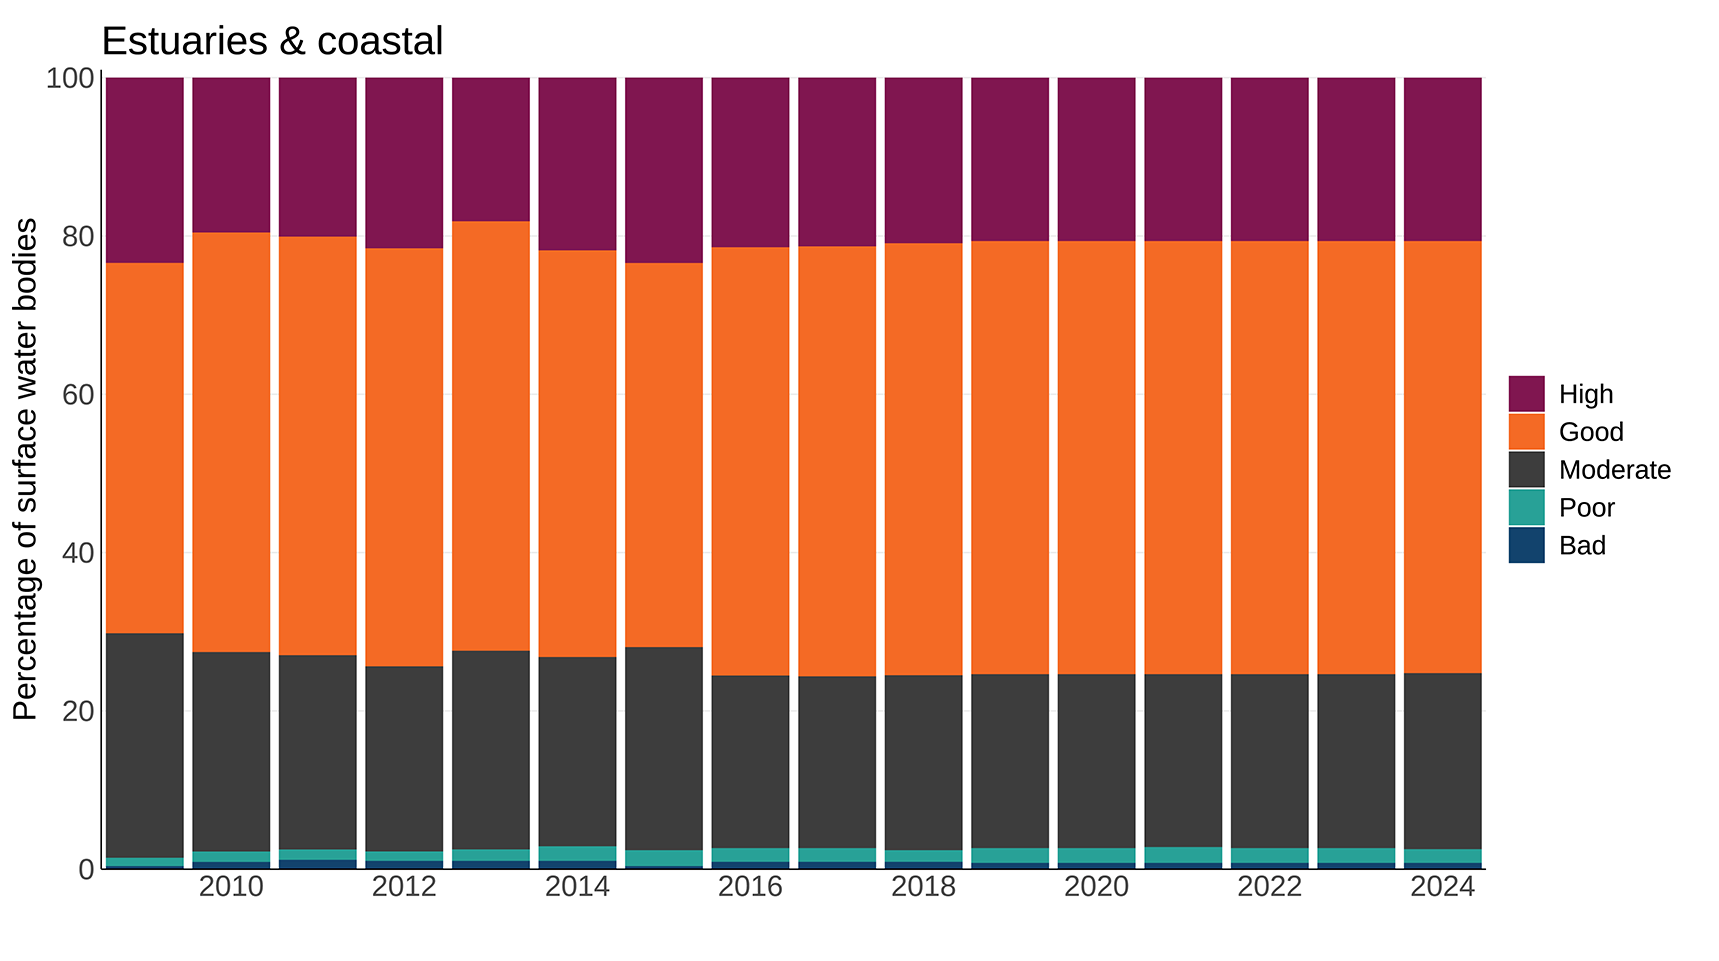
Source: Department of Agriculture, Environment and Rural Affairs for Northern Ireland; Environment Agency; Natural Resource Wales; Scottish Environment Protection Agency.
Notes about Figure 2
- Based on numbers of surface water bodies classified under the Water Framework Directive (WFD) in England, Wales, Scotland and Northern Ireland. Includes rivers, canals (Northern Ireland does not report on canals), lakes, estuaries and coastal water bodies.
- A water body is a management unit, as defined by the relevant authorities.
- Water bodies that are heavily modified or artificial (HMAWBs) are included in this indicator alongside natural water bodies. HMAWBs are classified as high, good, moderate, poor or bad ‘ecological potential’. Results have been combined; for example, the number of water bodies with a high-status classification has been added to the number of HMAWBs with high ecological potential.
- The results published each year relate to data reported in that year under the WFD; data reported in a given year relate to data collected over the previous year (for Scotland) and previous three-year period (for England, Wales and Northern Ireland). This indicator was updated in 2024 with new data for Scotland, Wales and Northern Ireland. To calculate totals for the 2024 data point, the most recent classification data available at the time of publication was: 2023 (cycle 3) for Scotland; 2024 (cycle 3) for Northern Ireland; 2024 (cycle 3) for Wales and 2019 (cycle 2) for England. Classifications are valid until they are next assessed; therefore, for years where a country does not report, their latest available data are carried forward.
- The percentage of water bodies in each status classification has been calculated based on the total number of that type of water body assessed in each year.
- The total number of water bodies assessed varies slightly from year to year (see Table 2).
- The 2013, 2014 and 2015 data are not entirely like-for-like due to the time differences in phasing in the reporting to Cycle 2 standards. It also means that data from 2014 onwards are not directly comparable to those in earlier years.
- Wales adopted Cycle 3 reporting of the WFD for 2021 data.
- This year’s update includes revisions to the time series data to correct errors found in the England, Scotland and Wales data.
Table 1: Percentage of surface water bodies awarded each status classification in 2024; by country and water body type
| Country | Ecological status | Rivers and canals | Estuaries and coastal | Lakes | All water bodies |
|---|---|---|---|---|---|
| England | High | 0% | 0% | 0% | 0% |
| England | Good | 16% | 29% | 14% | 16% |
| England | Moderate | 62% | 65% | 74% | 64% |
| England | Poor | 19% | 3% | 11% | 17% |
| England | Bad | 3% | 3% | 1% | 3% |
| England | Total number of water bodies | 3,900 | 166 | 589 | 4,655 |
| Scotland | High | 9% | 30% | 31% | 14% |
| Scotland | Good | 38% | 66% | 17% | 40% |
| Scotland | Moderate | 24% | 2% | 22% | 20% |
| Scotland | Poor | 15% | 1% | 13% | 13% |
| Scotland | Bad | 14% | 0% | 17% | 12% |
| Scotland | Total number of water bodies | 2,410 | 505 | 334 | 3,249 |
| Wales | High | 0% | 2% | 1% | 0% |
| Wales | Good | 45% | 31% | 24% | 41% |
| Wales | Moderate | 43% | 65% | 61% | 46% |
| Wales | Poor | 10% | 2% | 13% | 10% |
| Wales | Bad | 2% | 0% | 2% | 2% |
| Wales | Total number of water bodies | 726 | 55 | 114 | 895 |
| Northern Ireland | High | 0% | 0% | 0% | 0% |
| Northern Ireland | Good | 29% | 40% | 24% | 29% |
| Northern Ireland | Moderate | 60% | 56% | 29% | 59% |
| Northern Ireland | Poor | 10% | 4% | 33% | 11% |
| Northern Ireland | Bad | 1% | 0% | 14% | 1% |
| Northern Ireland | Total number of water bodies | 449 | 25 | 21 | 495 |
| UK | Total number of water bodies | 7,485 | 751 | 1,058 | 9,294 |
Source: Department of Agriculture, Environment and Rural Affairs for Northern Ireland; Environment Agency; Natural Resource Wales; Scottish Environment Protection Agency.
Notes about Table 1
- This indicator was updated in 2024 with new data for Scotland, Wales and Northern Ireland. To calculate totals for the 2024 data point, the most recent classification data available at the time of publication was: 2023 (cycle 3) for Scotland; 2024 (cycle 3) for Northern Ireland; 2024 (cycle 3) for Wales and 2019 (cycle 2) for England. Classifications are valid until they are next assessed; therefore, for years where a country does not report, their latest available data are carried forward.
- This table was presented as the number of surface water bodies rather than the percentage of surface water bodies up to and including the 2018 publication.
Table 2: The number of water bodies assessed 2009 to 2024
| Year | Total number of UK water bodies assessed |
|---|---|
| 2009 | 10,801 |
| 2010 | 10,758 |
| 2011 | 10,777 |
| 2012 | 10,719 |
| 2013 | 10,764 |
| 2014 | 10,802 |
| 2015 | 9,297 |
| 2016 | 9,299 |
| 2017 | 9,298 |
| 2018 | 9,301 |
| 2019 | 9,300 |
| 2020 | 9,300 |
| 2021 | 9,290 |
| 2022 | 9,290 |
| 2023 | 9,290 |
| 2024 | 9,294 |
Source: Department of Agriculture, Environment and Rural Affairs for Northern Ireland; Environment Agency; Natural Resource Wales; Scottish Environment Protection Agency.
Relevance
Surface waters with good status support a diverse assemblage of aquatic invertebrates, fish, mammals and birds. The WFD aims to improve and integrate the way water bodies are managed throughout the UK. The UK aims to reach good chemical and ecological status in inland and coastal waters by 2027 at the latest. The UK is striving to improve and protect the condition of the water environment, and objectives to improve and protect each water body have been set, as well as measures defined to ensure the objectives are met.
International/domestic reporting
The suite of UK Biodiversity Indicators has been revised and updated to bring it in line with the Kunming-Montreal Global Biodiversity Framework (GBF) of the Convention on Biological Diversity (CBD). Some UKBIs will be used for the forthcoming UK national reports to CBD.
Web links for further information
- GOV.UK website on Improving water quality
- EIONET: European Topic Centre on Inland, Coastal and Marine waters on Ecological and chemical status and pressures in European waters
- European Commission’s website on the Water Framework Directive
- European Environment Agency’s website on Waterbase – WISE
- Environment Agency’s website on River Basin Management Plans and River Basin Management Plans updated 2022
- Natural Resources Wales’ website on The Water Framework Directive
- Natural Resources Wales’ website on River Basin Management Plans 2015 - 2021
- Northern Ireland Environment Agency’s website on the River Basin Plan
- Department of Agriculture, Environment and Rural Affairs’ website on River Basin Management Planning
- Scottish Environment Protection Agency’s website on Monitoring and classification
- Scottish Environment Protection Agency’s website on Water Bodies Data Sheets
Acknowledgements
Thank you to the many people who have contributed by providing data and to the many colleagues who have helped produce this indicator.
Technical Annex
Methodology
In the UK, WFD status classification is based on information obtained from monitoring of water quality and biological elements in both long-term surveillance networks and more risk-based operational networks. The programme of monitoring that takes place in a given period is informed by the results of the previous cycle of monitoring and risk assessments. Where it is known with high certainty that a water body is in a good or less-than-good status, monitoring effort can be refocused to areas at higher risk. This helps to target resources where they are needed most in the environment.
Surveillance water bodies are monitored more comprehensively. One objective of surveillance monitoring is to look for signs of impact from pressures in order to validate risk assessments and provide a consistent, long-term monitoring network of sites. At water bodies chosen for the surveillance network, data collectors aim to monitor all quality elements over a river basin management plan cycle.
If there are no sampling data for a particular classification period, results from previous classifications may be rolled-over into the classification assessment. For example, river phosphorus results are calculated from data from the previous three years. If there are no data in that sampling period, the last classification assessment is rolled forward.
The introduction of new WFD monitoring data and classification standards in 2014 (including a new baseline adopting all of the new standards, tools, designations and water body boundaries) has led to a step change in the number of water bodies assessed as being in each status classification in following years. It also led to a reduction in the total number of water bodies being assessed because under the new WFD guidance, water bodies below the 10 km 2 catchment area no longer need to be included. The formal reporting of new standards in Cycle 2 and Cycle 3 of the WFD uses the second and third cycle plans published in 2015 and 2023 respectively. In Scotland, refined methods and environmental standards have been used to assess water body condition since 2013. Small numbers of changes to surface water body boundaries occurred throughout the period, and in 2013 groundwater body boundaries were refined to reflect improved understanding.
Table 3 below gives a breakdown of the standards reported by each UK country in the transition to the formal adoption of Cycle 2 in 2015 and Cycle 3 in 2023. The 2013, 2014 and 2015 data presented in Figures 1 and 2 are not entirely like-for-like due to differences in phasing in reporting to the Cycle 2 and Cycle 3 standards by the four countries.
Table 3. Water Framework Directive standards reported by UK countries during the transition from Cycle 1 to Cycle 2 and to Cycle 3
| Country | Reporting year | |||
|---|---|---|---|---|
| Up to and inc. 2013 | 2014 | From 2015 onwards | 2024 | |
| England | Cycle 1 | Cycle 1 | Cycle 2 | Cycle 2 |
| Wales | Cycle 1 | Cycle 1 | Cycle 2 | Cycle 3 |
| Scotland | Cycle 1 | Cycle 2 | Cycle 2 | Cycle 3 |
| N. Ireland | Cycle 1 | Cycle 1 | Cycle 2 | Cycle 3 |
Source: Department of Agriculture, Environment and Rural Affairs for Northern Ireland; Environment Agency; Natural Resource Wales; Scottish Environment Protection Agency.
Information on the objectives to improve and protect each water body, as well as measures defined to ensure the objectives are met, can be found for each of the four UK countries on their respective websites (see web links for further information).
Background
The WFD came into force in December 2000. It requires the protection and improvement of the water environment, through river basin management plans. These plans set environmental objectives for water bodies and set out programmes of measures to achieve those objectives. These regulations require all four UK countries to plan and deliver a better water environment. There are a number of water quality objectives in the WFD for all UK countries, and key aspects are:
- Aquatic ecology and water chemistry.
- The impact of physical modification of water bodies.
- Specific unique and valuable habitats (protected sites).
- Drinking water resources.
- Bathing waters and coastal waters use for shellfish aquaculture.
The WFD specifies the quality elements that can be used to assess the surface water status of a water body. Quality elements can be biological (e.g. fish, invertebrates and plants), chemical (e.g. heavy metals, pesticides and nutrients) or indicators of the condition of the habitats and water flows and levels (e.g. presence of barriers to fish migration and modelled lake level data). Under WFD the one-out-all-out approach means that if just one quality element fails good status, the overall water body classification will be less than good. Classifications indicate where the quality of the environment is good, where it may need improvement and what may need to be improved. They can also be used, over the years, to plan improvements, show trends and monitor progress.
The ecological status of UK surface water bodies is a measure that looks at both the biological and habitat condition status of a water body. Some small differences exist in the way the administrations and environment agencies implement the methods and tools for assessing water body status.
Development plan
Since our previous publication we have adapted the language and visualisations used in this indicator. We are keen to hear from our users about these changes, as well as our published development plan, please email us.
Categories:
Published: