Expenditure on UK and international biodiversity
Last updated: 2025
Latest data available: 2023/2024
Introduction
The methods for this indicator have been revised since the previous publication to increase its alignment with the monitoring framework for the Kunming-Montreal Global Biodiversity Framework (GBF) of the Convention on Biological Diversity (CBD).
The first part of this indicator provides real-term, public sector spending on biodiversity in the UK, with the focus being on biodiversity and/or nature conservation. Spending is just one way of assessing the government’s commitment to biodiversity. The methods for this part of the indicator have not been changed since the previous publication, but alternative data sources are being investigated (see Technical annex for more detail).
The second part of this indicator provides real-term spending by non-governmental organisations (NGOs) and private sector spending, again with a focus on biodiversity and/or nature conservation. The methods for this part of the indicator, which previously focused on spending by NGOs, have been adjusted to include additional sources of spending from the private sector.
The third part of this indicator provides real-term UK public sector spending on global biodiversity. Funding for international biodiversity is essential for the implementation of the Convention on Biological Diversity, along with other international biodiversity policy commitments. This part of the indicator is being developed and includes data based on methods used in the previous publication, alongside data from alternative and additional sources.
Where total expenditure figures in this indicator are presented as financial year data, the years 2023/2024, for example, refer to the period April 2023 to March 2024.
This indicator is presented at the UK level and is being published with some revised methods as part of the UK’s response to the GBF. This indicator relates to GBF Goal D and Target 19.
Data for this indicator can be found in the published datafile. We also have a similar indicator at the England level.
2025 update – public sector spending on biodiversity in the UK and UK public sector spending on global biodiversity
The 2022/23 and 2023/24 data for this indicator should be interpreted with caution. There are over 20 organisations that this indicator sources data from. The data may be published by some of those organisations, but the method used is to collect data directly from the organisations, specifically at the individual or contact level within those organisations. Response rates have been lower this year and last year resulting in less complete data and more assumptions being needed. This increases uncertainty in the final estimates. Please refer to the section ‘Caveats and Limitations’ for details on how non-response data have been treated.
Type of indicator
Pressures indicator
Type of official statistics
Official statistic - Public sector expenditure on biodiversity in the UK, and Non-governmental organisation and private sector spending on biodiversity in the UK.
Official statistic in development - UK public sector expenditure on international biodiversity. This measure is being developed further to explore alternative and additional data sources, as part of the UK’s commitment to the GBF. Comments and feedback on the methods chosen are welcome: please email us. For more information, please visit the UK Statistics Authority’s website on types of official statistics – UK Statistics Authority.
Contents
- Assessment of change
-
Key results
- Figure 1: Public sector expenditure on biodiversity in the UK, 2000/2001 to 2023/2024
- Figure 2: Non-governmental organisation (NGO) and private sector expenditure on biodiversity in the UK, 2010/2011 to 2023/2024
- Figure 3: UK public sector expenditure on international biodiversity, 2001/2002 to 2023/2024, based on the previous methododology for this measure, and using a new expanded methodology that includes alternative and additional data sources (A), with a breakdown of categories for the new expanded methodology (B)
- Further detail
- Acknowledgements
- Technical Annex
Assessment of change
Assessment of change in public expenditure on biodiversity in the UK and non-governmental organisation and private sector spending on biodiversity in the UK.
| Measure | Assessment | Time period | Result |
|---|---|---|---|
| Public sector expenditure on biodiversity in the UK | Long term | 2000/2001 to 2023/2024 | Improving |
| Public sector expenditure on biodiversity in the UK | Short term | 2018/2019 to 2023/2024 | Improving |
| Non-governmental organisation and private sector spending on biodiversity in the UK | Long term | 2010/2011 to 2023/2024 | Improving |
| Non-governmental organisation and private sector spending on biodiversity in the UK | Short term | 2018/2019 to 2023/2024 | Improving |
Notes on the indicator assessment
- The long-term and short-term assessment of these measures is based on a 3% rule of thumb. The base years for these assessments use a three-year average. See Assessing Indicators.
- As the measure on UK public sector expenditure on international biodiversity is an official statistic in development, an assessment of change has not been carried out.
Key results
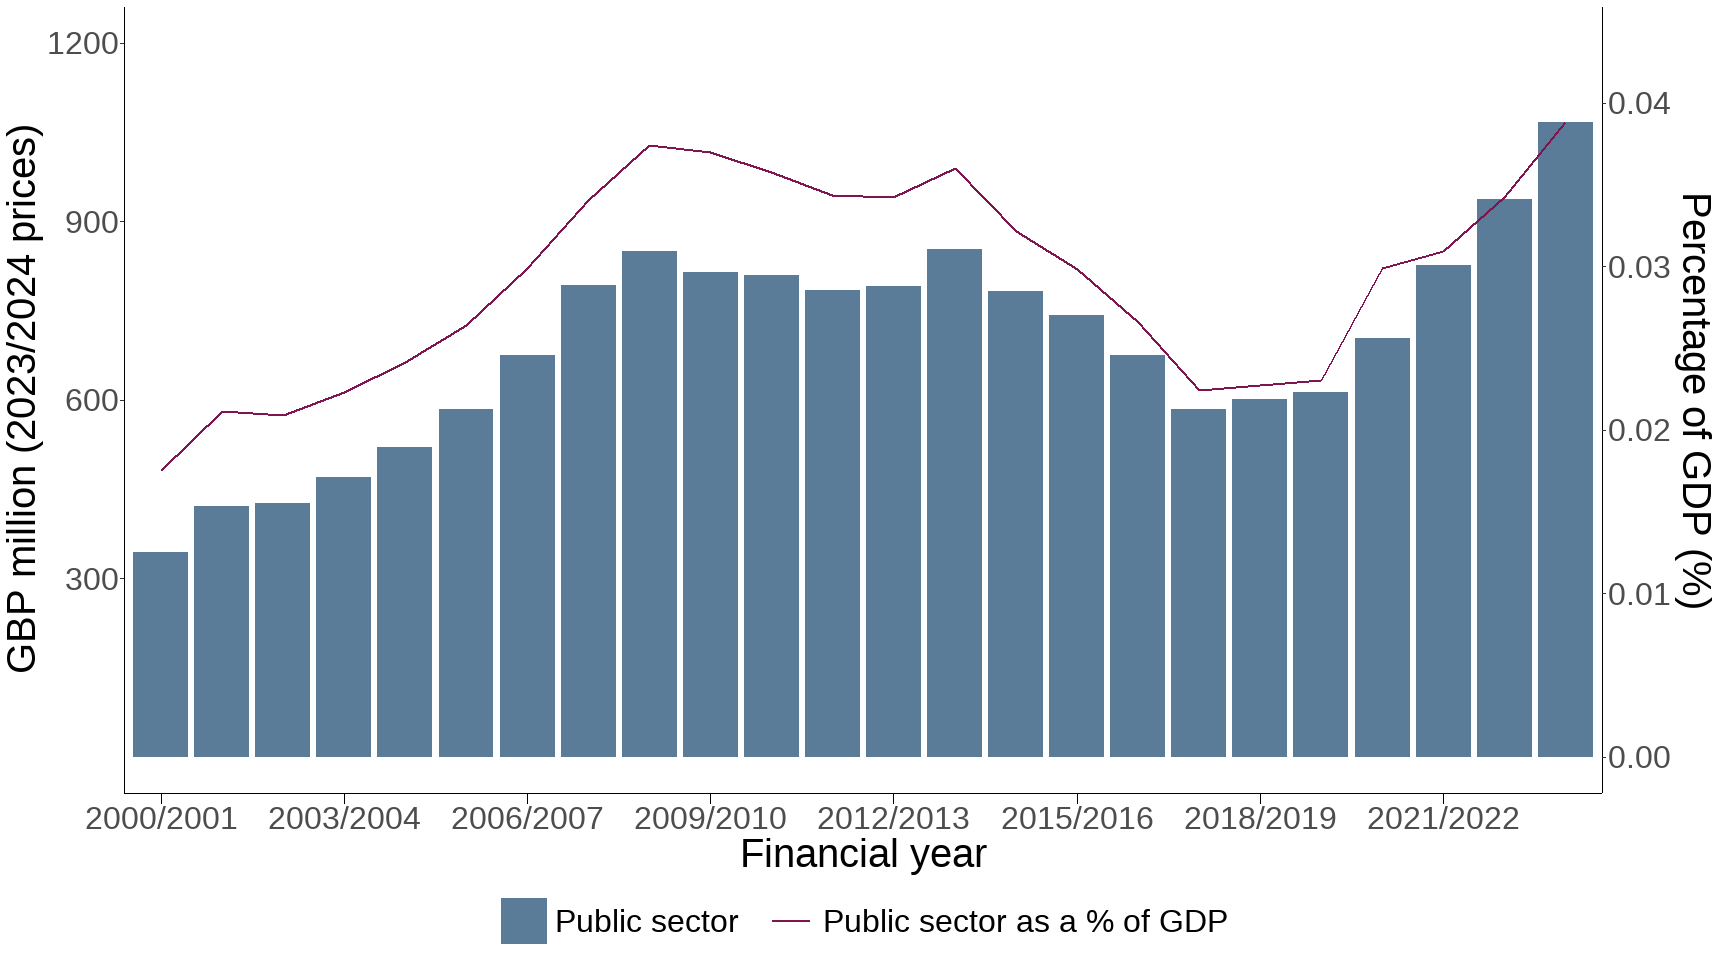
In 2023/2024, around £1.07 billion (£1066 million) of UK public sector funding was allocated to biodiversity in the UK. This figure equates to real-term increases of 210% since the time series began in 2000/2001 and 14% in the latest year for which data have been compiled, and a real-term increase of 77% over the last five years (Figure 1). Increases in spending in the most recent year with data were most marked in agri-environment schemes, as well as Natural England and the Environment Agency (see Further detail section).
Since 2000/2001, public sector funding for UK biodiversity relative to gross domestic product (GDP) has fluctuated between 0.018% and 0.039%. In 2023/2024, it amounted to 0.039% of UK GDP (Figure 1).
Figure 1: Public sector expenditure on biodiversity in the UK, 2000/2001 to 2023/2024
Source: Defra, JNCC, HM Treasury
Notes about Figure 1
- Data are adjusted for the effects of inflation using the UK Gross Domestic Product (GDP) deflator. Data presented here are not directly comparable to those in previous publications because a new deflator is used to prepare each annual update.
- There may be some inconsistencies in the reporting of expenditure on UK biodiversity from one year to the next (see Technical annex section below for further details).
- Revisions to past data series resulting from improved methodology or access to additional data can mean the chart (and figures) are not directly comparable to those presented in previous publications.
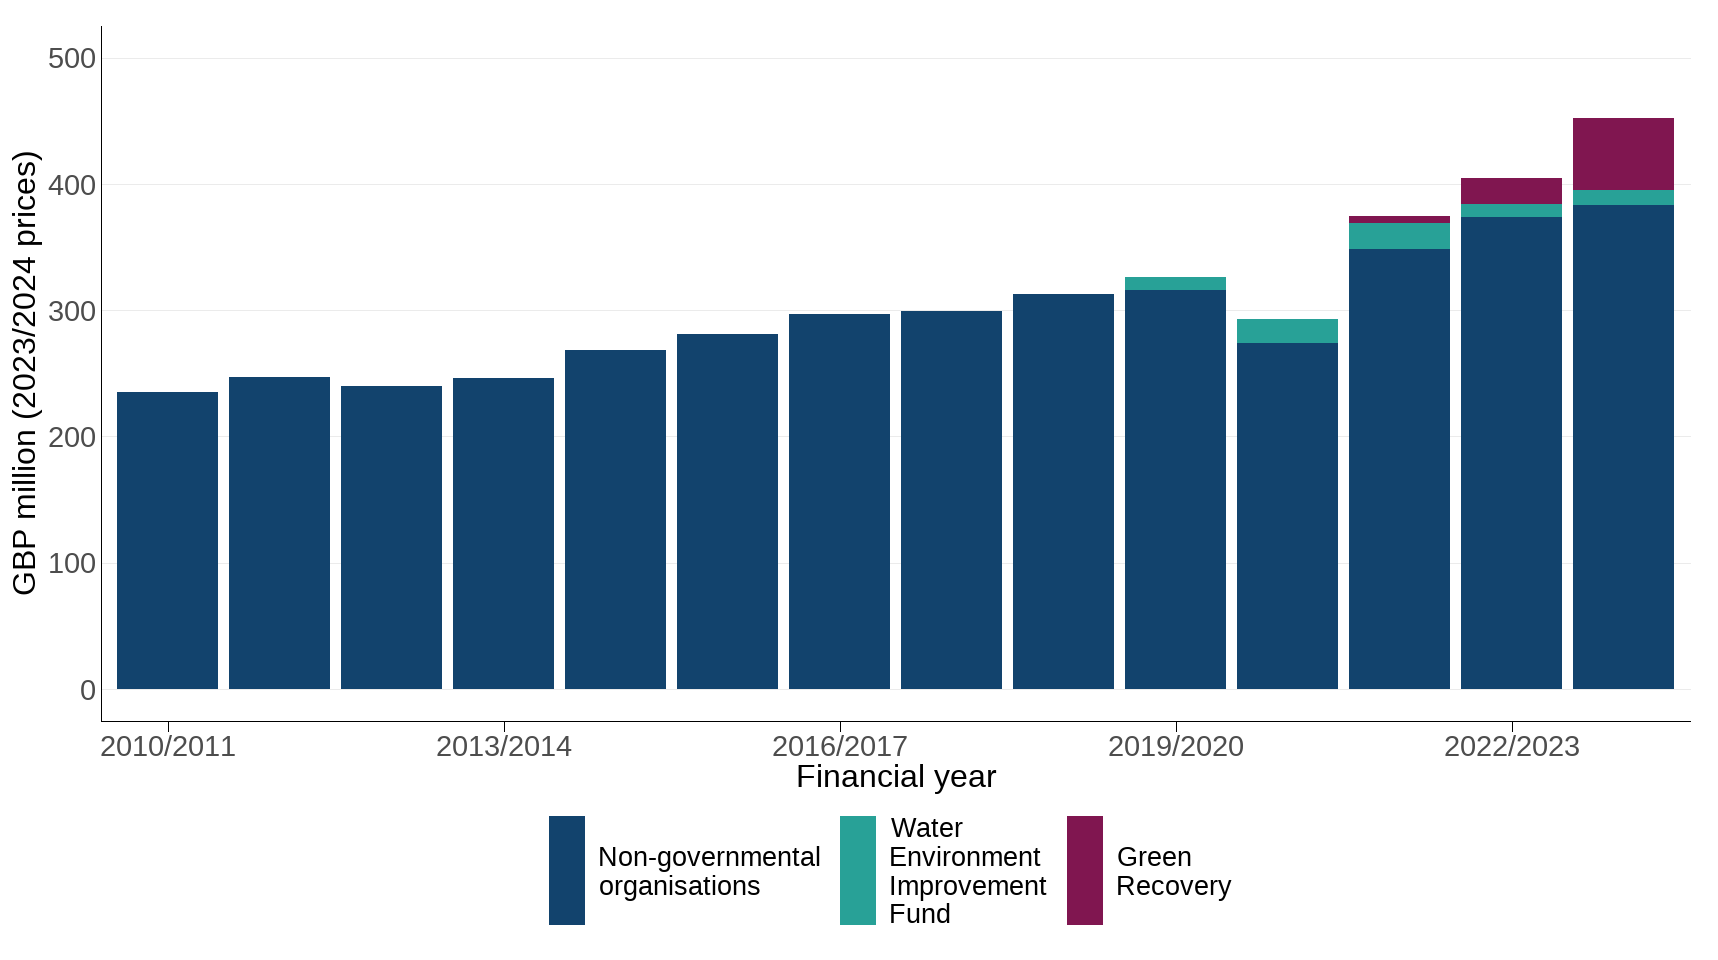
Spending on biodiversity in the UK by non-governmental organisations (NGOs) and the private sector with a focus on biodiversity and/or nature conservation was around £452 million (net of government funding) in 2023/2024 (Figure 2). This figure represents a real-term increase of 92% since the time series began in 2010/2011, and real-term increases of 44% over the last five years and 12% in the latest year for which data have been compiled. This part of the indicator is based on spending by environmental NGOs, supplemented by data from the Environmental Improvement Plan for 2019/2020 onwards. A principal reason for the increase in spending in the most recent year is the inclusion of the Green Recovery Fund.
Figure 2: Non-governmental organisation (NGO) and private sector expenditure on biodiversity in the UK, 2010/2011 to 2023/2024
Source: Defra, JNCC, HM Treasury
Notes about Figure 2
- Data are adjusted for the effects of inflation using the UK Gross Domestic Product (GDP) deflator. Data presented here are not directly comparable to those in previous publications because a new deflator is used to prepare each annual update.
- Wherever possible, NGO spend is net of government funding.
- There may be some inconsistencies in the reporting of expenditure on UK biodiversity from one year to the next (see Technical annex section below for further details).
- Revisions to past data series resulting from improved methodology or access to additional data can mean the chart (and figures) are not directly comparable to those presented in previous publications.
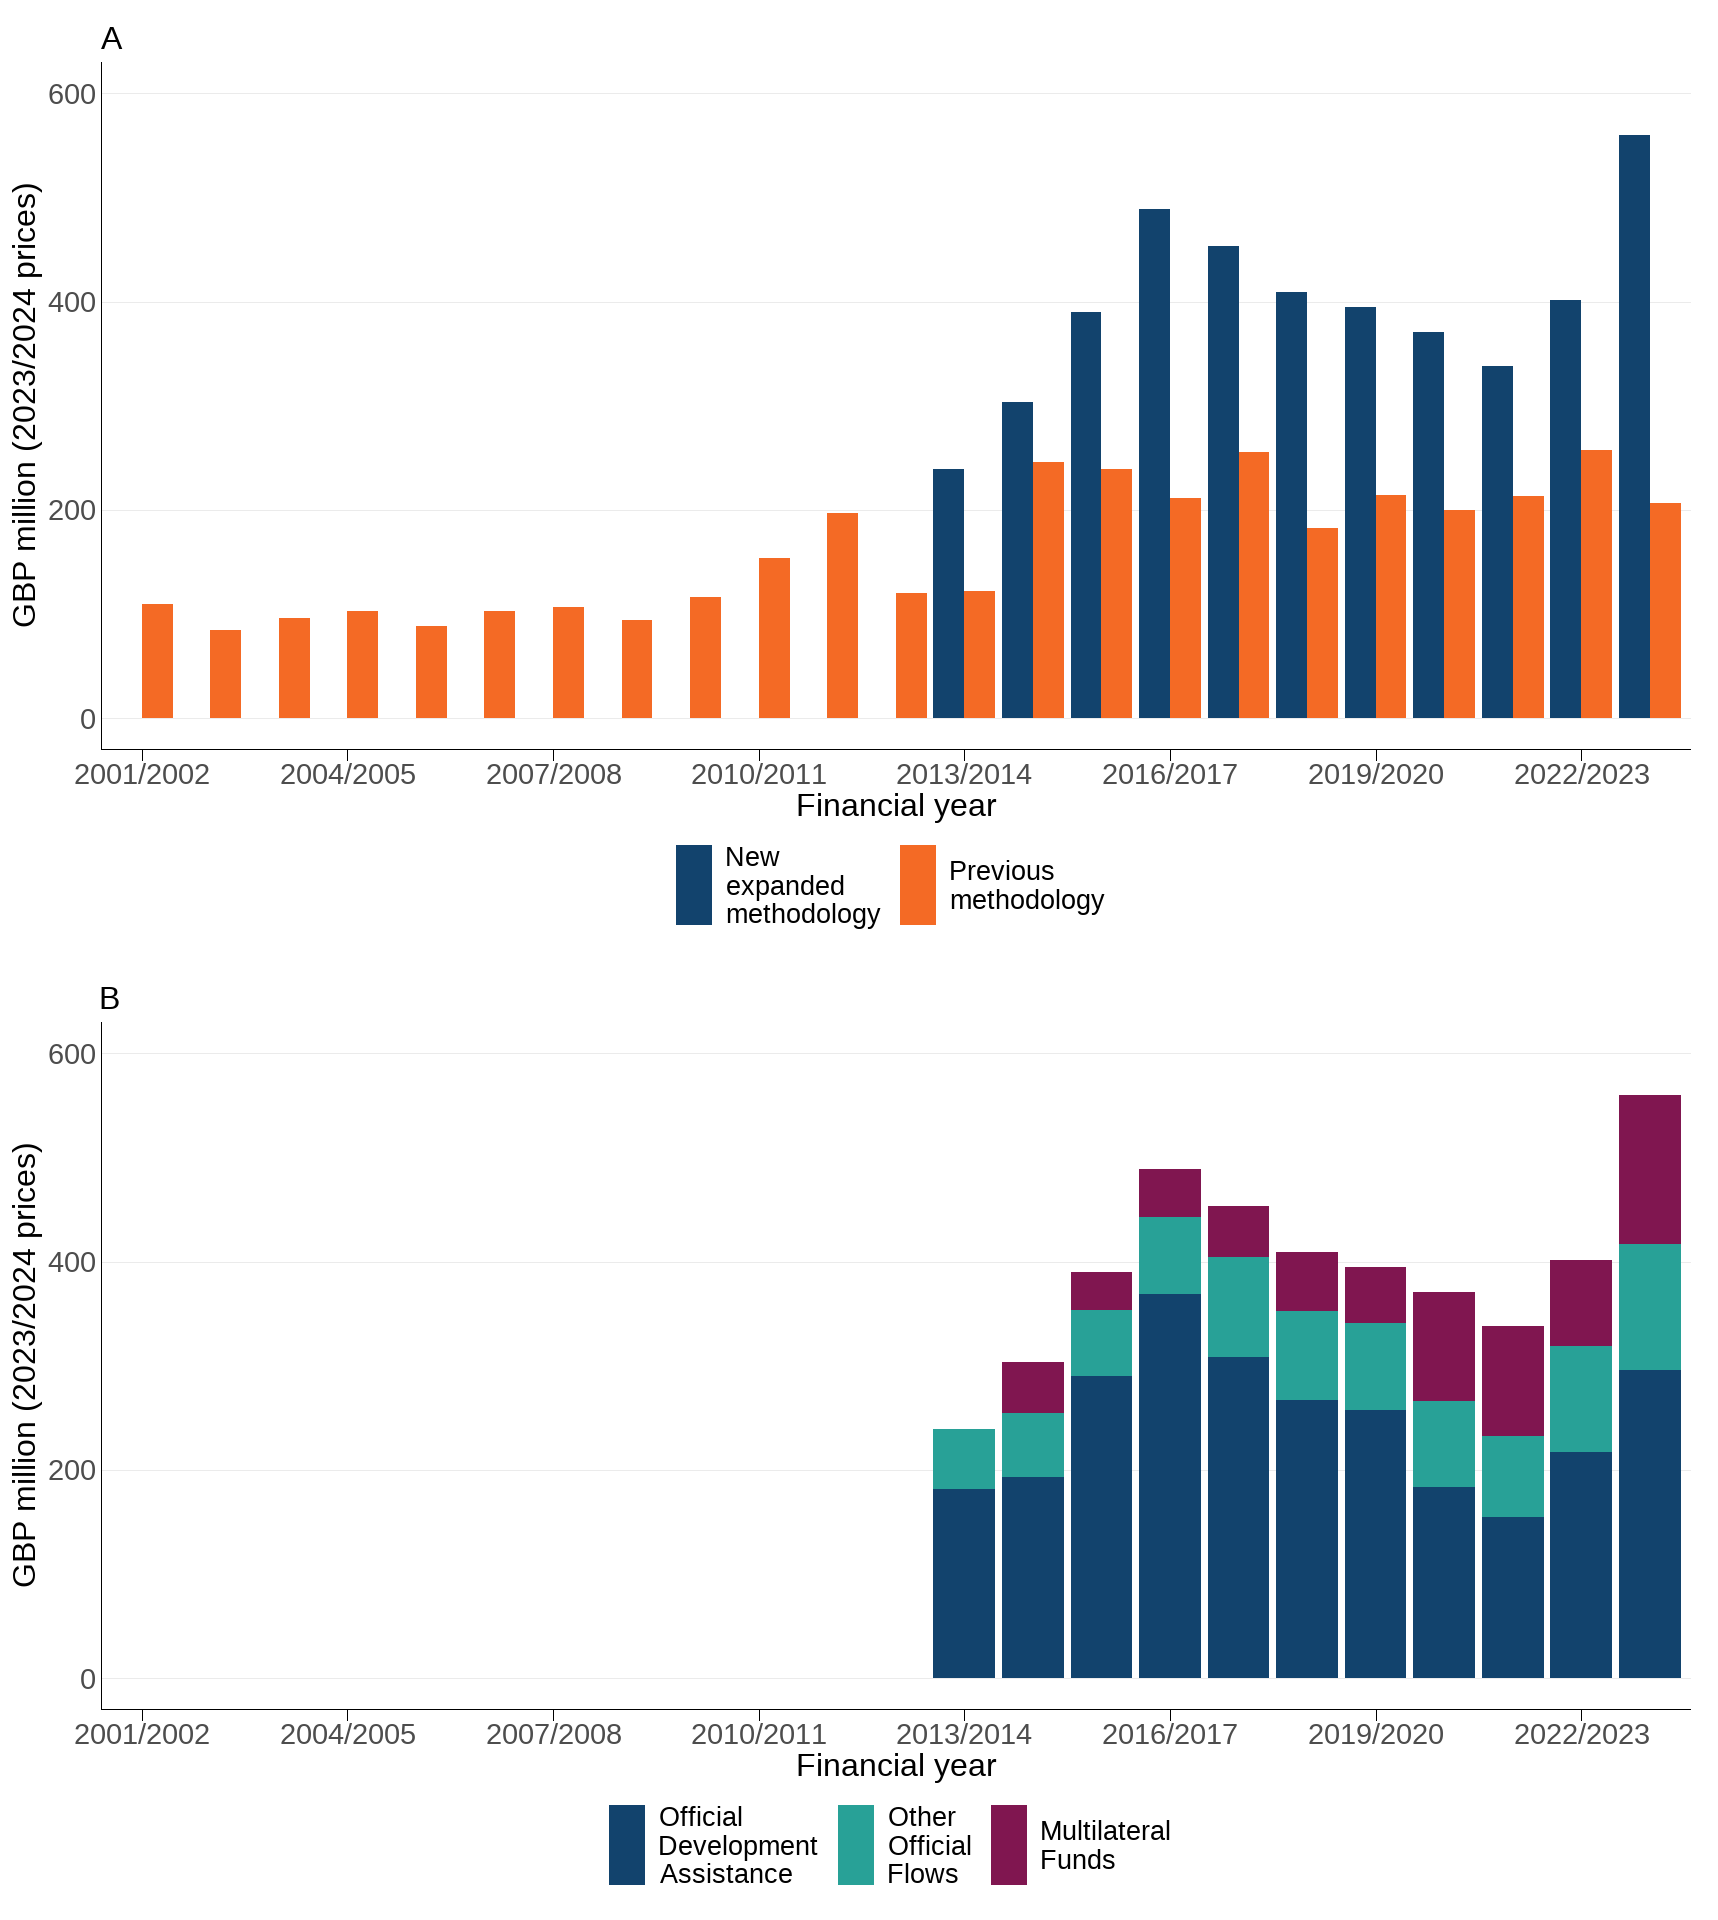
Based on data gathered using previous methods for the indicator, in 2023/2024 UK public sector funding for international biodiversity totalled around £207 million. This figure equates to a real-term increase of 89% since the time series began in 2001/2002 and real-term increases of 13% over the last five years and a decrease of 20% in the latest year for which data have been compiled (Figure 3A). Annual changes in this measure are influenced greatly by the irregular nature of (i) contributions to the Global Environment Facility (GEF) and (ii) other Official Development Assistance (ODA) funding.
For this measure, data from alternative and additional sources are shown alongside the established method in Figure 3A. These include data for ODA from the Organization for Economic Co-operation and Development (OECD), supplemented by figures collated within the UK for Other Official Flows (OOF), and from a number of types of multilateral flows (MF).
Based on data from alternative and additional sources, in 2023/2024 UK public sector funding for international biodiversity totalled around £560 million. This figure equates to a real-term increase of 134% since the time series began in 2013/2014 and real-term increases of 37% over the last five years and 39% in the latest year for which data have been compiled (Figures 3A and 3B). As with data collected using the previous methods, annual changes in this measure are influenced greatly by the irregular nature of (i) contributions to the Global Environment Facility (GEF) and (ii) other Official Development Assistance (ODA) funding.
The two methods shown in Figure 3 overlap in their inclusion of ODA, OOF and MF, but the data from alternative and additional sources broaden the scope of what is captured in the measure.
Figure 3: UK public sector expenditure on international biodiversity, 2001/2002 to 2023/2024, based on the previous methododology for this measure, and using a new expanded methodology that includes alternative and additional data sources (A), with a breakdown of categories for the new expanded methodology (B)
Source: Defra, JNCC, HM Treasury
Notes about Figure 3
- Data are adjusted for the effects of inflation using the UK Gross Domestic Product (GDP) deflator. Data presented here are not directly comparable to those in previous publications because a new deflator is used to prepare each annual update.
- There may be some inconsistencies in the reporting of expenditure on international biodiversity from one year to the next (see Technical annex section for further details).
- The step change in 2014/2015 in the data from the previous methods is due to increased ODA funding for biodiversity related projects.
- GEF and other ODA expenditure are reported by calendar year; they have been allocated to the financial year beginning in each relevant calendar year, for example, 2020 data are included in 2020/2021.
- Revisions to past data series resulting from improved methodology or access to additional data can mean the chart (and figures) are not directly comparable to those presented in previous publications. Figure 3A shows the data as collected following the previous method alongside the data from additional and alternative sources, while Figure 3B shows a breakdown of the data from alternative and additional sources by category.
- The alternative data series shown in Figures 3A and 3B includes Official Development Assistance (ODA), Other Official Flows (OOF) and Multilateral Flows (MF). The Multilateral flows include data from the Global Environment Fund (GEF), Global Climate Fund (GCF), Global Biodiversity Framework Fund (GBFF), Forest Investment Programme (FIP), and Nature, People and Climate (NPC) programme.
- The alternative data series starts in 2013/2014 as that is when the Rio Markers for Biodiversity for the ODA part of the dataset became widely used.
- The large fluctuations between years are mostly due to the irregular nature of (i) contributions to Multilateral Flows (MF), (ii) contributions to the Global Environment Facility (GEF) and (iii) Official Development Assistance (ODA) funding.
Further detail
Public sector spending on UK biodiversity increased from £343 million in 2000/2001 to a peak of £853 million in 2013/2014 (in 2023/2024 prices) (Figure 1). The value then fell over the next four years to a low of £584 million before peaking again to the highest value of around £1.07 billion in 2023/2024 real-term prices. This latest figure is over triple the level of spending in 2000/2001 when the time series began.
Funding made available to farmers and land managers under agri-environment schemes account for 49% in 2023/2024 of annual public sector spending on biodiversity in the UK, and in 2023/2024 total expenditure apportioned to this indicator under these schemes increased by around £49 million (based on 2023/2024 prices).
The remainder of the observed increase in this year’s indicator is due to increased contributions from a range of public sector organisations, including Natural England and the Environment Agency.
Natural England’s expenditure on biodiversity accounted for about 9% of annual public sector spending on biodiversity in the UK, and in 2023/2024 total actual expenditure increased by around £44 million. Expenditure on biodiversity by the Environment Agency accounted for about 4% of annual public sector spending on biodiversity in the UK, and total actual expenditure increased by around £28 million in 2023/2024. Increases in actual expenditure in 2023/2024 are noted for other organisations, including the Heritage Lottery Fund (an increase of around £21 million) and the Forestry Commission (an increase of around £14 million).
Public sector funding for UK biodiversity relative to GDP has followed a very similar pattern to that of total public sector expenditure. The measure peaked first in 2008/2009 when approximately £3.74 was spent on biodiversity for every £10,000 of GDP and then again, although at a slightly lower level, in 2013/2014 when approximately £3.60 was spent on biodiversity for every £10,000 of GDP (both in 2023/2024 prices) (Figure 1). This figure has now increased to approximately £3.88 per £10,000 of GDP in the latest year of reporting (2023/2024).
The observed increase in spending by NGOs and from other non-public sources on UK biodiversity in 2023/2024 is due to increases in expenditure by a range of organisations, including by the Royal Society of Wildlife Trusts, with an increase of around £8 million in 2023/2024. The inclusion of some data on private sector spend contributes to the increasing trend in the more recent years in the time series.
Overall, UK public sector funding for international biodiversity, based on the previous methods for the measure, increased from £109 million in 2001/2002 to its highest peak of around £257 million in 2022/2023 (2023/2024 prices); a real term increase of 136% (Figure 2). In 2014/2015, the amount of UK public sector funding for international biodiversity more than doubled to £246 million (2023/2024 prices), due to large increases in ODA funding to developing countries and multilateral organisations for forestry related projects. In 2017/2018, it rose to £255 million with troughs being observed in the intervening years due to large changes in this ODA funding stream. The irregular timing of large contributions to the GEF, a multilateral trust fund that supports a wide range of projects in developing countries also adds to the annual fluctuations in this indicator. These projects cover a diverse range of themes that include biodiversity, climate change, chemicals and waste, land, international waters, and sustainable forest management.
Based on the alternative and additional data for UK public sector funding for international biodiversity, for which reliable data are available from 2013/2014 onwards, spend increased from around £239 million in the first year (2023/2024 prices) to a peak of around £489 million in 2016/2017. This was followed by annual decreases to around £338 million in 2021/2022, after which spend has increased to a new peak of around £560 million in 2023/2024.
Relevance
Spending is just one way of assessing the priority that is given to biodiversity within government. Funding for conservation work is critical to delivery of country biodiversity and environment strategies. Adequate access to resources is essential for the effective implementation of the Convention on Biological Diversity, along with other international biodiversity policy commitments, as part of more general development aid and poverty alleviation.
The changes in public sector expenditure in the UK should be considered in the context of the funding needed, in tandem with appropriate policy and legislative measures, to meet UK and international biodiversity targets.
International/domestic reporting
The UK Biodiversity Indicators have been reviewed in response to the latest goals and targets agreed under the Kunming-Montreal Global Biodiversity Framework (GBF) of the Convention on Biological Diversity (CBD). The indicators have been adapted, with some new indicators developed, to better align them with the monitoring framework for the GBF. The suite of biodiversity indicators has therefore changed ready for UK national reports to CBD in 2026 and 2029.
Methods for the measure on non-governmental spending on UK biodiversity have been modified to include some private sector funding, and alternative and additional data are shown for UK public sector spending on global biodiversity. The intention is for these modifications to better align the measures with the requirements of the GBF monitoring framework, specifically to align with GBF headline indicators D3 and D1, respectively, relevant to Goal D and Target 19. Potential modification of the measure on public sector spending on UK biodiversity is also being investigated in relation to GBF headline indicator D2.
Web links for further information
Acknowledgements
Thank you to the many people who have contributed by providing data and to the many colleagues who have helped produce this indicator.
Technical Annex
Section 1 describes the methodology used in determining estimates of UK public sector spending on biodiversity in the UK.
Section 2 describes the methodology used to bring together data on UK biodiversity spend internationally.
Section 3 describes the methodology used to determine estimates of spending by non-governmental organisations (NGOs) and the private sector, with a main focus on biodiversity and/or nature conservation, in the UK.
In all three sections: The indicators are based on a combination of estimates and expert opinion with judgment employed to finalise some components of the total. The figures should be taken as approximate.
Section 1: Public sector spending on biodiversity in the UK
Methodology
All total expenditure figures in this indicator are presented as financial year data and 2023/2024, for example, refers to the period April 2023 to March 2024.
Two main sources are used to obtain information for the indicators from a wide range of government organisations: 1) departmental annual reports; and, 2) expert contacts in the relevant organisations.
Spending on biodiversity is disaggregated where possible between:
-
Spending directly on nature reserves and conservation measures.
-
Related spending on administration and training.
-
Relevant research and development.
-
Transfer payments to other organisations (in order to remove double counting of financial flows).
Direct conservation consists of activities that directly protect and promote variety among living organisms. However, direct action is often ineffective unless supported by a range of other activities such as research and development, education and publicity, or even simply administration. Sources of information may not always distinguish between these elements and it is necessary to exercise judgment as to when an item should be included or not, or whether the relevant component relating to direct action should be estimated by expert judgment or by reference to other information. For simplicity, the staff costs associated with implementing biodiversity focused programmes within large organisations are not included.
In practice, because biodiversity spending is not always separately identified within the available sources, or if a single expenditure item includes biodiversity and non-biodiversity elements, an aspect of judgment is sometimes required. One particular example is the treatment of expenditure through the four countries’ (England, Scotland, Wales and Northern Ireland) agri-environmental schemes, where an estimate is made of the proportion of total scheme spending that is biodiversity-related.
Given the large number of UK public sector organisations funding activities related to biodiversity and the complexities involved in both defining and identifying relevant expenditure, the figures presented in this indicator are likely to be an underestimation of total biodiversity spend by the UK public sector. They do however provide a clear trend of expenditure on biodiversity since the beginning of 2000/2001.
A further difficulty is that many expenditure items are designed to meet more than one policy objective: an example is tree planting, which promotes biodiversity but might be largely driven by a demand for landscaping. In practice, the assessment by relevant experts of the appropriate share of any spending which can be attributed to biodiversity needs to take into account issues such as the quality of conservation measures and the original intentions of the expenditure.
Finally, given the time period covered by this indicator, it is inevitable that government organisations will be restructured, funding streams will change, projects will come to an end and/or new projects will begin and some biodiversity related expenditure will be outsourced to external organisations. Therefore, although every effort is made to consistently report annual expenditure, there are likely to be some differences in the coverage of the indicator from one year to the next.
Definitional issues concerning spending on biodiversity in the UK
Access to the countryside
Expenditure on providing access to the countryside has generally been regarded as being for the benefit of society rather than in support of biodiversity. An exception is made for spending on nature reserves, which will include spending on visitor centres and footpaths, but which can be regarded as being for educational and fund-raising purposes. Where expenditure on access is identifiable (for example, expenditure by the Forestry Commission which is specifically allocated to access but not to nature reserves) this is excluded.
Expenditure on National Parks
Much of the spending by the 15 National Parks in England, Scotland and Wales is geared towards services for the public, including access, landscaping etc. However, some specific expenditure in the form of contributions to Local Biodiversity Action Plans (LBAPs) and other activities has been identified. There is also some relevant expenditure that is funded by the agriculture departments in each country. It has not been possible to gather biodiversity-related expenditure from the majority of National Parks due to various reasons but expenditure on agri-environment schemes within National Parks by each country’s relevant departments is captured.
Natural resource management
The following spending is excluded on the grounds that it is aimed at managing the use of the environmental assets for the economy, rather than for the protection and enhancement of biodiversity:
-
Spending by the Environment Agency on water abstraction licenses.
-
Spending by the Centre for Environment, Fisheries and Aquaculture Science (CEFAS) on the management of the fishing industry.
-
Spending by the Forestry Commission on the management of commercial forests.
Forestry Commission expenditure
Gross expenditure by the Forestry Commission is included, in respect of the broad objective that includes biodiversity in the annual accounts for the Forestry Commission in England, Wales and Scotland; each includes a diverse range of activities in addition to the biodiversity-related activities outlined below. A typical activity is the expansion of native woodland, as this is an important habitat to native animal and plant species. Other activities include management of Sites of Special Scientific Interest (SSSIs), creating linkages to isolated woodland remnants and woodland glade management for key moth and butterfly species living in the forests.
Road schemes
Biodiversity protection expenditure has not in the past been separately estimated by the Highways Agency (for the Department for Transport). However, since 2005/2006 the Agency has had a separate budget specifically allocated to the overall achievement of the Biodiversity Action Plan targets. It is believed that prior to 2005/2006, the (unallocated) spending on biodiversity was significantly lower. No estimates have been made for these years, therefore some discontinuity will occur.
Landscape
Estimates of expenditure on land management regarding SSSIs, National Nature Reserves and other protected land areas are included. However, wherever possible expenditure relating to landscaping is excluded, as the main focus of this activity is for aesthetic reasons.
Spending by police forces on Wildlife Crime Units
The only Wildlife Crime Units are the National Wildlife Crime Intelligence Unit in the National Criminal Intelligence Service, mainly funded by Defra, and the Wildlife Crime Unit in the Metropolitan Police.
Other police forces do have individuals who are wildlife crime leads in their area; in some cases these may be referred to as units. Some officers work full time as wildlife crime officers, others incorporate wildlife crime duties in with work on other crime issues. No estimates of these costs are made.
Spending by the Metropolitan Police is difficult to capture as no separate budgets for wildlife crime were allocated until 2004/2005. Costs noted are estimated staff costs supplied by the Metropolitan Police. Spending in earlier years is assumed to be negligible on the understanding that prior to 2004/2005 much of the work was either carried out in the individuals’ own time or while they were engaged in other duties.
Financing issues
EU funding of UK biodiversity
Financing from the EU, for example, funding to agri-environment schemes, is included in this indicator so total figures are for spending on UK biodiversity irrespective of which public body the money comes from.
National Lottery funding
National Lottery funding from both the National Lottery Heritage Fund and the Big Lottery Fund is classified as government spending on the grounds that government bodies decide who and what to fund. The People’s Postcode Lottery is not currently included.
Areas of expenditure on biodiversity in the UK not currently included in this indicator
There are a number of areas where funding for biodiversity in the UK is not currently included in this indicator. Examples of this include spending on local nature reserves and nature conservation by local authorities. Where gaps are identified, they can only be resolved if robust data from reliable sources are available across the entire time series for that particular funding stream, otherwise the trend assessment (particularly over the long term) will be affected.
Assumptions and adjustments made to the data
Where the relevant data are available, expenditure figures relating to biodiversity protection are separated out from general environmental spending. When this breakdown is not possible, estimates are made as to how much of the total spending can be attributed towards biodiversity protection. These estimates are mostly made through contacts within the organisations concerned, ideally by the person responsible for the relevant programme.
Although this process should mean that all relevant spending is captured, it does mean that it is sometimes dependent upon expert judgment which can have limitations. The process by which experts arrive at their judgment may not be documented, and subsequent assessments may not be made on a consistent basis. Also, these experts may have a different view of what constitutes spending on biodiversity and hence the estimates they supply may not always be directly comparable. We do try to maintain consistency by asking experts to explain/justify the reasons for any change in the estimated proportion of spend going on biodiversity.
There are a few cases where it has not been possible to obtain an expert view of the biodiversity-related proportion of the total spend of a scheme. In these cases, a judgment has been made based on the description of the scheme’s priorities.
Indicator assessment
The Gross Domestic Product (GDP) deflator is a measure of general inflation in the domestic economy – it captures the price changes over a period of time. The deflator is expressed in terms of an index number. It is used here to convert historic prices into constant prices, thereby adjusting for the effects of inflation and allowing meaningful comparisons to be made between biodiversity expenditure in different years. The base year is always set to the most recent year of data available in the time series, therefore, data presented in the current publication are not directly comparable to those in previous publications because a new deflator is used to prepare each annual update.
Once the time series for the UK public sector spend indicator has been deflated (to remove the effects of inflation), assessments of trends are made by comparing the difference between the value of the measure in the base year and the value in the end year against a 3% ‘rule of thumb’ threshold. A 3-year average is used to calculate the base year, to reduce the likelihood of any unusual year(s) unduly influencing the assessment. See Assessing Indicators for more information.
Section 2: International biodiversity spend
Definitional issues concerning spending on international biodiversity
Spending in the UK’s Overseas Territories
Public sector spending on international biodiversity includes spending by the UK in the Overseas Territories. Spending on the Overseas Territories Environmental Programme (OTEP) is provided by the Foreign, Commonwealth & Development Office (FCDO), whilst other spending is carried out by Defra, Joint Nature Conservation Committee (JNCC) and the Ministry of Defence (MoD).
Wildlife trade and international wildlife crime
Estimates of departmental costs involved in monitoring and controlling the trade in endangered species (CITES) are included.
Spending on international aid as part of wider initiatives
A number of relevant programmes have been identified and allocated to biodiversity. In the original methodology used, these schemes include Darwin and Darwin Plus (Defra), the Flagship Species Fund (Defra), the Global Opportunities Fund (FCDO) and ODA by way of contributions to the Global Environment Facility (GEF) (DfID, and Defra since 2017/2018 and FCDO since 2021/2022). In the alternative data presented, GEF is included as part of mulitlateral funds. Given the broad coverage of the latter, an assumption is made that 33% of the payments relate to biodiversity in GEF6 (2014-2018) and 7 (2018-2022), with this increasing to 53% for GEF8 (2022-2026). The irregular timing of payments to the GEF also mean that the values reported in this indicator can vary considerably from one year to the next. There are years where no payments are reported and there are years where two payments are reported. Elsewhere within this indicator, payments such as these would be allocated to the appropriate year on an accruals basis, thereby smoothing out any peaks and troughs. Payments to the GEF, however, are recorded with HM Treasury as ODA at the time they are made rather than the period they relate to so it is not possible to apply an accruals approach here.
Areas of expenditure on international biodiversity not currently included in this indicator
The 2025 iteration of this indicator captures the international financial flows most closely associated with the conservation of biodiversity. However, there are additional funding streams that contribute to the achievement of international targets that have not been captured to date. For example, the UK is a world leader in research including that on the natural environment. Whilst this research demonstrates progress towards international targets as well as underpinning action more broadly, not all of it is captured within the figures.
Indicator revisions: Public sector spending on international biodiversity
ODA funding for projects of benefit to biodiversity and forestry
Additional ODA funding for projects of benefit to biodiversity and forestry were included in the international measure for the first time during the 2019 update of this indicator. Given the length of the time series, figures for annual expenditure on these projects were gathered from different sources: first, from data submitted to the OECD for 2002 (2002/2003) to 2005 (2005/2006) and second, from the figures reported to the Convention on Biological Diversity (CBD) for 2006 (2006/2007) to 2016 (2016/2017). Data for 2002 to 2005 were sourced in US dollars and converted into pounds sterling using mid-year exchange rates from HM Revenue & Customs. Some judgement was employed in order to identify the relevant biodiversity and forestry related elements of the total ODA expenditure. Estimates based on the mean of 2002 to 2005 data were used in 2001 (2001/2002) and the time series was shortened by one year in order to overcome the issues of missing data in 2000 (2000/2001). ODA expenditure for 2017 that were due to be reported to the CBD in the final quarter of 2019 were also included in the indicator for 2017/2018.
ODA funding for biodiversity and forestry related projects shows considerable year-on-year variation and given the magnitude of these payments, has a noticeable knock-on effect on the final indicator values. One reason for this is that ODA funding reported in a particular year may relate to multi-year projects. Elsewhere within this indicator, payments such as these would be allocated to the appropriate year on an accruals basis, thereby smoothing out any peaks and troughs. However, like GEF funding, other ODA payments are recorded with HM Treasury at the time they are made rather than the period they relate to, so it is not possible to apply an accruals approach here either.
At the time, compared to the 2018 publication, including this additional ODA funding resulted in real-term increases in the total figures for expenditure on international biodiversity across the entire time series. The magnitude of these increases ranged from £13 million in 2008/2009 to £143 million in 2015/2016 (in 2017/2018 prices). While temporarily put on hold for the 2020 and 2021 updates, it is hoped that future development work will lead to improvements in the overall accuracy of these estimates.
Alternative and additional data sources for the international spend measure
The alternative and additional data shown in Figure 3 is based on three main data sources:
- Official Development Assistance – from the Organization for Economic Co-operation and Development (OECD) Development Assistance Committee (DAC) Creditor Reporting System (CRS). These data are downloaded in USD and converted to GBP, but are at current prices and therefore do not need to be deflated.
- Other Official Flows – consistent with the previous methodology – focussing on data from Kew and Defra. These data are in GBP and need to be deflated before combining them with the other parts of the indicator. The UK GDP deflator is used to ensure data are presented on a consistent basis for each year.
- Multilateral Flows – from Global Climate Fund, Global Environment Fund, Global Biodiversity Framework Fund, Forest Investment Programme, and the Nature, People and Climate (NPC) programme. These data are in GBP and need to be deflated before combination with the other parts of the indicator. The UK GDP deflator is used to ensure data are presented on a consistent basis for each year.
Official Development Assistance
ODA data is downloaded from the OECD DAC CRS. The data need to be downloaded year by year, and then combined into a total dataset. This can then be analysed based on the Rio Markers for biodiversity. The Rio Markers identify which ODA spend is principally for biodiversity (scaling factor 100%), or has a significant impact on biodiversity (scaling factor 40%). These data are downloaded in US Dollars, so have been converted to GBP according to the exchange rates found at the trade-tariff website - for 2025 the rate for December 2024 was used as the last data are for 2024.
Other Official Flows
Public sector spending on international biodiversity includes spending by the UK in the Overseas Territories. Spending on the Overseas Territories Environmental Programme (OTEP) is provided by the Foreign, Commonwealth & Development Office (FCDO), whilst other spending is carried out by Defra, Joint Nature Conservation Committee (JNCC) and the Ministry of Defence (MoD). In addition, Kew Gardens spend a significant sum of money supporting plant conservation abroad. This was captured by the previous indicator – with the vast majority of spend coming from FCDO, Defra and Kew. To simplify the production of this indicator, it has been decided to focus on the funding provided by Defra and Kew as the funding from JNCC and MoD was less than 1% of the combined whole. The funding by FCDO has been considered to be part of the ODA and Multilateral Flows spend. There may be a small overlap of ODA and OOF spend by Defra in these figures, but it is considered to be minor and to be compensated for by removing the JNCC and MoD spend from this component of the indicator. The OOF data need to be deflated and this has been done using the GDP deflator.
Multilateral Flows
The UK is a significant donor to a number of international funds that support work on biodiversity in other countries. These include the Global Environment Fund (GEF), the Global Climate Fund (GCF), the Global Biodiversity Fund, and the Forest Investment Programme (FIP). These data are from the Global Climate Fund, Global Environment Fund, Global Biodiversity Fund, Forest Investment Programme, and the Nature, People and Climate (NPC) programme, with some of the data collated from FCDO.
The irregular timing of payments to the GEF mean that the values reported in this indicator can vary considerably from one year to the next. There are years where no payments are reported and there are years where two payments are reported. Elsewhere within this indicator, payments such as these would be allocated to the appropriate year on an accruals basis, thereby smoothing out any peaks and troughs. Payments to the GEF, however, are recorded with HM Treasury at the time they are made rather than the period they relate to so it is not possible to apply an accruals approach here.
Global Environment Fund (GEF)
It is considered that 33% of contributions to the 6th and 7th replenishments of the Global Environment Facility (GEF) (by DfID and since 2017/2018 Defra, and since 2021/2022 by FCDO) can be considered to support biodiversity. For the 8th replenishment this has been raised to 53%.
Global Climate Fund (GCF)
The basis and frequency of payments by the UK to the GCF is similar. The finance provided to GCF is calculated from promissory notes “received contributions” against which GCF can programme and spend – this is actual money transferred, not the pledge of the total amount to be donated, so this part of the indicator is based on when the money is transferred, not when it is promised.
As with GEF, the attribution of the funds provided that support biodiversity is variable: for 2016-2019 inclusive the figure considered to support biodiversity is 13%. For 2020-2023 the figure is 19%. For 2024 and 2025 the figure is 8%.
The figures provided to GCF are in US Dollars. These are converted to GBP using exchange rate for USD in the trade-tariff website (using the rate for March 2025 not December 2024 as for ODA funds as most recent data are for 2025 not 2024).
The GCF data then need to be deflated. This has been done using the GDP deflator.
Global Biodiversity Framework Fund (GBFF)
Since 2022 the UK has contributed to the Global Biodiversity Framework Fund – in support of the GBF goals and targets.
The funding can be counted as 100% in support of biodiversity.
The GBFF data needs to be deflated. This has been done using the GDP deflator.
Forest Investment Programme (FIP)
The UK, through FCDO, contributed between 2009 and 2016 to the FIP – supporting a variety of forest programmes across the globe. Data for this programme have been provided by FCDO. A 40% scaling factor has been applied, to recognise that the fund provided may not have been fully supportive of biodiversity conservation.
The FIP data needs to be deflated. This has been done using the GDP deflator.
Where possible, the data included in this indicator are reported on a financial year basis; however, contributions to the GEF and other ODA expenditure are reported by calendar year. For the purpose of this indicator, they have been allocated to the financial year beginning in each relevant calendar year, for example, 2022 data are included in 2022/2023.
Nature, People and Climate (NPC) programme
The UK, through FCDO, contributed in 2023 to the NPC programme. This is part of the Strategic Climate Fund within which the FIP also sat. Data for this programme have been provided by FCDO. A 40% scaling factor has been applied, to recognise that the fund provided may not have been fully supportive of biodiversity conservation.
The NPC data needs to be deflated. This has been done using the GDP deflator.
Section 3: Non-governmental organisation and private sector spending on biodiversity in the UK
The measure on spend by NGOs and the private sector is based on biodiversity expenditure by a set of environmental non-governmental organisations, supplemented by data on green finance mobilised through the Environmental Improvement Plan. It has not been possible in the 2025 indicator to include data from philanthropic spend beyond the sort of micro-philanthropy included in donations by individual members of the public to NGOs.
Background
Prior to 2014, the expenditure indicator included in the Biodiversity Indicators publications only covered public sector expenditure, and so did not fully represent total expenditure on biodiversity. In 2014, Defra statisticians developed an additional measure of non-governmental organisation (NGO) spend on biodiversity (net of government funded spend). NGO support for and action on biodiversity is vitally important; capturing the contribution of NGOs is a key element of tracking the UK’s conservation efforts. In addition, this new measure is likely to account for a large part of the funding from businesses and private individuals that is channelled through the NGOs. Including this source of expenditure will give a more complete picture of spending on UK biodiversity.
This indicator is an adjustment of the previous indicator on biodiversity expenditure by non-government organisations. Conceptually It has been expanded to include private sector spend. The intention is to also investigate data sources on philanthropic spend.
The indicator production team have investigated sources of information suggested in the guidance prepared by the CBD Ad-Hoc Technical Expert Group (AHTEG) on Indicators:
- The Organisation for Economic Co-operation and Development (OECD) Development Assistance Committee (DAC) Creditor Reporting System (CRS) includes money mobilised by overseas development assistance – but this has been taken to be relevant to spend on international biodiversity (GBF headline indicator D1) rather than NGO (private sector) spend (GBF headline indicator D3).
- The OECD DAC Secretariat collects individual aid activities on private philanthropy for development in the Creditor Reporting System (CRS) via annual collection directly from private foundations. However, the UK is not listed as a recipient of funds, the donors are institutions rather than countries, and it is not clear if any of the donors are UK based, so it has not been possible to bring in any data for this part of the indicator.
- Biodiversity Finance Initiative (BIOFIN) provides a methodology for identifying philanthropic spend, but the map of projects online does not include the UK.
- The Policy Instruments for the Environment (PINE) database lists instruments, but no information on values mobilised has been found.
None of these sources therefore provide access to data on philanthropic transactions relevant to the UK. It can be argued that the NGO funding already tracked includes micro-philanthropy – donations by individual members of the public – through one-off donations, regular giving, or through wills.
In practice therefore, it has only been possible to expand the scope of the previous indicator a small amount in this publication – by including information provided by Defra on finance mobilised through the green finance initiative under the Environmental Improvement Plan. Most green finance information is either estimates (which are not suitable to include in an official statistic), or are commercial in confidence, so not available publicly.
Methodology
All total expenditure figures presented in this indicator are financial year (that is, April to March) data.
NGO selection
NGOs with a primarily biodiversity or nature focus were selected for inclusion in this indicator. Many of the NGOs selected are members of the Wildlife and Countryside Link. Link is an umbrella body, whose purpose is to bring together voluntary organisations in the UK to protect and enhance wildlife, landscape and the marine environment. Focusing on Link members gives a suite of significant NGOs pre-selected for their focus on biodiversity and nature protection. In addition, 13 of the 47 Wildlife Trusts with the highest annual turnover in England and Scotland have been included in this indicator, as well as NGOs that are not members of Link, but have a biodiversity and/or nature focus (British Trust for Ornithology, The British Association for Shooting and Conservation and the Game & Wildlife Conservation Trust).
A full list of organisations included in the indicator can be found at the end of this section. Organisations that focus on animal welfare or conduct the bulk of their work abroad are included, however expenditure by the three NGOs in the indicator providing the greatest financial contributions to biodiversity in other countries (RSPB, WWF-UK and the Zoological Society of London (ZSL)) has been adjusted accordingly.
Data collection
To avoid placing reporting burdens on NGOs, data is collated predominantly from NGO published annual accounts/financial reports. Almost all of the NGOs included in this indicator are registered as charities and detailed annual financial reports are published on the Charity Commission website. In a small number of cases data, or a more refined estimate of expenditure, is collected from the organisation directly, examples of this include the estimates used to apportion spend by the RSPB, WWF-UK and ZSL between work in the UK and work abroad.
For consistency with the public sector measure, staff costs associated with administrating biodiversity focused programmes are not included.
For the majority of NGOs, the total amount of money spent on ‘Charitable Activities’, documented in the ‘Resources Expended’ section of the ‘Consolidated Statement of Financial Activities’ (present in each NGO annual report) is used as a first estimate of annual biodiversity spend.
In practice, because biodiversity spending is not always separately identified within the available sources, or if a single expenditure item includes biodiversity and non-biodiversity elements, an aspect of judgment is sometimes required.
A further difficulty is that many expenditure items are designed to meet more than one policy objective: an example is tree planting, which promotes biodiversity but might be largely driven by a demand for landscaping. In practice, the assessment by relevant experts of the appropriate share of any spending which can be attributed to biodiversity needs to take into account issues such as the quality of conservation measures and the original intentions of the expenditure.
If organisations fail to supply data in a given year, estimates are made based on the mean of the previous three years data. For the 2025 publication, two organisations failed to supply data/apportionment of expenditure for 2023/2024: The Zoological Society of London (ZSL), and Yorkshire Wildlife Trust.
Avoiding double counting of public sector grants
It is necessary to avoid double counting of grants and other payments (for example, research contracts) coming from the government to NGOs, as these are already accounted for in the public sector measure of the indicator. Many NGOs list grants received and the value of these grants in their statement of financial activities. Where this is the case, it is possible to identify grant providers that are already in the public sector indicator and calculate the proportion of a NGO’s total income that is from these organisations. The first estimate of the NGO’s expenditure on biodiversity is multiplied by the proportion of total income not from these organisations in the appropriate year. This gives a final estimate of biodiversity expenditure funded from non-government sources for each NGO.
Itemised grants are not always available in the published accounts. In most of these cases, no correction is made to the NGO estimate of total expenditure as the contribution of the particular individual NGO to the total NGO spend is very small. In cases where the contribution of an NGO without grant information to the overall indicator is significant (more than 1% of the total expenditure), that organisation is contacted directly to obtain grant information, in order that their estimates of expenditure can be refined.
It has been assumed that grants and expenditure relate to the same time period.
Calculating total NGO expenditure
Total NGO expenditure on biodiversity in the UK is calculated as the sum of the individual estimates of expenditure for all of the NGOs included in the indicator. At present, we have estimated NGO expenditure on biodiversity for the years 2010/2011 through to 2023/2024. In keeping with the public sector measure of this indicator, final estimates of total NGO expenditure are deflated using the UK Gross Domestic Product (GDP) Deflator to ensure spend is expressed in real terms.
Given the time period covered by this indicator, it is inevitable that organisations will be restructured, funding streams will change and projects will come to an end and/or new projects will begin. Therefore, although every effort is made to consistently report annual expenditure, there are likely to be some differences in the coverage of the indicator from one year to the next.
Finally, given the limited number of NGOs included within this measure and the complexities involved in both defining and identifying relevant expenditure, the figures presented in this indicator are likely to be an underestimation of total biodiversity spend by UK NGOs. They do however provide a clear trend of expenditure on biodiversity in the UK since the beginning of 2010/2011.
Spending on international biodiversity by NGOs
Due to internal resource constraints, this work has been limited to domestic biodiversity expenditure in the first instance.
Indicator assessment
The Gross Domestic Product (GDP) deflator is a measure of general inflation in the domestic economy – it captures the price changes over a period of time. The deflator is expressed in terms of an index number. It is used here to convert historic prices into constant prices, thereby adjusting for the effects of inflation and allowing meaningful comparisons to be made between biodiversity expenditure in different years. The base year is always set to the most recent year of data available in the time series, therefore, data presented in the current publication are not directly comparable to those in previous publications because a new deflator is used to prepare each annual update.
Once the time series for the NGO spend indicator has been deflated, assessments are made by comparing the difference between the value of the measure in the base year and the value in the end year against a 3% ‘rule of thumb’ threshold. A three-year average is used to calculate the base year, to reduce the likelihood of any unusual year(s) unduly influencing the assessment.
The choice of 3% as the threshold is arbitrary but is commonly used across other government indicators; the use of this approach will be kept under review.
The assessment of change reflects the overall change in the measure from the base year to latest year and do not reflect fluctuations during the intervening years. Two assessment periods have been used for the NGO expenditure measure:
- Long-term – an assessment of change since the earliest date for which data are available (2010/2011).
- Short-term – an assessment of change over the latest five years.
NGOs included in the indicator
- Amphibian and Reptile Conservation Trust
- Badger Trust
- Bat Conservation trust
- British Association for Shooting and Conservation
- British Trust for Ornithology
- Buglife
- Bumblebee Conservation Trust
- Butterfly Conservation
- ClientEarth
- Freshwater Habitats Trust
- Game & Wildlife Conservation Trust
- Hawk and Owl Trust
- The Mammal Society
- Marine Conservation Society
- MARINElife
- National Trust
- Plantlife
- People’s Trust for Endangered Species
- The Rivers Trust
- RSPB
- Salmon & Trout Association
- The Shark Trust
- Whale and Dolphin Conservation
- Wildfowl & Wetlands Trust
- The Woodland Trust
- WWF – UK
- Zoological Society of London (ZSL)
- Royal Society of Wildlife Trusts
- Norfolk Wildlife Trust
- Essex Wildlife Trust
- Wildlife Trust for Bedfordshire, Cambridgeshire & Northamptonshire
- The Lancashire Wildlife Trust
- Yorkshire Wildlife Trust
- Dorset Wildlife Trust
- Surrey Wildlife Trust
- Hampshire & Isle of Wight Wildlife Trust
- Berks, Bucks & Oxon Wildlife Trust
- Devon Wildlife Trust
- Scottish Wildlife Trust
- Warwickshire Wildlife Trust
- Wiltshire Wildlife Trust
Bibliography
- Environmental expenditure statistics, General Government and Specialised Producers data collection handbook, 2007 edition. Eurostat Methodologies and Working papers.
Glossary
- CEFAS The Centre for Environment, Fisheries and Aquaculture Science
- CITES Convention on International Trade in Endangered Species
- Defra Department for Environment, Food and Rural Affairs
- DfID Department for International Development
- FCDO Foreign, Commonwealth & Development Office
- FCO Foreign and Commonwealth Office
- FIP Forest Investment Programme
- GBFF Global Biodiversity Framework Fund
- GCF Global Climate Fund
- GEF Global Environment Fund
- JNCC Joint Nature Conservation Committee
- LBAP Local Biodiversity Action Plan
- MOD Ministry of Defence
- ODA Official Development Assistance
- OECD Organization for Economic Cooperation and Development
- OOF Other Official Flows
- OTEP Overseas Territories Environmental Programme
- SSSI Site of Special Scientific Interest
Organisations included in the public sector indicators
- Department of Agriculture, Environment and Rural Affairs – Northern Ireland
- Department for Environment, Food and Rural Affairs
- Environment Agency
- Foreign, Commonwealth & Development Office
- Forest Research
- Forest Service – Northern Ireland
- National Lottery Heritage Fund
- Highways Agency
- Joint Nature Conservation Committee
- Royal Botanical Gardens, Kew
- Landfill Tax Credit Scheme
- Met Police Wildlife Crime Unit
- Ministry of Defence
- Natural England
- Natural Resources Wales
- NatureScot
- Northern Ireland Environment Agency
- Royal Botanical Gardens Edinburgh
- Scottish Environment Protection Agency
- Scottish Government
- The Big Lottery Fund
- Welsh Assembly
Caveats and limitations
There are over 20 organisations that this indicator sources data from. The data may be published by some of those organisations, but the method used is to collect data directly from the organisations, specifically at the individual or contact level within those organisations. Data collection in recent years has proven to be more challenging than usual, which increases uncertainty in the final estimates.
For the past four years, it has not been possible to source complete data from the Department of Agriculture, Environment and Rural Affairs – Northern Ireland (DAERA-NI) relating to public spending on biodiversity in the UK. This issue has been further compounded by the lack of data collection in the past two years for the agri-environmental scheme element of biodiversity spend. Therefore, it has been addressed as follows:
- Biodiversity spend - the data have been averaged over 3 years of actual data and used this average for years 2020/2021, 2021/2022, and 2022/2023.
- Agri-environmental scheme data - data was provided for 2021/2022, so this figure has been carried forward for 2022/2023 and 2023/2024.
There is uncertainty over spend on agri-environment schemes by Welsh Government in 2023/2024; therefore this element of spend has been excluded from the total for 2023/2024 in this publication of the indicator.
Development plan
Measures of this indicator are being developed to align more closely with the new GBF headline indicators D3 and D1 (private spending on biodiversity in the UK and UK public sector spending on global biodiversity), and it is intended to further investigate alternative data sources for future updates of the indicator.
For the measure on public sector spending on biodiversity in the UK, alternative data sources, including the OECD Classification of Functions of Government (COFOG) dataset, are being investigated.
Since our previous publication we have adapted the language and visualisations used in this indicator. We are keen to hear from our users about these changes, as well as our published development plan: please email us.
Categories:
Published: