Habitat connectivity
Last updated: 2025
Latest data available: 2012 (mid-year of the 10-year moving window 2007 to 2017)
|
In 2025 new indicators have been developed and published in the UK Biodiversity Indicators suite. These indicators were developed to report on progress towards the goals and targets of the Kunming-Montreal Global Biodiversity Framework. Alongside this, the Biodiversity Indicators production team have sought feedback from our users, and used this feedback to identify existing indicators which can be discontinued whilst minimising impact on our users. |
Introduction
Connectivity is a measure of the relative ease with which typical species can move through the landscape between patches of habitat. Habitat loss and fragmentation can reduce the size of populations and hinder the movement of individuals between increasingly isolated populations, threatening their long-term viability.
This indicator illustrates changes in functional connectivity – the ability of species to move between resource patches – of 33 butterfly and 29 woodland bird species in the UK. The indicator is based on a measure of population synchrony, which is the level of correlation in time-series of population growth rates from different monitoring sites. Quantifying functional connectivity will allow more targeted landscape conservation management to help reduce the risk of species extinction.
Data for this indicator can be found in the published datafile.
Type of indicator
State indicator
Type of official statistics
Official statistics in development – indicator under development: The UK biodiversity indicators project team would welcome feedback on the novel methods used in the development of this indicator. For example, does this new indicator measure something readers feel should be measured, and how well does it measure habitat connectivity? For more information, please visit the UK Statistics Authority’s website on Types of official statistics – UK Statistics Authority.
Contents
- Assessment of change
-
Key results
- Figure 1: Composite trends in functional connectivity of butterflies in the UK, 1985 to 2012, using a 10-year moving window
- Figure 2: Summary of individual species trends in functional connectivity of butterflies in the UK across three time periods, 1985 to 2012, using a 10-year moving window
- Figure 3: Composite trends in functional connectivity of woodland birds in the UK, 1985 to 2012, using a 10-year moving window
- Figure 4: Summary of individual species trends in functional connectivity of woodland birds in the UK across two time periods, 1985 to 2012, using a 10-year moving window
- Further detail
- Acknowledgements
-
Technical annex
- Background
- Figure 5: Schematic of factors that influence functional connectivity, which in turn can affect species extinction risk
- Figure 6: Locations of the monitoring sites in the UK for each dataset, (a) UKBMS (n = 701), (b) CBC (n = 109), and (c) BBS (n = 2,499)
- Methodology
- Findings
- Development plan
- Archived measure
- Figure 7: Change in habitat connectivity for selected broad habitats in the wider countryside of the UK, 1990 to 2007
- References
Assessment of change
This indicator is not assessed.
Key results
For UK butterflies, the average functional connectivity between 1985 and 1995 was relatively stable, the unsmoothed index fell to a low of 48% in 2004, and then rose. The level of functional connectivity in 2012 (110%) is 10% greater than in the start year of 1985, with 72% of species increasing in connectivity in the late short-term (2000 to 2012), see Figures 1 and 2.
Figure 1: Composite trends in functional connectivity of butterflies in the UK, 1985 to 2012, using a 10-year moving window
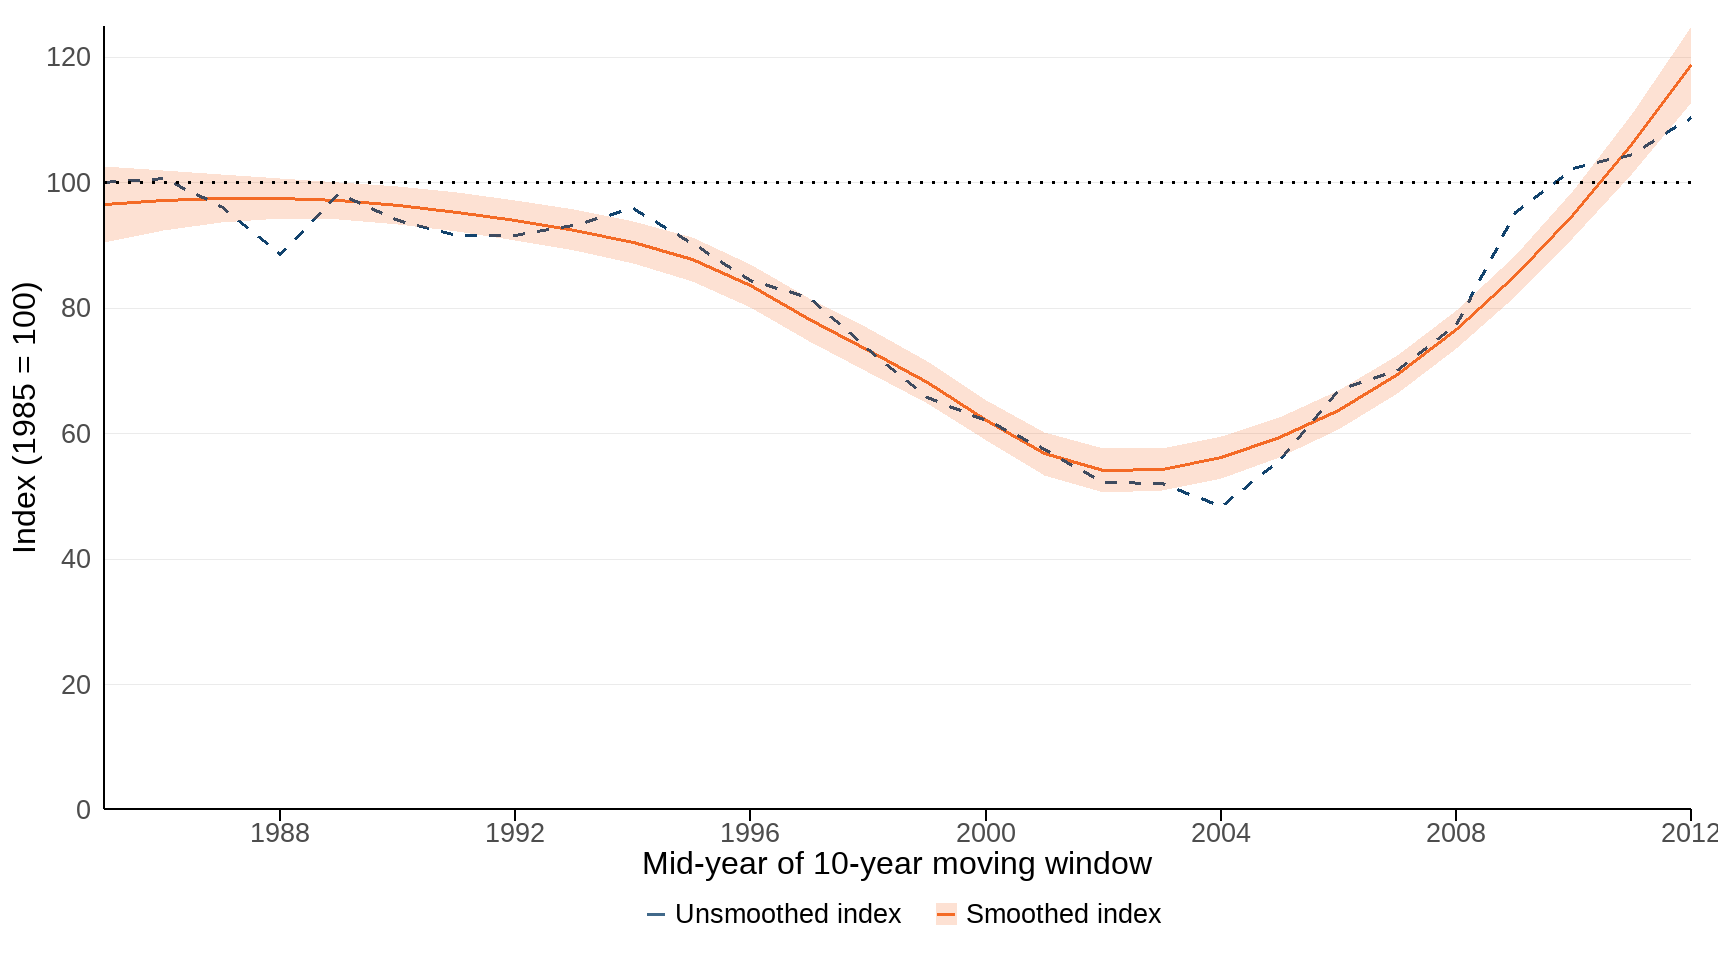
Source: UK Butterfly Monitoring Scheme and University of Reading
Notes about Figure 1
- The chart shows the unsmoothed average trend (dashed line), and the smoothed average trend (using a LOESS regression function; solid line) of functional connectivity over time across all species in the index. The shaded area represents the 95% confidence interval around the smoothed average trend.
- Data points are presented as the mid year of a 10-year moving window, therefore data for 2012, for example, represent the period 2007 to 2017.
- The number of individual species included in the index varies over time due to the availability of data. Overall, there were 21 species of butterflies from three habitat types (woodland, grassland, and garden and hedgerows) included in the index at the beginning of the time series and 33 species from the same three habitat types included in the indicator at the end of the time series.
The long-term composite trend from 1985 to 2012 masks mixed, individual species trends, with 33% of species increasing in functional connectivity, 19% decreasing, and 48% showing no significant change, see Figure 2.
Figure 2: Summary of individual species trends in functional connectivity of butterflies in the UK across three time periods, 1985 to 2012, using a 10-year moving window
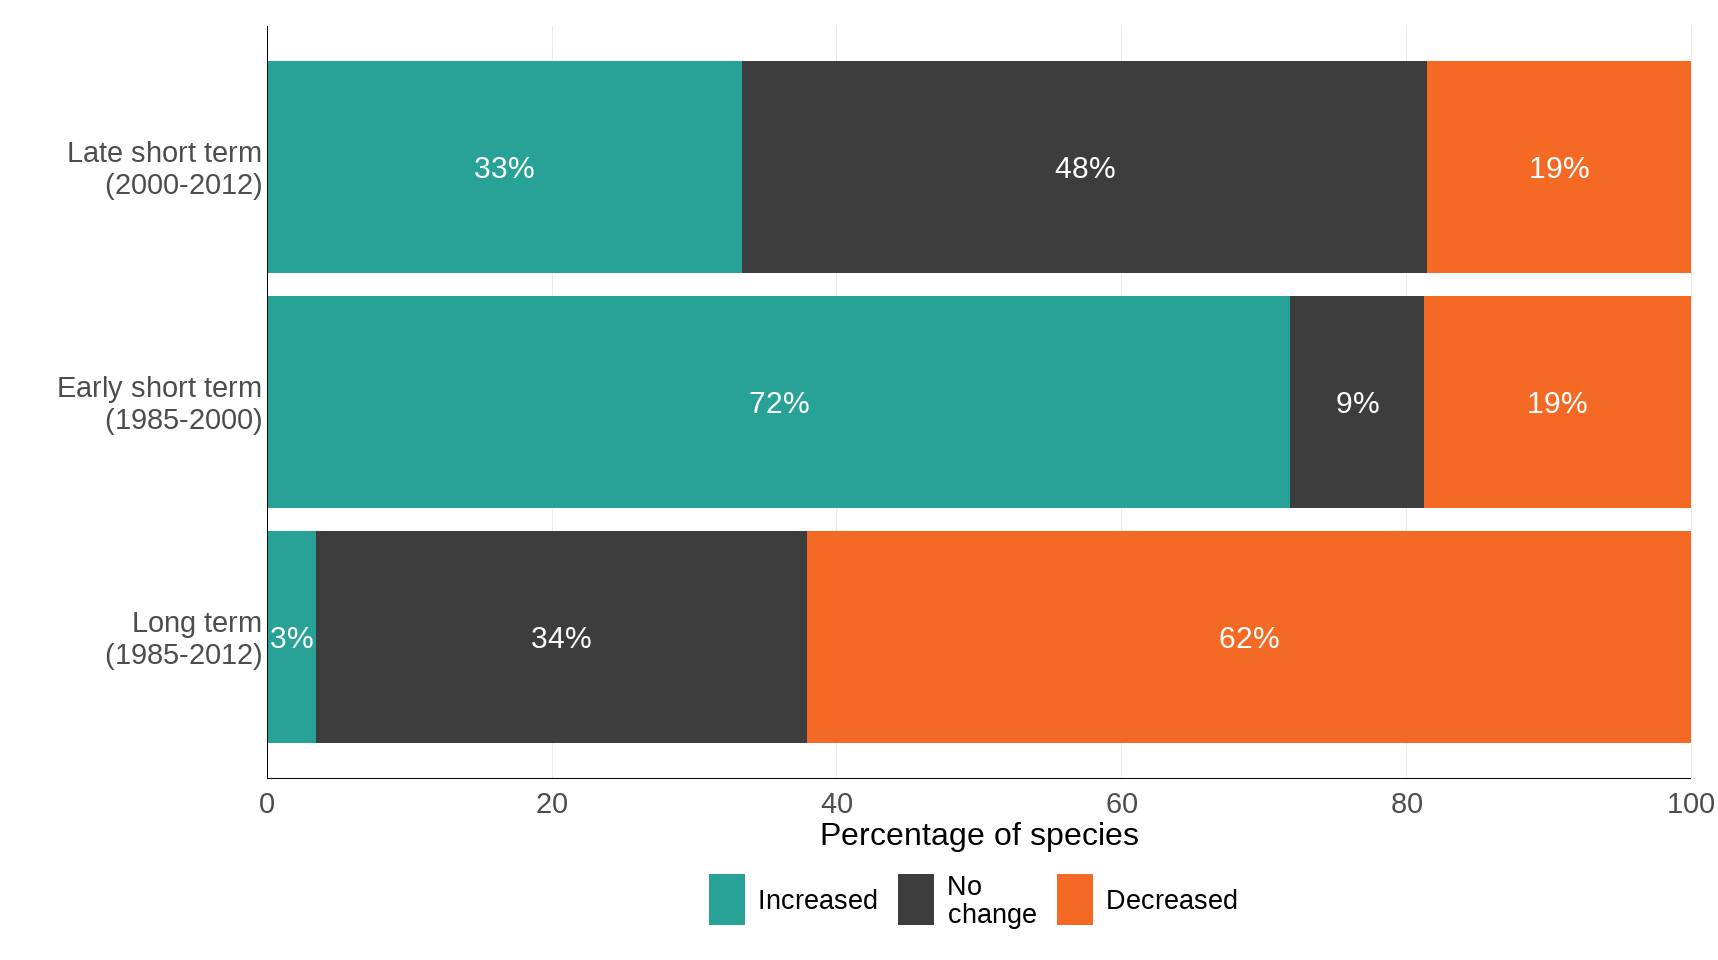
Source: UK Butterfly Monitoring Scheme and University of Reading
Notes about Figure 2
- The chart shows the percentage of species within the indicator that have shown a statistically significant increase, a statistically significant decrease, or no significant change in functional connectivity over three time periods (long term, 1985 to 2012; early short-term, 1985 to 2000; and late short-term, 2000 to 2012).
- The number of individual species included in each time period varies due to the availability of data. Overall, there were 21 species of butterflies from three habitat types (woodland, grassland, and garden and hedgerows) included in the long-term period, 24 species in the early short-term period and 31 species in the late short-term period. In all, 33 species of butterflies are included in the most recent version of the indicator.
For UK woodland birds, the average functional connectivity between 1985 and 1996 was relatively stable. However, between 1999 and 2012 the unsmoothed index declined to a low of 44% of its 1999 base-line value in 2005, and although it has since shown some signs of recovery, more than half of the species within this indicator (57%) have declined in connectivity in the late short-term (1999 to 2012), see Figures 3 and 4.
Figure 3: Composite trends in functional connectivity of woodland birds in the UK, 1985 to 2012, using a 10-year moving window
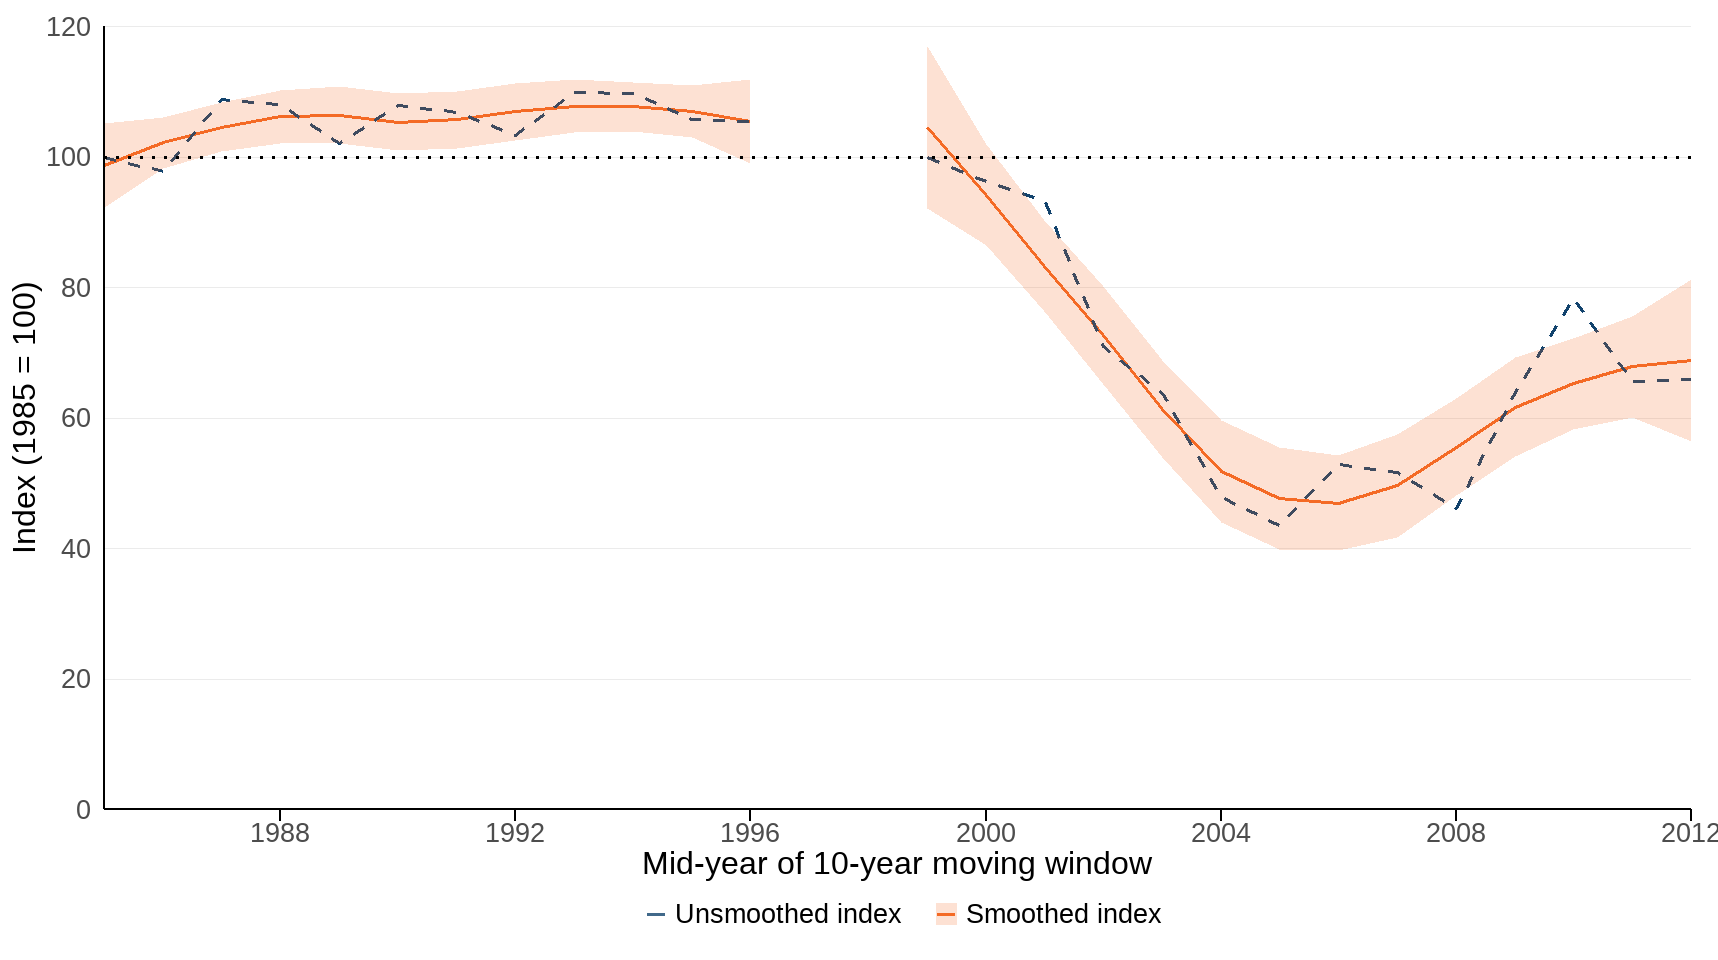
Source: British Trust for Ornithology and University of Reading
Notes about Figure 3
- The chart shows the unsmoothed average trend (dashed line), and the smoothed average trend (using a LOESS regression function, solid line) of functional connectivity over two time periods (1985 to 1996 and 1999 to 2012) across all species in index for each time period. The shaded area represents the 95% confidence interval around the smoothed average trend.
- The gap in the time-series is due to the non-availability of data for 1997 and 1998.
- Data points are presented as the mid year of a 10-year moving window, therefore data for 2012, for example, represent the period 2007 to 2017.
- The number of individual species included in the index for each time period varies due to the availability of data: there were 25 species in the early short-term period and 23 species in the late short-term period.
Figure 4: Summary of individual species trends in functional connectivity of woodland birds in the UK across two time periods, 1985 to 2012, using a 10-year moving window
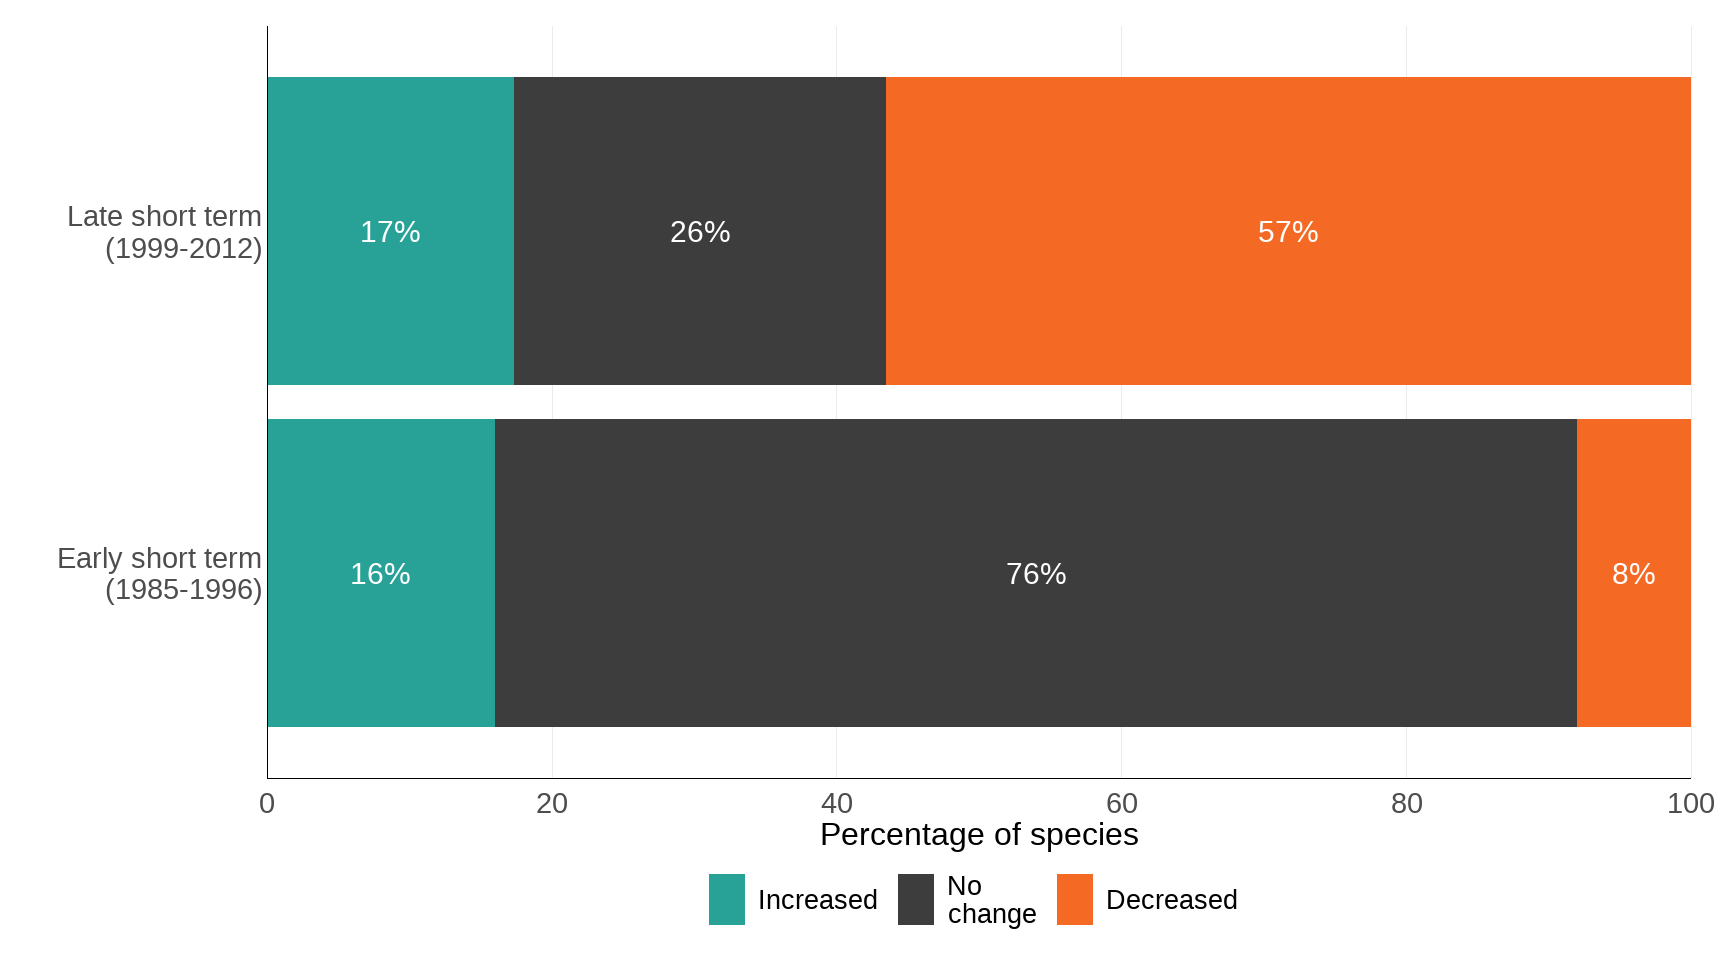
Source: British Trust for Ornithology and University of Reading
Notes about Figure 4
- The chart shows the percentage of species within the indicator that have shown a statistically significant increase, a statistically significant decrease, or no significant change in functional connectivity over two time periods (early short-term, 1985 to 1996; and late short-term, 1999 to 2012).
- The number of individual species included in each time period varies due to the availability of data: there were 25 species in the early short-term period and 23 in the late short-term period.
Further detail
Further details about the development of this indicator and the methodology used to produce it can be found in the Technical annex; a summary of the archived measure of habitat connectivity used for this indicator until 2013 can also be found there.
Relevance
Habitat loss and fragmentation was identified by the Millennium Ecosystem Assessment as one of five direct drivers of biodiversity loss. Habitat loss is a significant driver of biodiversity loss in the UK (Lawton et al., 2010). It results in fragmentation whereby habitats are separated into small, isolated patches (Fahrig, 2003). This inhibits individuals from dispersing across the landscape which is essential for metapopulation persistence, range shifts under climate change, and maintaining genetic diversity (Hanski, 1997; Watts & Handley, 2010). Quantifying functional connectivity — the ability of a focal species to move between resource patches (Oliver et al., 2017; Powney et al., 2011) — is therefore important in order to manage landscapes appropriately and reduce the risk of species extinction (Powney et al., 2012).
Habitat fragmentation and loss can be cumulative over time, but may be reversed through habitat management, restoration and recreation. Many of the habitats in the UK landscape are already highly fragmented. The effects of habitat fragmentation can be compounded by habitat management affecting source populations, as well as changes in land use between patches. The importance of these changes depends on the configuration of habitats (for example, edge effects) and the ease with which species can move through the intervening landscape (permeability).
International/domestic reporting
The suite of UK Biodiversity Indicators has been revised and updated to bring it in line with the Kunming-Montreal Global Biodiversity Framework (GBF) of the Convention on Biological Diversity (CBD). Some UKBIs will be used for the forthcoming UK national reports to CBD.
Web links for further information
Acknowledgements
Thank you to the many people who have contributed by providing data and to the many colleagues who have helped produce this indicator.
Technical annex
Background
Functional connectivity is determined by the number of individuals leaving patches (for example, emigration often when local abundance is high), the intrinsic dispersal capability of individuals, and the structure of the landscape facilitating or hindering movement (Figure 5). Certain methods to measure functional connectivity, such as mark-release-recapture studies or landscape genetics are expensive, time consuming and can only be conducted over small spatial scales. Larger-scale (national) indicators therefore have tended to focus on structural metrics based on land cover combined with expert opinion on species’ habitat associations and movement capacity (Watts & Handley, 2010). While useful, these approaches are limited by the frequency by which land cover data are updated and by substantial uncertainty in using expert opinion to estimate species’ movement capabilities across land cover types. This indicator uses a data-derived method based on widely available, annually updated species monitoring data – which gives a ‘species-eye-view’ (empirically derived) measure of functional connectivity.
Figure 5: Schematic of factors that influence functional connectivity, which in turn can affect species extinction risk

Source: University of Reading
The functional connectivity indicator is based on a measure of population synchrony, the level of correlation in time-series of annual population growth rates between different monitoring sites. Population synchrony is known to be influenced by distance between sites, habitat similarity, shared climate and position in geographic range (Powney et al., 2011, 2012). After accounting for these factors, research has shown population synchrony to be an effective measure of functional connectivity, responsive to the structure of land cover between sites (Powney et al., 2011, 2012), and reflecting actual movements of individuals from independent mark-release-recapture data (Oliver et al., 2017). Additional evidence which analysed over 60 UK birds and butterflies found that mobile and more abundant species have higher levels of population synchrony (Hordley et al., 2022). In this indicator, data from the UK Butterfly Monitoring Scheme (UKBMS) and British Trust for Ornithology (BTO) are used, which comprise spatial and temporally replicated standardised population monitoring data (see Figure 6 for an overview of the locations of these sites). Two BTO datasets are used: the Common Birds Census (CBC) which ceased in 2000 and the Breeding Bird Survey (BBS) which began in 1994 and continues today. Because the number and identity of monitoring sites varies through time, an approach based on mixed effects models is used to account for this variation while estimating a temporal trend in functional connectivity.
Figure 6: Locations of the monitoring sites in the UK for each dataset, (a) UKBMS (n = 701), (b) CBC (n = 109), and (c) BBS (n = 2,499)

Source: UK Butterfly Monitoring Scheme and British Trust for Ornithology
Methodology
Population synchrony in growth rates (that is, interannual population changes; following Powney et al., 2010) was calculated for all pair-wise monitoring site combinations, using a 10-year moving window from 1980 to 2016 for the UKBMS dataset, 1980 to 2000 for the CBC dataset, and 1994 to 2016 for the BBS dataset. A mixed effects model was fitted, with population synchrony as the response variable, and the mid-year of each moving window included as a fixed categorical effect. To account for other known drivers of population synchrony, distance between sites, habitat similarity index, and mean northing were included as predictors in the model (Powney et al., 2011). Site pair ID and species were included as random intercepts. Coefficients for each year were extracted and used as the measure of functional connectivity along with standard errors to reflect uncertainty in the estimate.
To determine how many butterfly species were changing in functional connectivity over time, three periods of change were investigated: two short-term trends; early (1985 and 2000) and late (2000 and 2012), and one long-term trend (1985 and 2012). For birds, two time periods were chosen: early short-term using the CBC dataset (1985 to 1996) and late short-term using the BBS dataset (1999 to 2012). These time periods were chosen to ensure there was no overlap in the 10-year moving window (that is, they represent independent input data). For each time period comparison, and for each species, coefficients and their uncertainty were extracted from the mixed effects model to determine whether connectivity had significantly increased or decreased, or there had been no significant change between the two comparison years (Figure 1 and 3).
It is important that the measure of functional connectivity reflects the three main components determining movement between sites (Figure 5) and not confounding effects. Two possible confounding effects could be a) a temporal trend in spatial autocorrelation in climate over time, or b) increasing variance in climate over time. To test for a), Moran’s I (a measure of the overall spatial autocorrelation in a data set) was calculated for four climatic variables: mean temperature and rainfall for each season (spring, summer autumn, winter). Linear and quadratic regression models were fitted for each variable against year. These models showed no significant trends suggesting no evidence for changes in spatial autocorrelation in climate over time. To test for b), the variation in seasonal mean temperature and total precipitation were compared between 1985 to 2000 and 2000 to 2012. Analysis using an F-test revealed no significant changes in variance between the two time periods.
Findings
Evidence supporting a strong signal of species movement on population synchrony:
- Estimated quality of intervening landscape between sites is positively related to population synchrony (Speckled wood butterfly at scales of up to 100 km, Powney et al., 2011)
- Distance along woodland edges is a better predictor of movement than Euclidean distance – a similar result was found for both population synchrony and mark-release-capture (Ringlet butterfly; Powney et al., 2012)
- Patches with higher frequency of movements between them from mark-release-capture experiments also have higher population synchrony (bog fritillary butterfly; Oliver et al., 2015).
- Species that are mobile and more abundant have higher levels of population synchrony and these results are robust to an additional effect of species position in their geographic range (61 butterflies and birds; Hordley et al., 2022).
Evidence finding little signal of climatic changes on trends in population synchrony:
- No significant temporal trend in spatial autocorrelation of seasonal temperature and precipitation variables (Hordley et al., 2022).
- No significant temporal trend in variability of seasonal temperature and precipitation variables (Hordley et al., 2022).
Development plan
As above, there will be no further development of this indicator. There is no directly comparable indicator at the UK scale, but results derived from further analysis of the source data for this indicator were published in the article ‘Developing a national indicator of functional connectivity’. An England level connectivity indicator is being developed by the Outcome Indicator Framework (see indicator D1 for updates). If you use the data published for this indicator and feel this decision will impact you, please get in touch.
Archived measure
Until 2013, this indicator was based on an analysis of the change in habitat connectivity for selected broad habitats in the wider countryside. The indicator methodology was developed by Forest Research in collaboration with the UK Centre for Ecology & Hydrology, using Countryside Survey data collected consistently from 591 Countryside Survey 1 km2 sample squares in Great Britain in 1990, 1998 and 2007. The results of this work provided a significant step forward in understanding and describing habitat fragmentation and connectivity, but unfortunately it has not been possible to update this indicator since the last Countryside Survey was carried out in 2007.
Given the age of the most recent data and the lack of any future opportunities to source updates in a consistent way, the UK Biodiversity Indicators Steering Group decided to reclassify this indicator as ‘under development’ and look at new options for a headline measure. Key messages from the previous indicator update are presented here; the previous indicator can be viewed in full via The National Archives.
The indicator presented the change in the degree of habitat connectivity in Great Britain between 1990 and 2007, for two broad habitats (see Figure 7):
- Broad-leaved, mixed and yew woodland. This includes all woodland with a canopy cover of at least 25%, where more than 80% of the canopy trees are broad-leaved species or yew trees.
- Neutral grassland, which includes all grassland on neutral soils including both unimproved and semi-improved grassland.
The indicator provided a measure of functional connectivity of these two habitats in the wider landscape (that is, the relative likelihood of species typical of the habitat being able to move within and between habitat patches). The calculations took into account the area of habitat patches, how isolated they are, which habitats are next to each other, and the ease with which species are able to move through the surrounding landscape. The influence of habitat quality on species was only partially covered by this indicator.
The measure required further analysis to better explain the causes of the changes in connectivity and, as a result, the information available was insufficient for an assessment of change to be made. The indicator did however show a non-significant declining trend in the connectivity of broad-leaved, mixed and yew woodland in Great Britain, and an increasing trend in the connectivity of neutral grassland. The increase seen for neutral grassland was significant between 1990 and 2007 but not in the short term between 1998 and 2007 (Figure 7).
Figure 7: Change in habitat connectivity for selected broad habitats in the wider countryside of the UK, 1990 to 2007
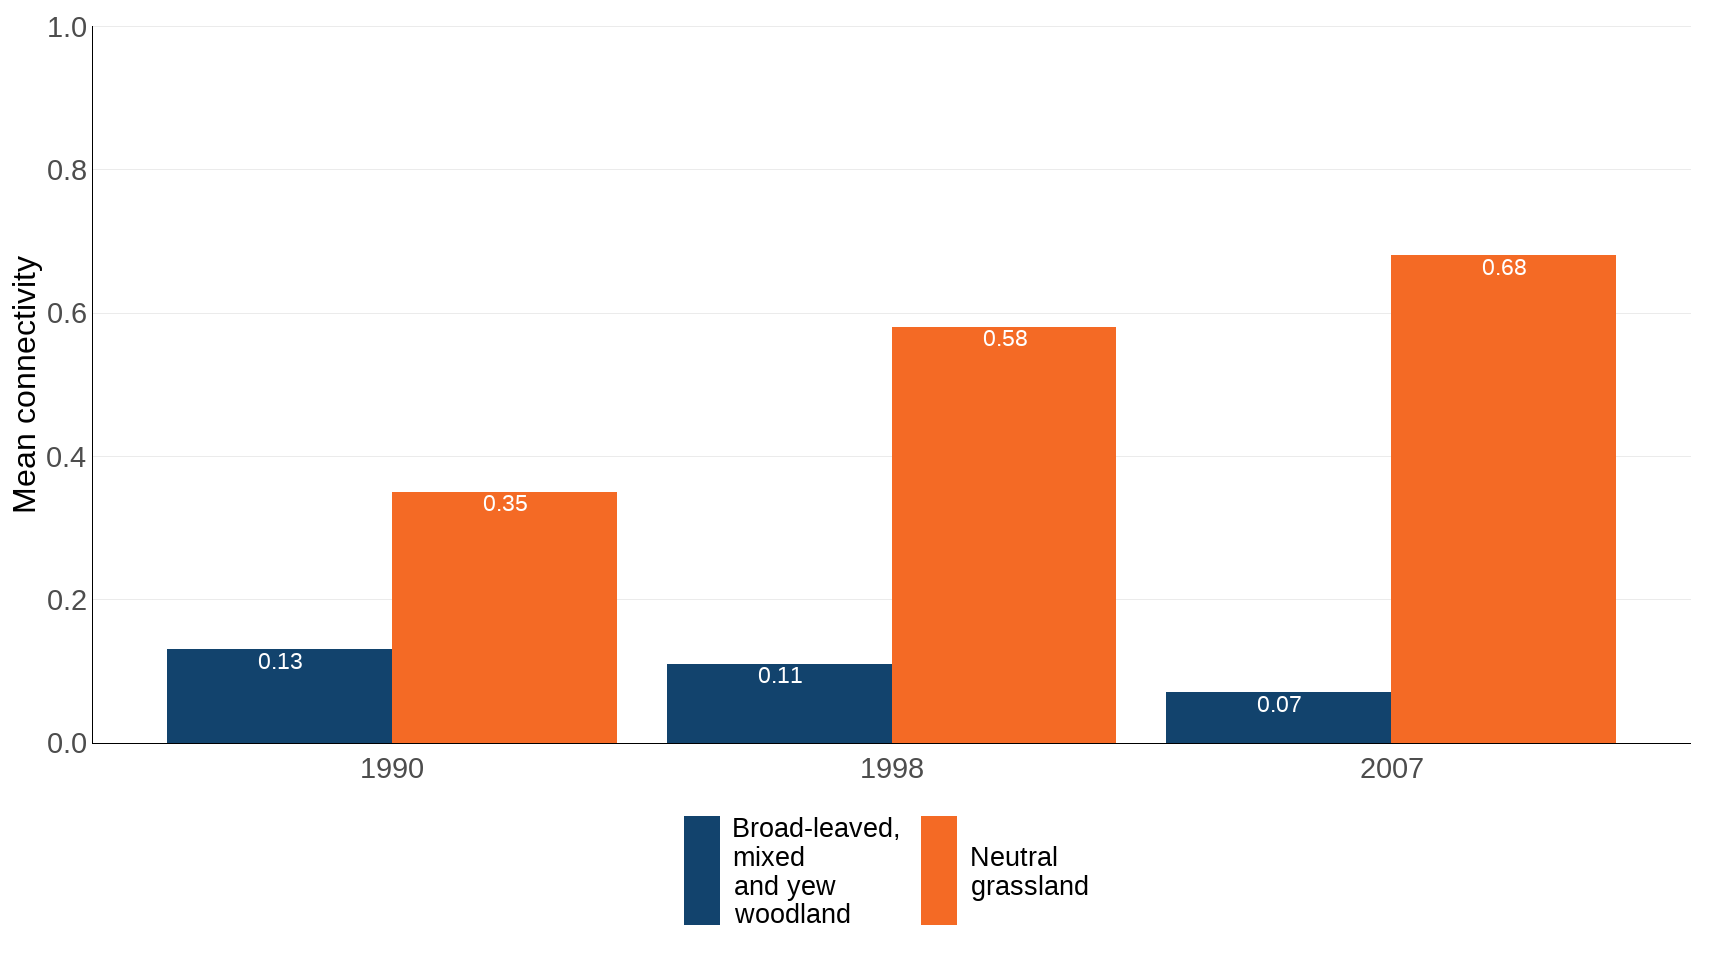
Source: UK Centre for Ecology & Hydrology and Forest Research
Notes about Figure 7
- The mean connectivity value is a measure of relative connectivity on a scale of 0 to 100. Typical values are less than 1.
- The trend for neutral grassland showed a statistically significant increase between 1990 and 2007. No other changes are statistically significant.
References
Fahrig, L. (2003). Effects of Habitat Fragmentation on Biodiversity. Annual Review of Ecology, Evolution and Systematics, 34 (1), 487–515.
Hanski, I. (1998). Metapopulation dynamics. Nature, 396, 41–49.
Hordley, L. , Powney, G. , Brereton, T. , Gillings, S. , Petchey, O. , Roy, D. , Tobias, J. , Williams, J. , Oliver, T. (2022) Developing a national indicator of functional connectivity. Ecological Indicators , 136. ISSN: 1470-160X, https://dx.doi.org/10.1016/j.ecolind.2022.108610.
Lawton, J. H., Brotherton, P. N. M., Brown, V. K., Elphick, C., Fitter, A. H., Forshaw, J., Haddow, R. W., Hilbourne, S., Leafe, R. N., Mace, G. M., Southgate, M. P., Sutherland, W. A., Tew, T. E., Varley, J., and Wynne, G. R. (2010). Making Space for Nature: a review of England’s wildlife sites and ecological network. Report to Defra.
Oliver, T., Powney, G. D., Baguette, M. and Schtickzelle, N. (2017). Synchrony in population counts predicts butterfly movement frequencies. Ecological Entomology, 42 (3), 375–378. ISSN 0307-6946, https://doi.org/10.1111/een.12391.
Powney, G. D., Roy, D. B., Chapman, D. and Oliver, T. H. (2010). Synchrony of butterfly populations across species’ geographic ranges. Oikos, 119, 1690–1696.
Powney, G. D., Roy, D. B., Chapman, D., Brereton, T. and Oliver, T. H. (2011). Measuring functional connectivity using long term monitoring data. Methods in Ecology & Evolution, 2, 527–533.
Powney, G. D., Broaders, L. K. and Oliver, T. H. (2012). Towards a measure of functional connectivity: local synchrony matches small scale movements in a woodland edge butterfly. Landscape Ecology, 27, 1109–1120.
Watts, K. and Handley, P. (2010). Developing a functional connectivity indicator to detect change in fragmented landscapes. Ecological Indicators, 10, 552–557.
Categories:
Published: