Status of threatened habitats: habitats of European importance
Last updated: 2025
Latest data available: 2019
|
In 2025 new indicators have been developed and published in the UK Biodiversity Indicators suite. These indicators were developed to report on progress towards the goals and targets of the Kunming-Montreal Global Biodiversity Framework. Alongside this, the Biodiversity Indicators production team have sought feedback from our users, and used this feedback to identify existing indicators which can be discontinued whilst minimising impact on our users. |
Introduction
This indicator is based on the results of UK reporting undertaken under a European Directive, and was last updated prior to the end of the Transition Period following the UK’s exit from the European Union (31 January 2020). This reporting requirement has since been translated into the Habitats Regulations on which the UK is expected to report again in 2028.
Member States of the European Union are required to report every six years on the conservation status of habitats and species of community interest (listed in the Annexes of the EU Habitats Directive). These are habitats and species for which the UK had European level conservation responsibilities.
The assessments needed to conclude whether each habitat of European importance occurring in UK was in a: ‘Favourable’, ‘Unfavourable-Inadequate’, ‘Unfavourable-Bad’ or ‘Unknown’ conservation status. This indicator is based on an evaluation of whether the overall results for the most recent assessment (2019) were better or worse than those for the previous assessments (2007 and 2013).
Data for this indicator can be found in the published datafile. We also produce a similar indicator at the England scale.
Type of indicator
State Indicator
Type of official statistics
Official Statistic
Assessment of change
Assessment of change in conservation status of UK habitats of European importance, based on the percentage of habitats in favourable or unfavourable improving conservation status.
| Measure | Assessment | Time period | Result |
|---|---|---|---|
| Conservation status of habitats of European importance | Long term | 2007 to 2019 | Deteriorating |
| Conservation status of habitats of European importance | Short term | 2013 to 2019 | Deteriorating |
The long and short-term assessments are based on a 3% rule of thumb. See Assessing Indicators. Article 17 reports are only submitted once every 6 years, thus, the short-term assessment is based on a 6 year period.
Key results
In 2007, 5% of UK habitats listed in Annex I of the Habitats Directive were in favourable conservation status; this figure decreased to 3% in 2013 before increasing again to 8% in 2019 (Figure 1).
The conservation status of 48% of the habitats was unfavourable-improving in 2007, it decreased to 31% in 2013 and 19% in 2019.
The conservation status of 30% of the habitats was unfavourable-declining in 2007, this decreased to 25% in 2013 and 23% in 2019.
The proportion of the habitats assessed as unfavourable-stable increased from 10% in 2007, to 38% in 2013, and increased to 40% in 2019.
Figure 1: Conservation status of UK habitats of European importance, 2007, 2013 and 2019
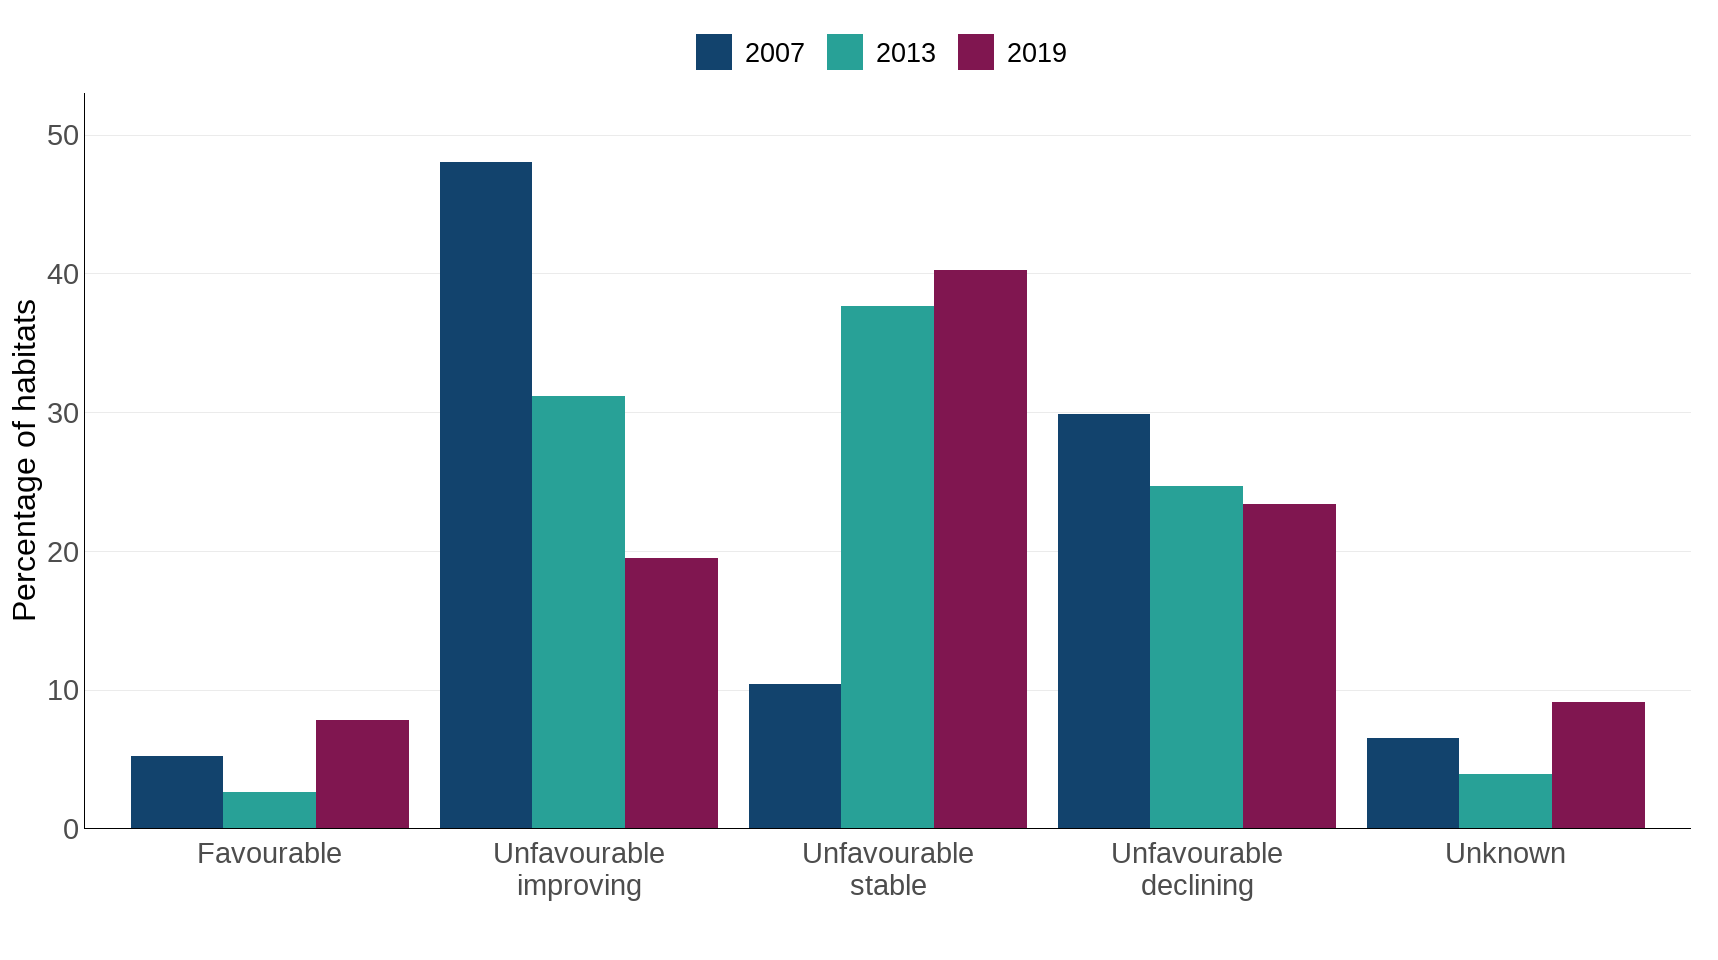
Source: UK Habitats Directive (Article 17) report to the EU, 2007, 2013 and 2019.
Notes about Figure 1:
- The chart is based on 77 habitats listed in Annex I of the Habitats Directive.
- Trends in ‘unfavourable’ conservation status allow identification of whether progress is being made, as it will take many years for some habitats and species to reach ‘favourable’ conservation status.
Further detail
The indicator is based on an evaluation of whether the results obtained in 2019 were better or worse than those obtained in 2013 (short term) and 2007 (long term). At its simplest (Figure 1), this can be the proportion of habitats which are favourable, or show an improving trend (that is, favourable, or unfavourable-inadequate but improving, or unfavourable-bad but improving). This applies to 27% of habitats assessed in 2019, 34% of habitats assessed in 2013 and 53% of habitats assessed in 2007; the measure is therefore assessed as declining in both the long and short term.
Figure 1 combines the unfavourable inadequate and unfavourable-bad assessments which show a similar direction of trend. In all 3 assessments, improving and declining trends were assigned where the evidence allowed a conclusion that improvements or declines in the conservation status of habitats were occurring. Thus:
- Unfavourable-inadequate improving, and unfavourable-bad improving were summed to form the category ‘unfavourable improving’, and
- Unfavourable-inadequate declining and unfavourable-bad declining were summed to form the category ‘unfavourable declining’.
In 2007, no trend was assigned to those habitats which were neither improving nor declining. This included both habitats for which the trend was unknown, and those for which there was no evidence of change. In subsequent years, careful consideration of evidence allowed the use of the term ‘stable’. For ease of comparison in the figures, unfavourable-inadequate and unfavourable-bad assessments with no trend conclusion in 2007 were summed to form the category ‘unfavourable stable’; the same term was used for data in subsequent years, but with more confidence that the trend was neither improving nor declining.
Note that the Habitats Directive Annexes do not include birds, as they are covered by the provision of the (separate) Birds Directive, for which there is a different reporting process.
Figure 2 provides a breakdown of Figure 1 by showing the number of habitats in the unfavourable categories which arise from the unfavourable-inadequate or unfavourable-bad assessment categories in 2019. The picture for habitats is somewhat worse than for species (see Status of species of European importance), in that relatively more habitats are in unfavourable conservation status, and relatively more habitats which are unfavourable are in unfavourable-bad status than unfavourable-inadequate status.
Figure 2: Status of UK habitats of European importance, 2019
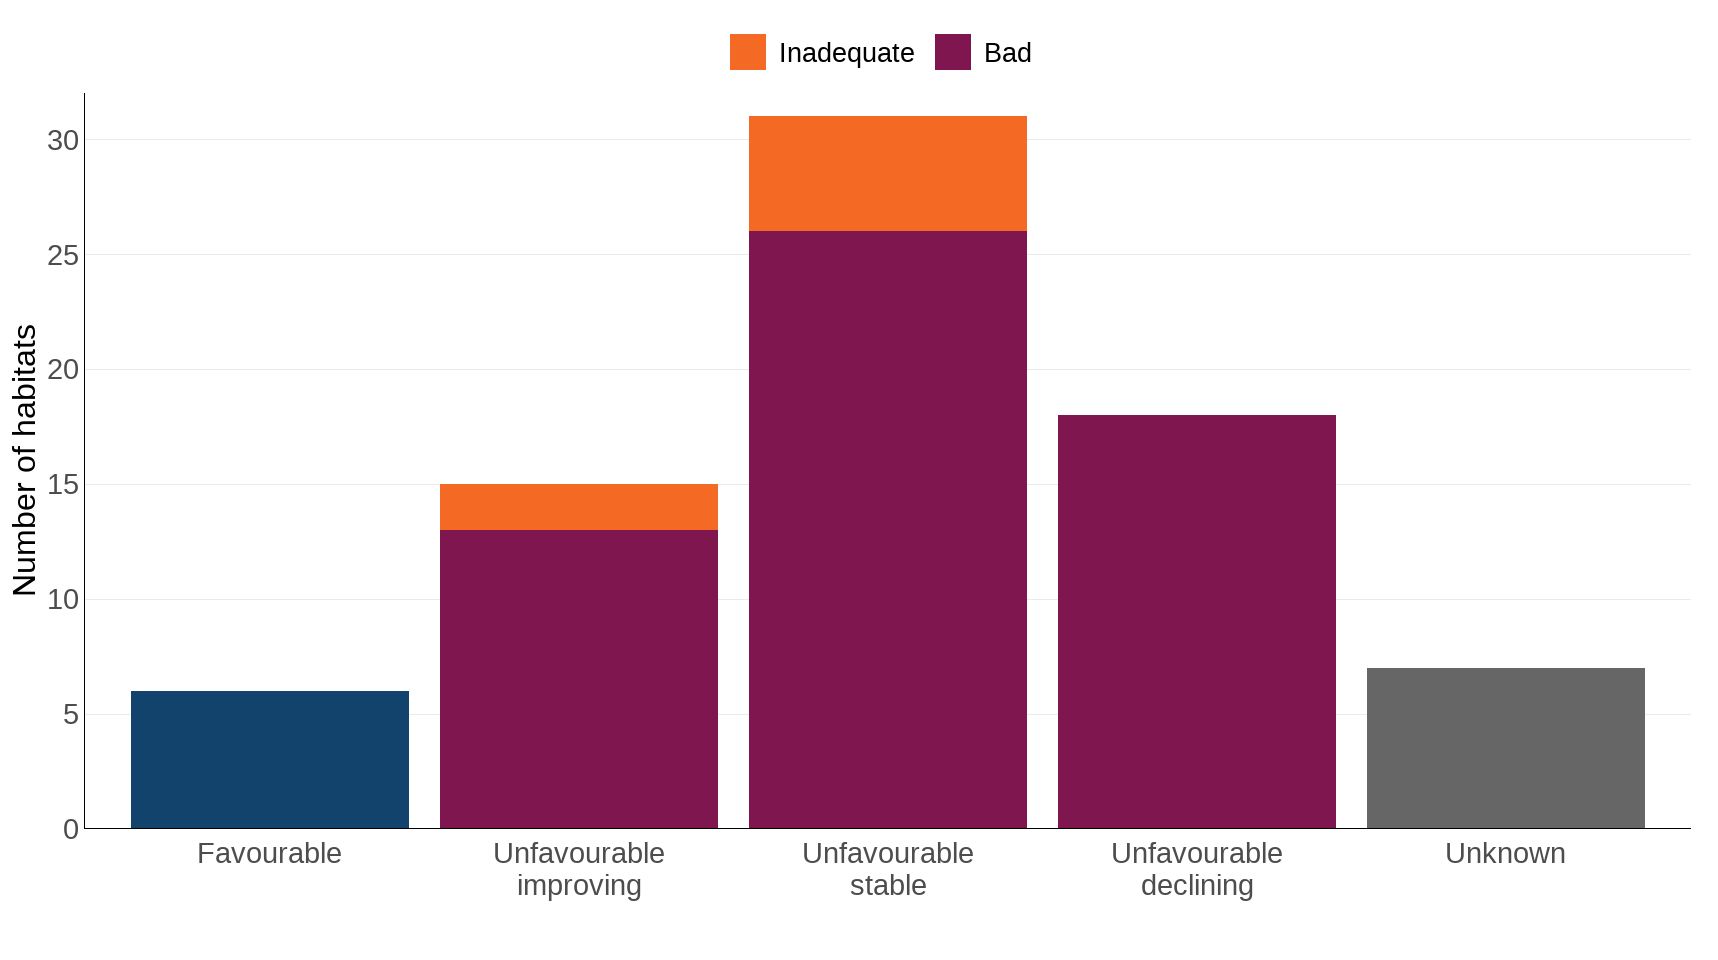
Source: UK Habitats Directive (Article 17) report to the EU, 2019.
Notes about Figure 2:
- The graph is based on 77 habitats listed in Annex I of the Habitats Directive.
- Trends in unfavourable conservation status allow identification of whether progress is being made, as it will take many years for some habitats and habitats to reach favourable conservation status.
- The unfavourable categories (unfavourable improving, unfavourable stable / unknown, unfavourable declining) show the number of habitats within a trend which were unfavourable-bad and unfavourable-inadequate.
Relevance
Article 17 of the European Union Habitats Directive requires Member States to report every six years on progress made with maintaining and/or restoring favourable conservation status for habitat types and species of community interest. These are habitats and species for which the UK had European-level conservation responsibilities.
International/domestic reporting
The UK Biodiversity Indicators have been reviewed in response to the latest goals and targets agreed under the Kunming-Montreal Global Biodiversity Framework (GBF) of the Convention on Biological Diversity (CBD). The indicators are being adapted, with some new indicators being developed, to better align them with the monitoring framework for the GBF. The suite of biodiversity indicators is therefore expected to change ready for forthcoming UK national reports to CBD in 2026 and 2029.
It contributes directly to the UK Habitats Directive (Article 17) Statutory Reporting. This reporting requirement has since been translated into the Habitats Regulations on which the UK is expected to report again in 2028.
Web links for further information
- UK Habitats Directive Report 2001 First report by the United Kingdom
- UK Habitats Directive Report 2007 Summary of Conservation Status Assessments
- UK Habitats Directive Report 2013 Summary of Conservation Status Assessments
- Article 17 Habitats Directive Report 2019
- Joint Nature Conservation Committee: UK Habitats Directive Report, 2007
- Article 17 Habitats Directive Report 2019: Habitat Conservation Status Assessments 2019
- Fourth Article 17 UK Habitats Directive Report (2019): Supporting Information (habitats & species) 2019
- Reference Portal for Article 17 of the Habitats Directive
- Online report on Article 17 of the Habitats Directive: conservation status of habitats & species of Community interest (2001–2006)
- EEA Technical report No 2/2015: Results from reporting under the nature directives 2007-2012
Acknowledgements
Thank you to the many people who have contributed by providing data and to the many colleagues who have helped produce this indicator.
Technical annex
Background
Member States of the European Union are required to report every six years on the conservation status of habitats and species listed on the annexes of the Habitats Directive. Details of exactly what information is to be delivered is laid out in the report format and guidance notes. Each assessment needs to conclude whether the habitat is in one of the following states: favourable; unfavourable-inadequate, unfavourable-bad; or unknown.
However, it is likely to take time before habitats move from unfavourable conservation status to favourable conservation status, so for the unfavourable assessments, an assessment of trend is made to determine if the habitat is improving, declining, or stable. The information sources on which the assessments are based vary between habitats – their quality is documented in the database which underpins the assessments. The changes are largely based on evidence, though expert opinion was used in a few cases where evidence was not available.
The first assessment of conservation status of habitats and species listed in the annexes of the Directive was produced in 2007; a second assessment was produced in 2013; and a third assessment was made in 2019. Each individual habitat assessment requires information on 4 parameters, which are brought together using an evaluation matrix to form an overall assessment. These parameters are: range; area; structure and functions; and future prospects. The trend in the overall assessment is based upon an integration of the trend information for the individual parameters.
The Joint Nature Conservation Committee and the Country Nature Conservation Bodies have carefully collated and considered a wide range of data, using a robust quality assurance protocol, to come to the conclusion for each habitat and species, and to ensure changes, including within category changes, have been consistently and accurately discriminated. These changes are ecologically important, as stabilising a decline in a habitat, for example, is an important conservation achievement. The information sources on which the assessments are based are quite varied – their quality is documented in the database which underpins the assessments. The changes are largely based on evidence, though expert opinion was used in cases where evidence was not available.
Methodology
The UK reported on 77 habitats in the Atlantic biogeographic region in 2007, 2013 and 2019
Taxonomic breakdown of the 77 habitats reported in 2019
| Habitat group | Number of habitats |
|---|---|
| Bogs, mires and fens | 9 |
| Coastal | 19 |
| Freshwater | 8 |
| Grasslands | 9 |
| Heaths and scrub | 8 |
| Marine | 8 |
| Rocky habitats | 6 |
| Woodlands | 10 |
A full list of these habitats, together with their individual assessment results for 2007, 2013 and 2019 is presented in the dataset supporting this indicator.
Development plan
Since our previous publication we have adapted the language and visualisations used in this indicator. We are keen to hear from our users about these changes, as well as our published development plan, please email us.
Categories:
Published: