Status of priority species: relative abundance
Last updated: 2025
Latest data available: 2023
Introduction
This indicator shows changes in the relative abundance of priority species in the UK for which data are available. Priority species are defined as those appearing on one or more of the biodiversity lists of each UK country (Natural Environmental and Rural Communities Act 2006 – Section 41 (England), Environment (Wales) Act 2016 section 7, Northern Ireland Priority Species List, Scottish Biodiversity List). The combined list contains 2,890 species in total and this indicator shows the average change in the 251 species for which abundance trends are available. The priority species were highlighted as being of conservation concern for a variety of reasons, including rapid decline in some of their populations. Presented in this indicator are values of abundance relative to the starting year (set to a value of 100), rather than absolute abundance. Changes to this value reflect the average change in species abundance; if on average species experienced a doubling in abundance, the indicator would rise to 200, if they halved it would fall to a value of 50.
The method for calculating this indicator has been updated this year in line with the England species abundance indicators. This method is not yet finalised and two smoothing options are presented. The number of species is higher (251 versus 228) than in the previous publication (last updated in 2024) of the priority species indicator. This is because new species of priority bumblebee and vascular plants have been added to the indicator for the first time, as well as the addition of one priority moth species that also met the threshold for data inclusion this year, and the removal of two moth species that are now considered data deficient (see Technical Annex).
This indicator should be read in conjunction with the priority species distribution indicator which provides data on those UK priority species for which distribution information is available.
Data for this indicator can be found in the published datafile. We also have a similar indicator at the England level.
Type of indicator
State indicator
Type of official statistics
Official statistics in development – indicator under development: The biodiversity indicators project team would welcome feedback on the novel methods used in the development of this indicator. For more information, please visit the UK Statistics Authority’s website on Types of official statistics – UK Statistics Authority.
Assessment of change
| Measure | Assessment | Time period | Result |
|---|---|---|---|
| Priority species | Long term | 1970 to 2023 | Deteriorating |
| Priority species | Medium term | 2013 to 2023 | Little or no overall change |
| Priority species | Short term | 2018 to 2023 | Little or no overall change |
The long-term assessment was made by comparing the 95% credible interval (CI) of the final year with the starting value of the indicator. As the credible interval around the final indicator value 38 (95% CI: 33, 45) is entirely below the starting value (100) the time series was assessed as decreasing.
The same approach was applied to the most recent five-year (2018 to 2023) period to assess the short-term change. As the credible interval for the most recent year (2023, 95% CI: 33, 45) spanned the value for five years previous (2018, 39) the indicator is assessed as no significant change.
Key results
Official lists of priority species have been published for each UK country. There are 2,890 species on the combined list; actions to conserve them are included within the respective countries’ biodiversity or environment strategies. This indicator shows the average change in the 251 species (long-term) and 244 species (short-term) for which abundance trends are available in the UK.
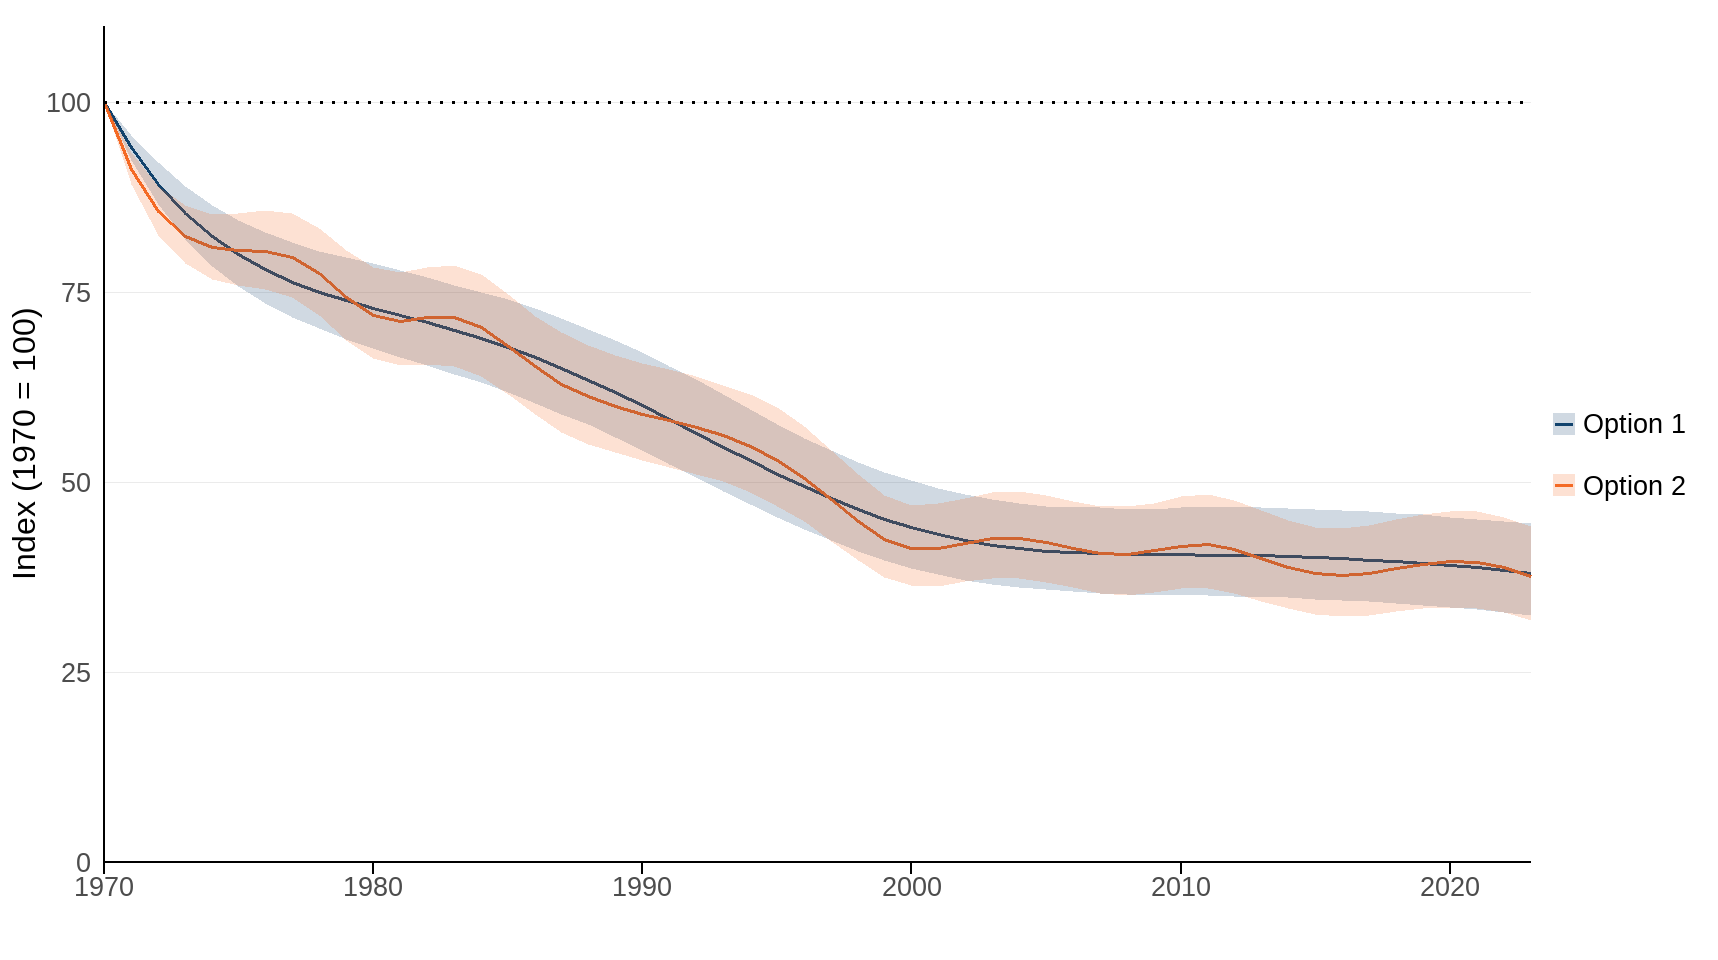
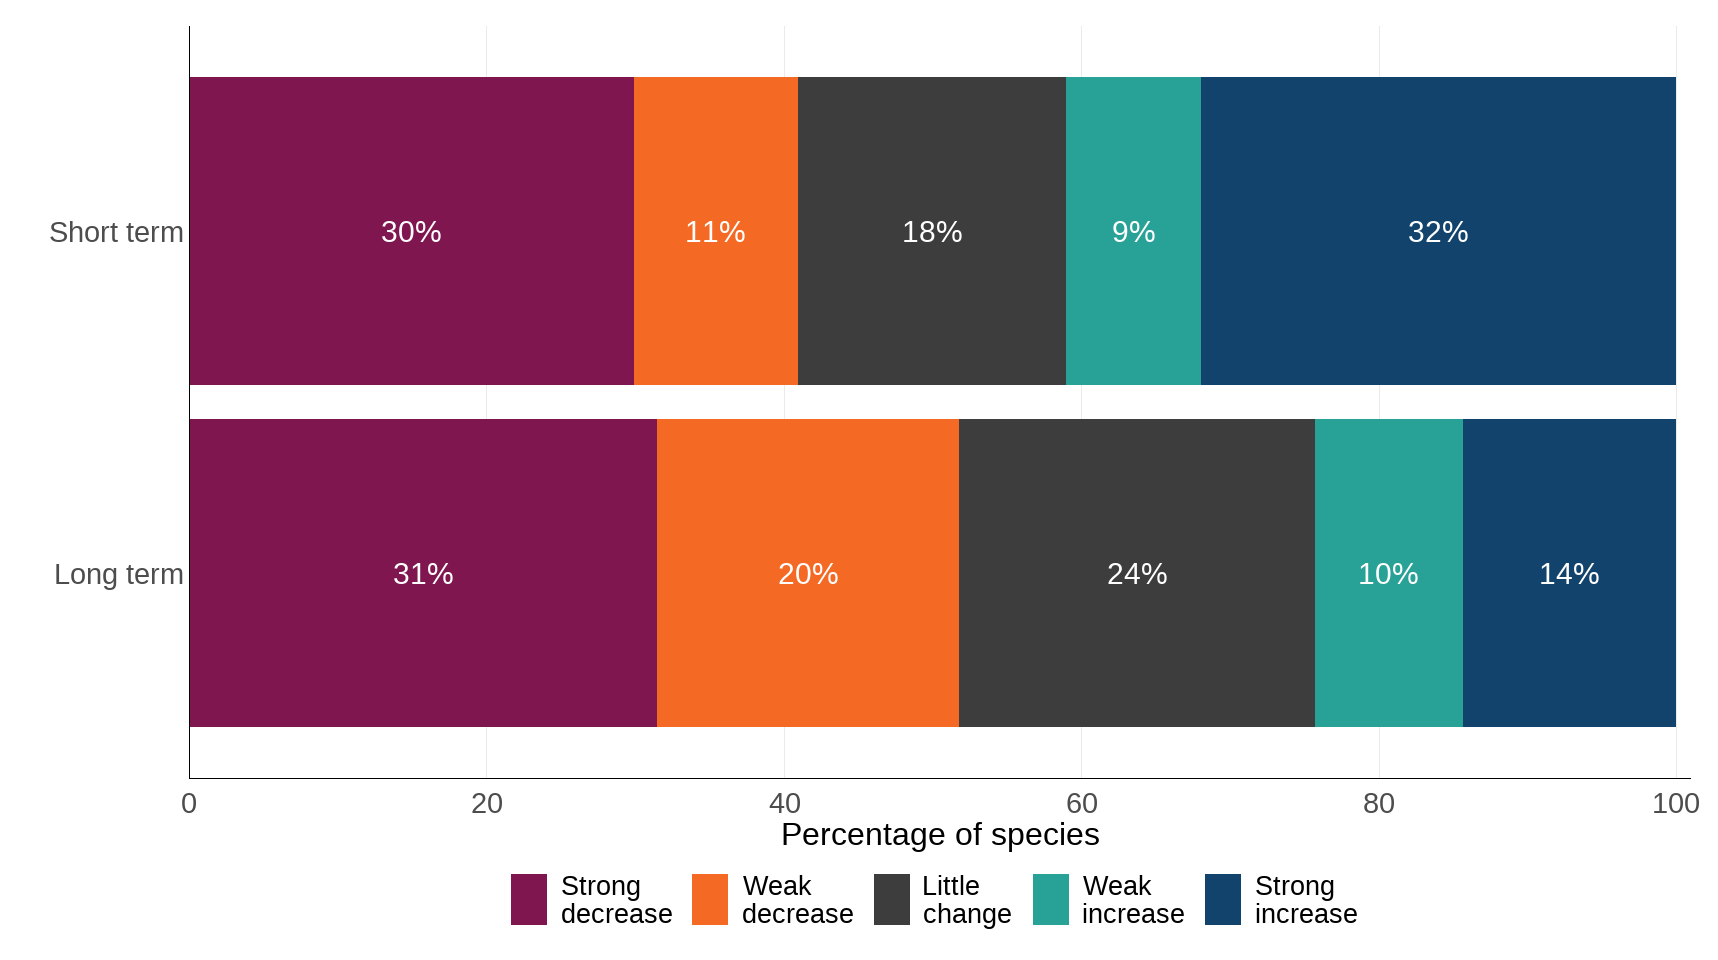
By 2023, the index of change in relative abundance of priority species in the UK had declined to 38% of its baseline value in 1970 (Figure 1). Over this long-term period, 24% of species showed a strong or weak increase and 52% showed a strong or weak decline.
More recently, between 2018 and 2023, the relative abundance index did not change significantly. Over this short-term period, 41% of species showed a strong or weak increase and 41% showed a strong or weak decline.
Figure 1: Change in the relative abundance of 251 priority species in the UK, 1970 to 2023
Source: Bat Conservation Trust, Botanical Society of Britain and Ireland, British Trust for Ornithology, Bumblebee Conservation Trust, Butterfly Conservation, Defra, Joint Nature Conservation Committee, People’s Trust for Endangered Species, Plantlife, Rare Breeding Birds Panel, Rothamsted Research, Royal Society for the Protection of Birds, UK Centre for Ecology & Hydrology.
Notes about Figure 1
- Figure 1 shows the two options for the smoothed trend (solid line) with their 95% credible intervals (shaded area). See discussion of smoothing in the Caveats and limitations section of the main release.
- Index values represent change from the baseline value in 1970, the credible interval widens as the index gets further from the 1970 value and confidence in the estimate of change relative to the baseline falls.
- The credible intervals capture the variation in trends across species, but not uncertainty in the underlying species abundance indices. Furthermore, they do not capture uncertainty associated with the spatial locations of sample points, nor about the degree to which the species represent wider biodiversity.
- All species in the indicator are present on one or more of the country priority species lists (Natural Environmental and Rural Communities Act 2006 – Section 41 (England), Environment (Wales) Act 2016 section 7, Northern Ireland Priority Species List, Scottish Biodiversity List).
Figure 2: Long-term and short-term changes in 251 priority species’ abundance trends for in the UK, 1970 to 2023
Source: Bat Conservation Trust, Botanical Society of Britain and Ireland, British Trust for Ornithology, Bumblebee Conservation Trust, Butterfly Conservation, Defra, Joint Nature Conservation Committee, People’s Trust for Endangered Species, Plantlife, Rare Breeding Birds Panel, Rothamsted Research, Royal Society for the Protection of Birds, UK Centre for Ecology & Hydrology.
Notes about Figure 2
- Figure 2 shows the percentage of species within the indicator that have increased (weakly or strongly), decreased (weakly or strongly) or shown little change in abundance based on set thresholds of change (see Technical annex for more detail).
- Due to rounding, the data labels may not sum exactly to 100%.
Further detail
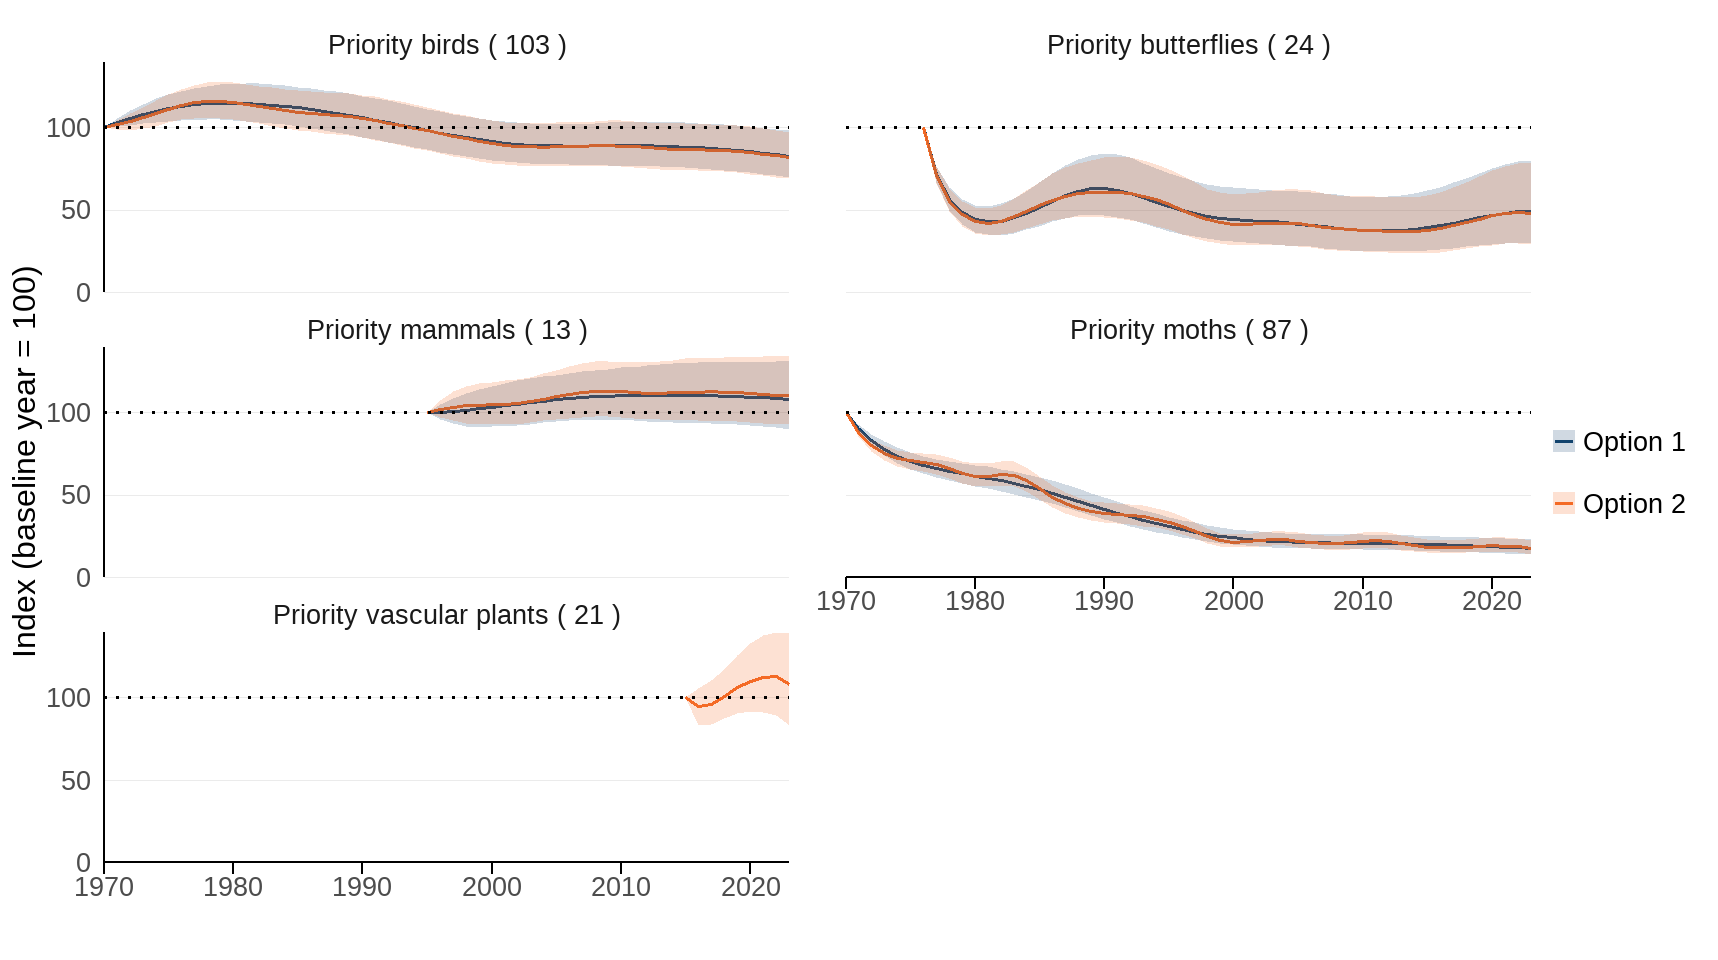
The headline indicator (Figure 1) masks variation between the taxonomic groups. Figure 3 shows the index for each taxonomic group separately, generated using the same methods as the headline indicator. The relative abundance measure comprises 103 bird species, 24 butterflies, 13 mammals and 87 moths. This year we also added for the first time, 3 bumblebees and 21 vascular plants. The moths have undergone the biggest decline with an index value in the final year (2023) that was only around 18% of its value in 1970. Butterflies have also experienced a strong historical decline, with an index value in 2023 that was roughly 48% of its value in 1976. The bird index shows a more modest decline (around 82% relative to its value in 1970) and the mammal and vascular plant indices have not changed significantly from their baseline values, although both cover a much shorter time period than other taxonomic groups. We do not present breakdowns of the bumblebees as there are too few species to be representative of this group.
Figure 3: Change in relative species abundance by taxonomic group, 1970 to 2023
Source: Bat Conservation Trust, Botanical Society of Britain and Ireland, British Trust for Ornithology, Bumblebee Conservation Trust, Butterfly Conservation, Defra, Joint Nature Conservation Committee, People’s Trust for Endangered Species, Plantlife, Rare Breeding Birds Panel, Rothamsted Research, Royal Society for the Protection of Birds, UK Centre for Ecology & Hydrology.
Notes about Figure 3
- Figure 3 shows the two options for the smoothed trend (solid line) together with their 95% credible intervals (shaded area) for each of the four taxonomic groups included in the composite indicator (see discussion of smoothing in the Caveats and limitations section of the main release).
- Index values represent change from the baseline value for each group. The credible interval widens as the index gets further from the baseline value and confidence in the estimate of change relative to the baseline falls.
- The credible intervals capture the variation in trends across species, but not uncertainty in the underlying species abundance indices. Furthermore, they do not capture uncertainty associated with the spatial locations of sample points, nor about the degree to which the species represent wider biodiversity.
- All species in the indicator are present on one or more of the country priority species lists (Natural Environmental and Rural Communities Act 2006 – Section 41 (England), Environment (Wales) Act 2016 section 7, Northern Ireland Priority Species List, Scottish Biodiversity List).
Relevance
Priorities for species and habitat conservation are set at a country level through country biodiversity or environment strategies. Each country has an identified list of priority species, which are of high conservation concern due, for example, to restricted range or population declines. The indicator therefore includes a substantial number of species that, by definition, are becoming less abundant.
Measures of abundance are more sensitive to change than measures of distribution (see the priority species distribution indicator). Nonetheless, if a threatened species that has been declining starts to recover, its distribution should stabilise, and may start to increase. If the proportion of species in the indicator that are stable or increasing grows, the indicator will start to decline less steeply. If the proportion declines, it will fall more steeply. Success can therefore be judged by reference to trends in both indicators, as well as other information on other priority species for which there are insufficient data for inclusion in the indicator.
Priority species are defined as those appearing on one or more of the biodiversity lists of each UK country (Natural Environmental and Rural Communities Act 2006 - Section 41 (England), Environment (Wales) Act 2016 section 7, Northern Ireland Priority Species List, Scottish Biodiversity List). The combined list contains 2,890 species in total. The priority species were highlighted as being of conservation concern for a variety of reasons, including rapid decline in some of their populations. Actions to conserve these priority species are included within the respective countries’ biodiversity or environment strategies.
International/domestic reporting
The suite of UK Biodiversity Indicators has been revised and updated to bring it in line with the Kunming-Montreal Global Biodiversity Framework (GBF) of the Convention on Biological Diversity (CBD). Some UKBIs will be used for the forthcoming UK national reports to CBD.
Web links for further information
- Bat Conservation Trust: The National Bat Monitoring Programme
- Botanical Society of Britain and Ireland: National Plant Monitoring Scheme
- British Trust for Ornithology: Indicators of wild bird populations
- Bumblebee Conservation Trust: BeeWalk Survey Scheme
- Butterfly Conservation: Butterflies and Moths
- Joint Nature Conservation Committee: Seabird Monitoring Programme
- People’s Trust for Endangered Species: National Dormouse Monitoring Programme
- People’s Trust for Endangered Species: National Water Vole Monitoring Programme
- Wildfowl and Wetlands Trust: National water bird estimates
- UK Biodiversity Partnership: UK Biodiversity Action Plans
- UK Butterfly Monitoring Scheme: Butterflies as indicators
- Kunming-Montreal Global Biodiversity Framework 2030 targets
- NatureScot: Scottish Biodiversity List
- Wales Biodiversity Partnership: Section 7 priority species in Wales
- Natural England: S41 List of priority species in England
- Northern Ireland Environment Agency: Northern Ireland Priority Species List
Acknowledgements
Thank you to the many people who have contributed by providing data and to the many colleagues who have helped produce this indicator.
Technical annex
For a more in-depth discussion of the methodology and data used in this indicator, please see Indicators of species abundance in England for which the same methodology is applied. A brief summary of these is presented in the following.
Source data
Many of the data on species abundance are collected through well-established volunteer-based recording schemes, many of which are run through partnerships between government bodies, NGOs and research organisations, or through statutory monitoring schemes. The species have not been selected as a representative sample of priority species and they cover only a limited range of taxonomic groups. The measure is therefore not fully representative of species in the wider countryside (see Species included).
Three criteria were used to assess whether data was suitable for inclusion in the indicator: that the scheme uses a standarised approach with protocols and appropriate analytical methods, has spatially replicated survey design across the UK and a taxonomic resolution ideally to species level. More details on these criteria can be found in the full statistical release.
Robust UK population time-series were sought for as many priority species as possible to produce the indicator for Priority Species in the UK. The measure is a composite indicator of 251 species from 6 broad taxonomic groups. The majority of the data in this indicator have previously been published and many of the datasets are currently used elsewhere within the UK biodiversity indicators. Table 1 presents the taxonomic coverage and data sources contributing to the indicator. Further information on the analytical methods used by each scheme can be found in the published datafile.
Table 1: Summary of information on the data collection schemes included in the indicators.
| Name of scheme | Taxonomic coverage | Number of species in priority species indicator | Timespan included in indicators |
|---|---|---|---|
| Breeding Bird Survey (BBS) / Common Bird Census (CBC) | Birds | 48 | 1970-2023 |
| Rare Breeding Birds Panel (RBBP) | Birds | 26 | 1970-2022 |
| Seabird Monitoring Programme (SMP) | Birds | 6 | 1986-2023 |
| Statutory Conservation Agency and RSPB Annual Breeding Bird Scheme (SCARRABS) | Birds | 12 | 1971-2023 |
| Wetland Bird Survey (WeBS) | Birds | 11 | 1975-2022 |
| BeeWalks | Bumblebees | 3 | 2010-2023 |
| UK Butterfly Monitoring Scheme (UKBMS) | Butterflies | 24 | 1976-2023 |
| Breeding Birds Survey (BBS) Mammals | Mammals | 2 | 1995-2023 |
| Mammals on Roads Survey | Mammals | 1 | 2001-2018 |
| National Bat Monitoring Programme (NBMP) | Mammals | 8 | 1998-2023 |
| National Dormouse Monitoring Programme (NDMP) | Mammals (single species) | 1 | 1998-2023 |
| National Water Vole Monitoring Programme (NWVMP) | Mammals (single species) | 1 | 2015-2023 |
| Priority Moths | Moths | 14 | 1995-2023 |
| Rothamsted Insect Survey Light Trap | Moths | 73 | 1970-2023 |
| National Plant Monitoring Scheme (NPMS) | Vascular plants | 21 | 2015-2023 |
| TOTAL | 251 |
Notes about Table 1:
- The Breeding Bird Survey began in 1994 and incorporates the Waterways Breeding Bird Survey and the Heronries Census. Prior to this, data came from the Common Bird Census (CBC).
Species included
The species list was derived from the biodiversity lists of the 4 UK countries. A link to the list for each country is provided below:
- England – Section 41 Species
- Northern Ireland – Northern Ireland Priority
- Species List Scotland – Scottish Biodiversity List
- Wales - Section 7 Priority species
The species lists used in this indicator are unchanged from those used in the 2021 indicator analysis. Species lists for some of the countries have been updated since 2021 and any changes will be incorporated into the species abundance and distribution indicators in the future. The criteria for inclusion in each of the 4 biodiversity lists are derived largely from those used to identify the UK Biodiversity Action Plan (UK BAP) priority species list, most recently in 2007, but there has been some divergence in approaches, see Table 2. For example, the Scottish biodiversity list and the Northern Ireland (NI) priority species list both have criteria based on rarity alone, whereas the UK BAP criteria did not consider rarity; rare species were only listed if they were considered threatened or declining.
For the purposes of this indicator, an inclusive approach has been taken, whereby a species only has to be included in one of the country lists to be included on the combined list. The Scottish Biodiversity list has a final criterion based on the importance of species to people, however, species designated under this criterion were not considered here. The taxonomic composition of the combined four country list (FCL) is shown in Table 3.
Some countries have included a small number of taxa below the species level (that is, sub-species) on their biodiversity lists. Such infra- specific taxa were only retained on the combined four country biodiversity list if the associated species was not included. For example, a sub-species of the willow tit (Poecile montanus) is included on the Welsh list, but it is a full species on the Scottish Biodiversity list, thus on the combined list only the full species was retained.
Table 2: The biodiversity lists of the 4 countries of the UK
| Country | Number of Taxa on country list | Criteria for inclusion of species on list |
|---|---|---|
| England (Section 41 Species) | 943 taxa | On the 2007 UK BAP list |
| Hen Harrier | ||
| Northern Ireland (NI) Priority Species List | 481 taxa | 1: On the 2007 UK BAP list |
| 2: Rapid decline of greater than or equal to 2% per year | ||
| 3: Decline of greater than or equal to 1 % per year and NI holds greater than or equal to 50% of Irish, or greater than or equal to 20 % of UK population or Irish/UK population restricted to NI | ||
| 4: Rare in NI (1 to 2 sites) and NI holds greater than or equal to 50% of Irish, or greater than or equal to 20% of UK population or Irish/UK population restricted to NI | ||
| 5: Greater than or equal to 20% of a well recognised sub-species in NI | ||
| 6: Irish Red data book species | ||
| 7: Red list Birds of Conservation concern Ireland or UK | ||
| Scottish Biodiversity List | 2,090 taxa | S1: On the 2007 UK BAP list |
| S2: International obligation | ||
| S3: Species defined as ‘nationally rare’ in GB/UK (less than 15 10 square kilometres), which are present in Scotland | ||
| S4: Species present in less than or equal to 5 kilometres square or sites in Scotland | ||
| S5: Decline of greater than or equal to 25% in 25 years in Scotland | ||
| S6a: Endemic | ||
| S6b: Endemic subspecies if also meets another criterion | ||
| Wales (Section 7 Priority species) | 567 taxa | International importance, IUCN Global Red List or Red listed in greater than or equal to 50% of EU countries where data is available or other source indicating international threat or decline |
| International responsibility greater than or equal to 25% of EU/Global population in Wales and decline greater than or equal to 25% in 25 years in Wales | ||
| Decline in Wales greater than or equal to 50% in 25 years | ||
| Other for example decline and very restricted range | ||
| UK total (combined 4 country list) | 2,890 |
Table 3: Taxonomic groups included in each of the all-species and priority species indicators and their representativeness of UK biodiversity
| Higher group | Group | Estimated number of species in the UK | Species on FCL | Number of species in priority species indicator |
|---|---|---|---|---|
| Vertebrates | Amphibians | 7 | 4 | - |
| Vertebrates | Birds | 218 | 127 | 103 |
| Vertebrates | Fish | 82 | 57 | - |
| Vertebrates | Mammals | 49 | 48 | 13 |
| Vertebrates | Reptiles | 6 | 10 | - |
| Vertebrates | Total vertebrates | 362 | 246 | - |
| Invertebrates | Coleoptera (beetles) | 4,093 | 191 | - |
| Invertebrates | Butterflies | 59 | 25 | 24 |
| Invertebrates | Hymenoptera (bees, ants, wasps) | 7,154 | 103 | 3 |
| Invertebrates | Moths | 2,345 | 174 | 87 |
| Invertebrates | Diptera (flies) | 7,099 | 94 | - |
| Invertebrates | Other insects | 3,197 | 37 | - |
| Invertebrates | Non-insect invertebrates | 5,369 | 233 | - |
| Invertebrates | Total invertebrates | 29,316 | 857 | - |
| Plants | Vascular plants | 1,497 | 409 | 21 |
| Plants | Bryophytes | 1,056 | 301 | - |
| Plants | Chlorophyta | 2,342 | 269 | - |
| Plants | Total plants | 4,895 | 979 | - |
| Fungi | Non-lichenised fungi | 15,100 | 262 | - |
| Fungi | Lichens | 2,354 | 546 | - |
| Fungi | Total fungi | 17,454 | 808 | - |
| Total | - | - | 2,890 | 251 |
Notes about Table 3:
- The total number of multicellular eukaryotic freshwater and terrestrial species found in the UK is approximately 55,000, as reported in Burns et al., 2018.
For a full species list, please see the published datafile.
Methodology
Pre-smoothing
Species abundance of many organisms tends to fluctuate from one year to the next. These fluctuations make it difficult to reveal the underlying trends. For this reason, some schemes include a statistical smoothing to remove short term stochastic variation. We therefore applied a smoothing term to each species time series, except those for which a smoothed trend was already available (bats and most of the birds). We applied a thin plate spline with 0.3 degrees of freedom for each data point (Fewster et al., 2000) and did this on the log scale. The resultant smoothed trends were then taken forward to the next stage of analysis.
Multispecies trends
To create the composite index, we used a method specifically developed for creating multispecies indicators from heterogeneous data (Freeman et al., 2020). The resulting index is an estimate of the geometric mean abundance. This is a relatively newly developed method and offers some advantages over older techniques: it is adaptable to different data types and can cope with the issues often presented by biological monitoring data, such as varying start dates of datasets and missing values.
A smoothing process is used to reduce the impact of between-year fluctuations - such as those caused by variation in weather - making underlying trends easier to detect. For this a penalised spline was used with the number of “knots” set to one of two values. Firstly, as has been done for previous iterations of the priority species indicator and as is standard elsewhere (Fewster et al., 2000), we used the total number of years of data divided by 3. Secondly, in order to reveal a more stable long-term trend in the data, we used the total number of years of data divided by 10. These two values were selected to demonstrate the range of plausible indicator values for the purposes assessing meaningful change in species abundance over time.
The overall trend shows the balance across all the species included in the indicator. Individual species within each measure may be increasing or decreasing in abundance (Figure 2). Estimates will be revised when new data or improved methodologies are developed and will, if necessary, be applied retrospectively to earlier years. Further details about the methods used to create the species indicator can be found in the full statistical release.
Confidence and uncertainty
The credible intervals around the multispecies index represent confidence in the degree to which average abundance in any given year is different from the baseline year (1970). They do not provide clear guidance on the degree to which pairs of years (for example, 2000 versus 2022) differ.
The credible intervals capture uncertainty in the trends of individual species that contribute to the index. They do not capture uncertainty associated with the spatial locations of sample points, nor about the degree to which the species represent wider biodiversity. The credible intervals partially capture uncertainty in the species abundance estimates, inasmuch as the method includes a term to estimate measurement error. However, our approach does not explicitly propagate information about relative uncertainty of different species or years.
Assessment of change
Formal assessment of change is made on the basis of credible intervals for the time period; if the indicator value for the first year falls outside of the credible intervals for the final year then the indicator is deemed to have changed over that time period. This was done for three time periods; long-term (from the beginning of the time series to 2023), medium-term (the most recent 10 years) and short-term (the most recent 5 years).
To illustrate the variation in trends among individual species, an assessment of change is made for each species. Species are categorised into one of five categories on the basis of defined thresholds (Table 4). The five trend thresholds are based on average annual rates of change over the assessment period and are derived from the rates of decline used to assign species to the red and amber lists of Birds of Conservation Concern (Eaton et al., 2015). Asymmetric percentage change thresholds are used to define these classes as they refer to proportional change, where a doubling of a species index (an increase of 100%) is counterbalanced by a halving (a decrease of 50%).
Table 4: Thresholds used to define individual species’ trends
| Category | Threshold | Long term change |
|---|---|---|
| Strong increase | An increase of more than 2.81% per annum | Equivalent to an increase of more than 100% over 25 years |
| Weak increase | An increase of between 1.16% and 2.81% per annum | Equivalent to an increase of between 33% and 100% over 25 years |
| Little change | Change is between +1.16 % and -1.14% per annum | Equivalent to a change of between +33% and -25% over 25 years |
| Weak decrease | A decrease of between 1.14% and 2.73% per annum | Equivalent to a decrease of between 25% to 50% over 25 years |
| Strong decrease | A decrease of more than 2.73% per annum | Equivalent to a decrease of more than 50% over 25 years |
Development plan
Developments planned for this indicator follow broadly the plans for the full statistical release. Over the short term, these plans include:
- We will continue to investigate the impact of different levels of smoothing in the indicator and make a decision on whether we will continue to produce multiple options for different uses, or produce a single indicator of priority species abundance in the UK.
- We will make available the code for all stages of the modelling pipeline on GitHub.
Longer term development plans:
- We will review on an ongoing basis new species abundance data that may become available.
- We will continue to review the data that feeds into the indicator. This will include ongoing review of the status of monitoring schemes (including the schemes that provide data that is used in the current indicator, as well as those that may provide new abundance data in future).
- We will continue to improve the quality of the raw data and methodology, in line with our commitment to the Code of Practice for Statistics.
- We will explore further options for breakdowns that may be useful for users of the statistic (for example, separate trends for generalist and specialist species or widespread and rare species).
- We will continue to refine how the methodology is implemented and explore the impacts of any differences from the original Freeman implementation. For example, this may include investigating the propagation of species-specific uncertainty in the model, measurement error or the decision to pre-smooth. We would also aim to explore the assumption that species with missing data behave in a similar way to those with data present in the model, and the impact this assumption has on the outputs.
- We will continue to review how we communicate the representativeness of the indicator. We will assess the spatial, taxonomic and temporal coverage of the data underlying the indicators and communicate these alongside the indicators. We would also like to explore the trade off between increasing the representativeness of the indicator against our ability to detect meaningful biological change.
- We will review our methods for assessing change over short and medium time-scales in the indicators and, if appropriate, refine them further.
We are keen to hear from our users about these plans, as well as our published development plan, please email us.
References
- Burns, F., Eaton, M.A., Hayhow, D.B., Outhwaite, C.L., Al Fulaij, N., August, T.A., Boughey, K.L., Brereton, T., Brown, A., Bullock, D.J., Gent, T., Haysom, K.A., Isaac, N.J.B., Johns, D.G., Macadam, C.R., Mathews, F., Noble, D.G., Powney, G.D., Sims, D.W., Smart, S.M., Stroh, P., Walker, K.J., Webb, J.R., Webb, T.J., and Gregory, R.D. (2018). An assessment of the state of nature in the United Kingdom: A review of findings, methods and impact. Ecological Indicators, 94(1), 226 to 236. doi.org/10.1016/j.ecolind.2018.06.033
- Eaton, M. A., Burns, F., Isaac, N. J. B., Gregory, R. D., August, T. A., Barlow, K. E., … Williams, J. (2015). The priority species indicator: measuring the trends in threatened species in the UK. Biodiversity, 16(2–3), 108–119. https://doi.org/10.1080/14888386.2015.1068222
- Fewster, R M., S T. Buckland, G M. Siriwardena, S R. Baillie, and J D. Wilson (2000). Analysis of Population Trends for Farmland Birds Using Generalized Additive Models. Ecology 81, 1970–84.
- Freeman, S. N., Isaac, N. J. B., Besbeas, P., Dennis, E., B. and Morgan, B, J., T. (2020) A Generic Method for Estimating and Smoothing Multispecies Biodiversity Indicators Using Intermittent Data. Journal of Agricultural, Biological and Environmental Statistics, 26, 71 to 89. doi.org/10.1007/s13253-020-00410-6
Categories:
Published: