Removal of greenhouse gases by UK forests
Last updated: 2025
Latest data available: 2025
|
In 2025 new indicators have been developed and published in the UK Biodiversity Indicators suite. These indicators were developed to report on progress towards the goals and targets of the Kunming-Montreal Global Biodiversity Framework. Alongside this, the Biodiversity Indicators production team have sought feedback from our users, and used this feedback to identify existing indicators which can be discontinued whilst minimising impact on our users. |
Introduction
Forests are a large store of carbon and also act as an active carbon ‘sink’, removing carbon dioxide (CO2), a greenhouse gas (GHG), from the atmosphere and storing it as carbon in living biomass, leaf litter and forest soil. This sequestration of CO2 is an essential ecosystem service.
This indicator shows the cumulative net removal of GHGs from the atmosphere by UK forests since 1990. It is split between type of woodland (conifer and broadleaf). Showing GHG removals by type of woodland is interesting from a biodiversity perspective as it allows a clearer presentation of the contribution made to GHG removals by broadleaf woodland, most of which constitutes a UK priority habitat.
Data for this indicator can be found in the published datafile. We also have a similar indicator at the England level.
Type of indicator
Benefit indicator
Type of official statistics
Official statistic
Assessment of change
Cumulative net removals of greenhouse gases by UK forests.
| Measure | Assessment | Time period | Result |
|---|---|---|---|
| Cumulative net removals | Long term | 1990 to 2023 | Improving |
| Cumulative net removals | Short term | 2018 to 2023 | Improving |
Notes on the indicator assessment
Long- and short-term assessments are based on a 3% rule of thumb. Where possible, the base years for these assessments use a three-year average. See Assessing indicators.
Key results
It is estimated that from 1990 to 2023, forests in the UK have (cumulatively) removed the equivalent of 590.4 million tonnes of carbon dioxide (Mt CO2e) from the atmosphere (Figure 1).
Although the indicator is assessed as improving in both the long term and short term since cumulative GHG removals have continued to increase, annual rates of removal have remained relatively static over the last 20 years, with UK forests removing an estimated 17.4 Mt CO2e in 2023 (Figure 2).
The proportion of GHGs removed from the atmosphere by broadleaf woodland has fluctuated through the time series, but was greater in 2023 than when the time series began, accounting for 53% (9.2 Mt CO2e) of the estimated annual removals in 2023 compared to 43% (5.9 Mt CO2e) of removals in 1990 (Figure 2).
Figure 1: Cumulative net removals of greenhouse gases by UK forests, 1990 to 2023
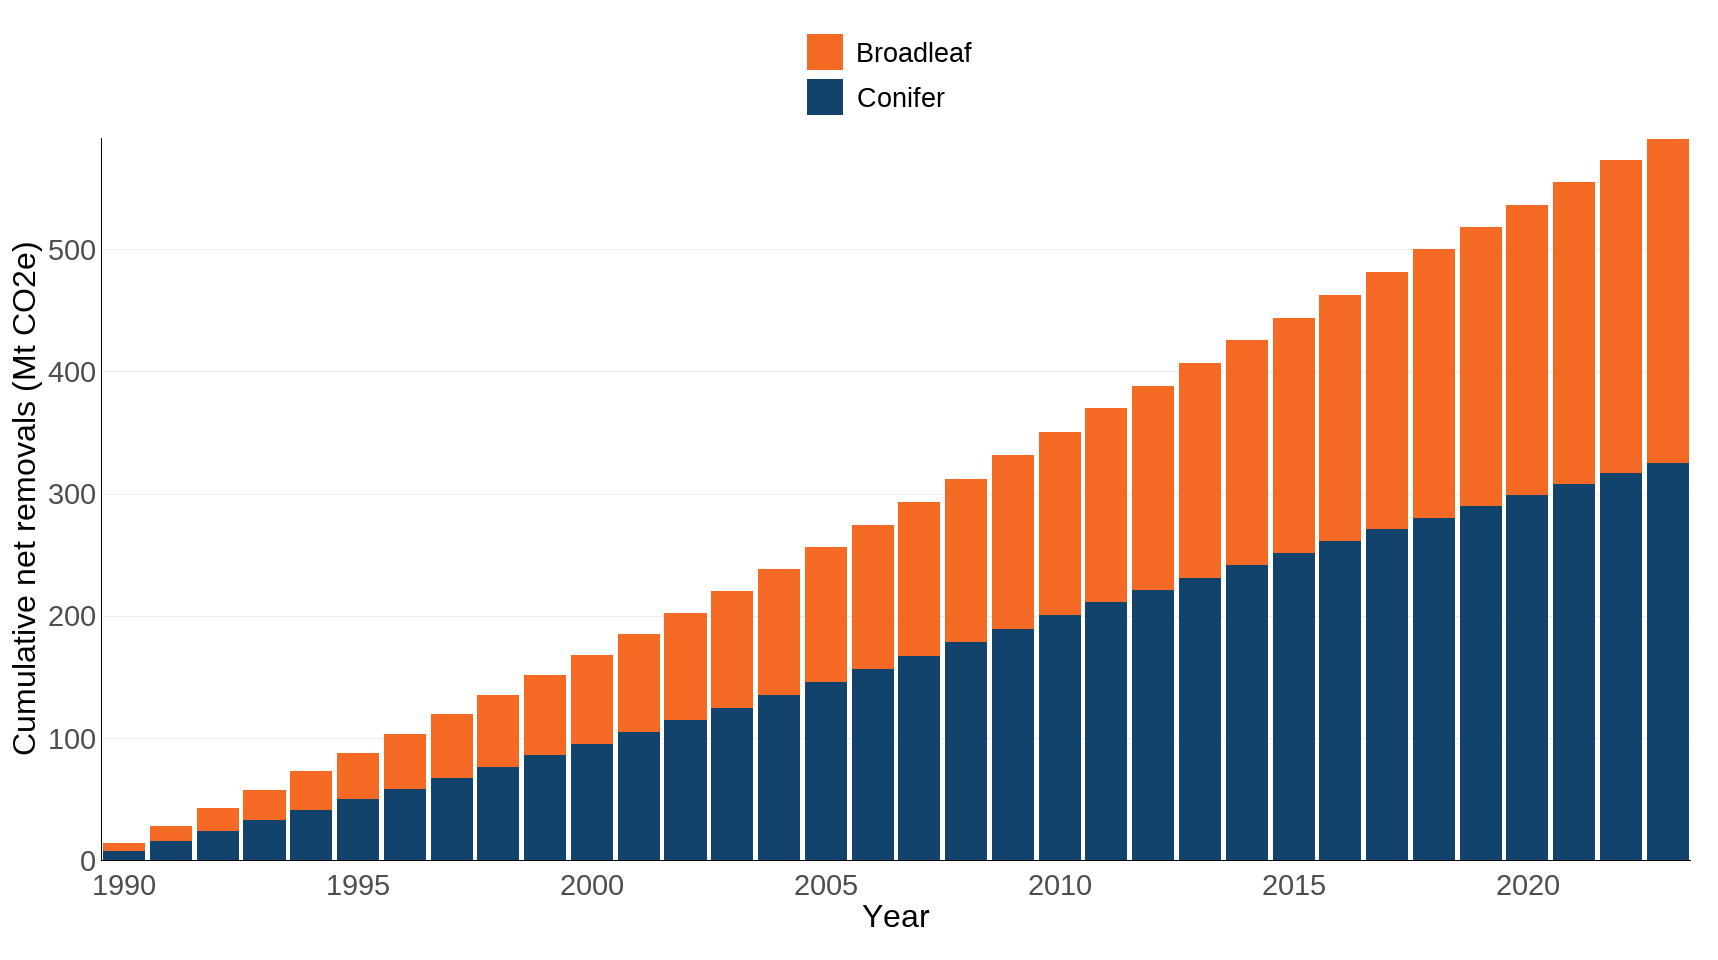
Source: Department for Energy Security and Net Zero (DESNZ) – Land Use, Land Use Change and Forestry (LULUCF) greenhouse gas inventory
Notes about Figure 1
- Estimated cumulative net removals of GHGs (carbon dioxide (CO2), methane (CH4) and nitrous oxide (N2O)) from the atmosphere by forests in the UK, expressed as million tonnes of CO2 equivalent (Mt CO2e).
- Revised in 2025 due to improvements in the CARBINE model and forest planting and harvesting statistics (see ‘Further detail’).
- The results presented here are therefore not directly comparable with those in previous publications.
Figure 2: Annual net removals of greenhouse gases by UK forests, 1990 to 2023
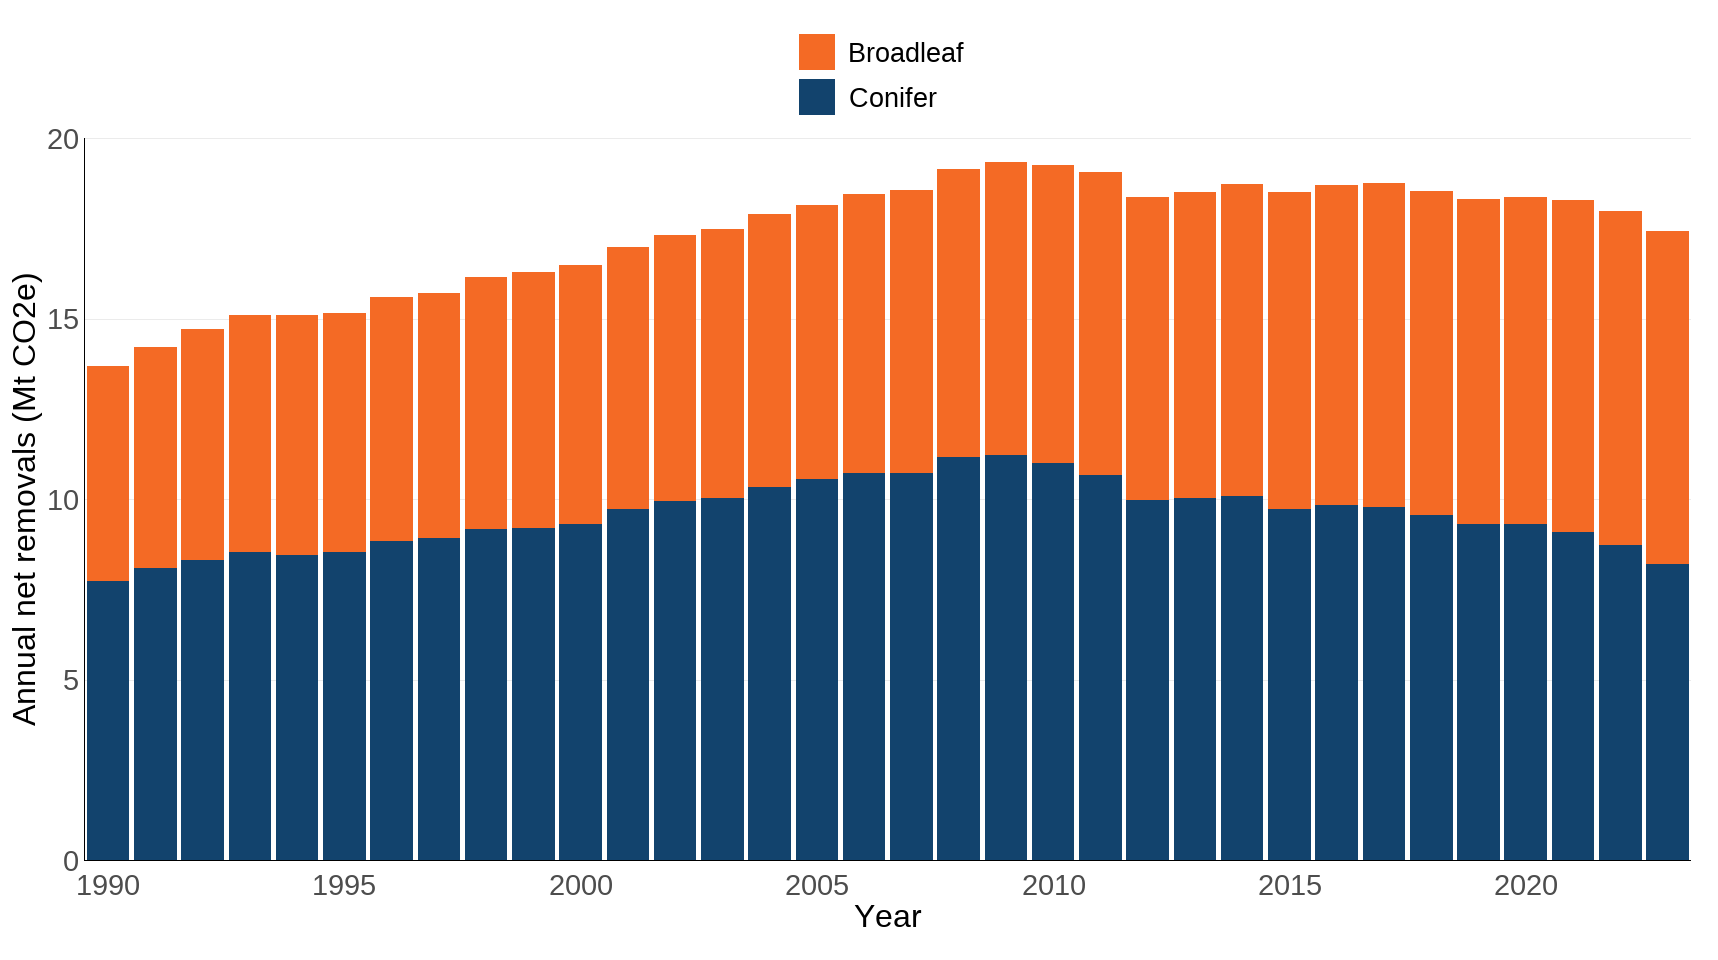
Source: Department for Energy Security and Net Zero (DESNZ) – Land Use, Land Use Change and Forestry (LULUCF) greenhouse gas inventory
Notes about Figure 2
- Estimated annual net removals of GHGs (carbon dioxide (CO2), methane (CH4) and nitrous oxide (N2O)) from the atmosphere by forests in the UK, expressed as million tonnes of CO2 equivalent (Mt CO2e).
- Revised in 2025 due to improvements in the CARBINE model and forest planting and harvesting statistics (see ‘Further detail’).
- The results presented here are therefore not directly comparable with those in previous publications.
Further detail
The data presented here are from the UK’s Land Use, Land Use Change and Forestry (LULUCF) GHG inventory, which provides estimates of the annual rate of emissions and removals of GHGs (carbon dioxide (CO2), methane (CH4) and nitrous oxide (N2O)) from the atmosphere by forests in the UK between 1990 and 2023 (Figures 1 and 2). LULUCF emissions and removals are given in terms of carbon dioxide equivalent (CO2e). The CO2e of a mixture of GHGs is the quantity of CO2 that would have the same global warming potential.
National Inventories of human-induced sources and sinks of GHGs are submitted by Parties, including the UK, to the United Nations Framework Convention on Climate Change (UNFCCC) every year. This system was set up to meet the reporting obligations of the Convention and is used to report on progress in meeting the Paris Agreement commitments. Under the Paris Agreement, which entered into force in 2016, the UK is required to set emission reduction targets every five years, known as Nationally Determined Contributions (NDCs). For its First NDC, the UK has committed to reduce total net greenhouse gas emissions by at least 68% in 2030, compared to 1990 levels. This includes all greenhouse gases, with the major contributors being CO2, CH4 and N2O. The LULUCF greenhouse gas inventory covers emissions and removals of these three GHGs resulting from direct human-induced land use, land-use change and forestry activities. This year indirect N2O emissions from fertilisation and mineralisation are now included in the Forest Land category (and hence this indicator), rather than at the LULUCF total level. The LULUCF estimates are compiled for the Department for Energy Security and Net Zero (DESNZ) by the UK Centre for Ecology & Hydrology (UKCEH) and Forest Research.
The forestry figures in the 1990 to 2023 LULUCF inventory have been revised and therefore the figures presented here are not directly comparable to those in previous publications. Changes are due to improvements made to the Forest Research CARBINE model and a full explanation of the (most recent) changes can be found on page 412 of the National Inventory Report. Briefly, the reported overall net GHG sink in forest land in the UK (category 4A, see report) has increased by between 0.01 and 0.4 Mt CO2e (0.06 to 2.25%) across the time series compared to the previous inventory.
The changes either are or relate to:
-
Updated wildfire activity data. Wildfire activity data from Wales was not available for 2022 in the previous submission but is now included.
-
Updated forest land activity data from the 2024 preliminary Forestry Statistics and updated estimates of deforestation based on new peatland rewetting data for Scotland and Northern Ireland.
-
Updates to the CARBINE model. These include:
- improved estimates of early tree growth, the incorporation of carbon from dead branches into the soil carbon pool
- a change in the dead branch decay rate from 4% to 14% to match the model description
- a correction to the anaerobic conditions soil water availability modifier in the Scotia soil sub-model
- a correction to the Northern Ireland reconcile process to improve estimation of harvest intensity for private forests
The effect of these model changes at a UK level is an increase in the conifer forest GHG sinks for all years between 1990 and 2022. For broadleaf forests, GHG sinks are lower than in the previous inventory until 2015 when they increase until 2022. For both groups the difference in annual GHG emissions increases over time, particularly from 2012 onwards.
Table 1 shows a comparison of the total estimated amount of CO2 removals by forests in the UK and in each of the four individual countries between 1990 and 2023. Forests in England were estimated to have removed a cumulative total of 278.4 Mt CO2e (47% of the total for the UK); forests in Scotland, an estimated 246.2 Mt CO2e (42% of the UK total); forests in Wales, an estimated 48.9 Mt CO2e (8% of the UK total); and forests in Northern Ireland, an estimated 16.9 Mt CO2e (3% of the UK total).
Table 1: Cumulative net removals of greenhouse gases by UK forests as of 31 December 2023 (Mt CO2e)
| Country | Broadleaf | Conifer | All species |
|---|---|---|---|
| England | 195.8 | 82.6 | 278.4 |
| Scotland | 41.1 | 205.1 | 246.2 |
| Wales | 24.3 | 24.6 | 48.9 |
| Northern Ireland | 4.3 | 12.6 | 16.9 |
| UK | 265.5 | 324.8 | 590.4 |
Source: Department for Energy Security and Net Zero (DESNZ) – Land Use, Land Use Change and Forestry (LULUCF) greenhouse gas inventory
Notes about Table 1
- Totals for ‘All species’ and the UK may not add due to rounding.
Table 2 shows a comparison of the total estimated amount of CO2 removals by forests in the UK and in each of the four individual countries in 2023. Forests in England were estimated to have removed an annual total of 8.4 Mt CO2e (48% of the total for the UK); forests in Scotland, an estimated 7 Mt CO2e (40% of the UK total); forests in Wales, an estimated 1.4 Mt CO2e (8% of the UK total); and forests in Northern Ireland, an estimated 0.6 Mt CO2e (3% of the UK total).
Table 2: Annual net removals of greenhouse gases by UK forests in 2023 (Mt CO2e)
| Country | Broadleaf | Conifer | All species |
|---|---|---|---|
| England | 6.4 | 2.0 | 8.4 |
| Scotland | 1.7 | 5.4 | 7.0 |
| Wales | 1.0 | 0.4 | 1.4 |
| Northern Ireland | 0.1 | 0.4 | 0.6 |
| UK | 9.2 | 8.2 | 17.4 |
Source: Department for Energy Security and Net Zero (DESNZ) – Land Use, Land Use Change and Forestry (LULUCF) greenhouse gas inventory
Notes about Table 2
- Totals for ‘All species’ and the UK may not add due to rounding.
National Forest Inventory
The estimated carbon stock of woodland trees in the UK can be used as a complementary measure of carbon storage. Information on current carbon stocks of forests in the UK were first gathered in 2014 using National Forest Inventory (NFI) data, based on a sample of woodlands equal to or greater than 0.5 hectares in size. These figures are now based on carbon stock estimates from the UK greenhouse gas inventory for forests greater than 0.1 hectares in size and are therefore on a different basis to previous estimates.
Fieldwork for NFI data on the carbon stock of all species of tree within forests in the UK is conducted every five years. The latest data is to 31 March 2025. At this point, there was estimated to be a total of 269.6 Mt of carbon (989.4 Mt CO2e) across all species of tree within forests in the UK (see Figure 3). Broadleaved trees, with an estimated carbon stock of 137.5 Mt (504.6 Mt CO2e), were responsible for a slightly greater proportion of the total UK carbon stock than conifer trees, which were estimated to have a total stock of 132.1 Mt (484.8 Mt CO2e). This difference reflects the fact that in the UK, the total ‘growing stock volume’ (as opposed to the total area) of broadleaved woodland covered by the NFI is slightly greater than that of conifer woodland.
Figure 3: Total carbon stocks in living conifer and broadleaved woodland trees in the UK, 1990 to 2025
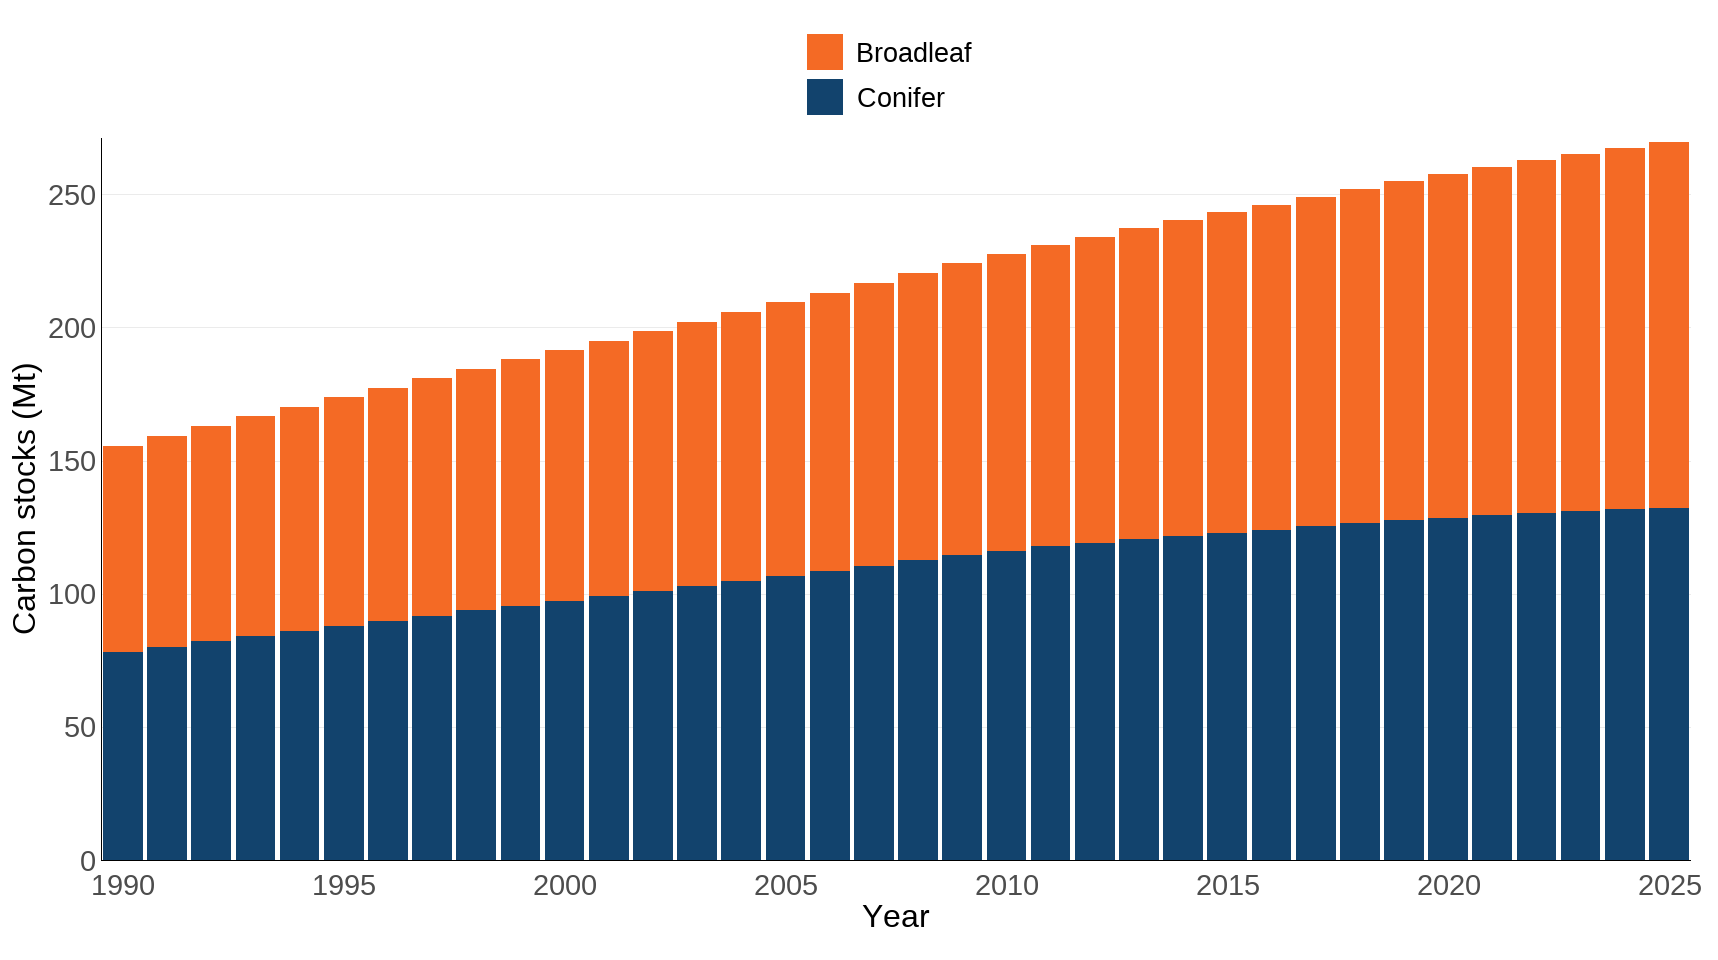
Source: Forestry Commission – National Forest Inventory
Notes about Figure 3
- Estimated total carbon in all living trees (including both above-ground and below-ground biomass) within woodlands of England, Scotland, Wales and Northern Ireland (in million tonnes, Mt).
Fieldwork for the current NFI began in 2009 and is conducted on a five-year cycle. The assessment of woodland carbon stocks from this inventory has formed a new baseline for carbon accounting within British forests and woodlands. Estimates of carbon stocks are determined by the total growing stock volume of woodland; this is a function of both woodland area and woodland characteristics (for example, number of trees, tree height and tree diameter) within this area.
Table 3 shows a comparison of the estimated amount of carbon in living woodland trees in the UK and in each of the four individual countries as of 31 March 2025. England was estimated to have a total of 136.4 Mt of carbon in living trees (51% of the total for the UK); Scotland, an estimated 99.3 Mt (37% of the UK total); Wales, an estimated 24.7 Mt (9% of the UK total); and Northern Ireland, an estimated 9.1 Mt (3% of the UK total).
Table 3: Total carbon stocks in coniferous and broadleaved woodland trees in the UK, by country, as of 31 March 2025 (Mt carbon)
| Country | Broadleaf | Conifer | All species |
|---|---|---|---|
| England | 100.1 | 36.3 | 136.4 |
| Scotland | 21.5 | 77.8 | 99.3 |
| Wales | 12.8 | 11.9 | 24.7 |
| Northern Ireland | 3.1 | 6.0 | 9.1 |
| UK | 137.5 | 132.1 | 269.6 |
Source: Forestry Commission – National Forest Inventory
Notes about Table 3
- Totals for ‘All species’ and the UK may not add due to rounding.
The latest NFI fieldwork cycle began in 2020 and will run until 2025, after which point new data will be available and this indicator will be updated. The NFI assessment of woodland carbon stocks was used in the development of reporting on LULUCF emissions and removals. However, as there are differences in both the scope and the data sources used for LULUCF (sequestration) and NFI (stock) figures, they are not directly comparable. More information can be found in the Forest Research Report (PDF, 1.29Mb).
Relevance
The benefits that humans receive from the environment have become more widely recognised. The Millennium Ecosystem Assessment and the more recent UK National Ecosystem Assessment both highlighted that ecosystems and the services they deliver underpin our very existence. We depend on them to produce our food and timber, regulate water supplies and climate, and breakdown waste products. We also value them in less obvious ways: contact with nature gives pleasure, provides recreation and is known to have a positive impact on long-term health and happiness. Measuring the status of ecosystem services is therefore a critical aim of the indicator set. GHG removal is a regulating service that contributes to reducing the scale and future impacts of climate change (climate change mitigation).
International/domestic reporting
The UK Biodiversity Indicators have been reviewed in response to the latest goals and targets agreed under the Kunming-Montreal Global Biodiversity Framework (GBF) of the Convention on Biological Diversity (CBD). The indicators are being adapted, with some new indicators being developed, to better align them with the monitoring framework for the GBF. The suite of biodiversity indicators is therefore expected to change ready for forthcoming UK national reports to CBD in 2026 and 2029.
Web links for further information
- Forestry Commission: Carbon in live woodland trees in Britain, National Forest Inventory Report (PDF, 1.29 Mb)
- Forestry Commission: Understanding the carbon and greenhouse gas balance of forests in Britain (PDF, 7.24 Mb)
- Forest Research: Forestry Statistics and Forestry Facts & Figures
- Millennium Ecosystem Assessment: Home Page
- National Atmospheric Emissions Inventory: Greenhouse Gas emissions Reports
- UK National Ecosystem Assessment: Home Page
Acknowledgements
Thank you to the many people who have contributed by providing data and to the many colleagues who have helped produce this indicator.
Development plan
Since our previous publication we have adapted the language and visualisations used in this indicator. We are keen to hear from our users about these changes, as well as our published development plan, please email us.
Categories:
Published: