Biodiversity information for conservation decision making
Last updated: 2025
Latest data available: 2025
Introduction
This indicator presents trends in the use of biodiversity records, download events, and total number of users. Data for this indicator is provided by the National Biodiversity Network (NBN) Atlas.
Good policy making and evaluation is based on evidence. Millions of biological observations (records) have been recorded in the UK over the past century by a wide variety of organisations and individuals. This indicator provides an evaluation of the use and spatial resolution of records in the National Biodiversity Network (NBN) Atlas over time, as a proxy for the evidence available to underpin conservation decision making.
Data for this indicator can be found in the published datafile.
This indicator has been substantially redeveloped, and as a result is not directly comparable with the previous publication. This is due to the need for closer alignment with the Convention on Biological Diversity (CBD) Kunming-Montreal Global Biodiversity Framework (GBF); this is the headline indicator for GBF Target 21. In addition, significant changes in data and methods at the National Biodiversity Network (NBN) Atlas means that it is not possible to continue the previous data series. Feedback from users suggests that the new approach of presenting the date associated with a record, rather than the date a record was uploaded, is more useful. For archive purposes the previous data is available in the published datafile. Please see the Development Plan for more details and to contact us.
Type of indicator
Benefit indicator
Type of official statistics
Official statistic
Contents
- Assessment of change
- Key results
-
Further detail
- Figure 4: Records added to the National Biodiversity Network, 2004 to 2023
- Figure 5: Records within the National Biodiversity Network associated with a decade, 1950s to 2025
- Figure 6: Biodiversity records by spatial resolution, 2017 to 2025
- Figure 7: Number of new NBN Atlas users by year, 2017 to 2025
- Relevance
- International/domestic reporting
- Web links for further information
- Acknowledgements
- Technical annex
- Caveats and limitations
- Development plan
Assessment of change
The data series used for this indicator does not allow long-term assessment of change in the measures included.
| Measure | Assessment | Time period | Result |
|---|---|---|---|
| Number of records downloaded | Short term | 2019 to 2024 | Improving |
| Number of download events | Short term | 2019 to 2024 | Improving |
| Number of NBN Atlas users | Short term | 2019 to 2024 | Improving |
Notes on the indicator assessment
- Long- and short-term assessments are based on a 3% rule of thumb (see Assessing Indicators).
- The full data series for the revised indicator starts in April 2017 and finishes in March 2025. Assessments are based on the last 5 years which have data for all four quarters.
- Assessments are based on calculating the number of records downloaded, download events, and number of users in a start year, and comparing that with the end year.
Key results
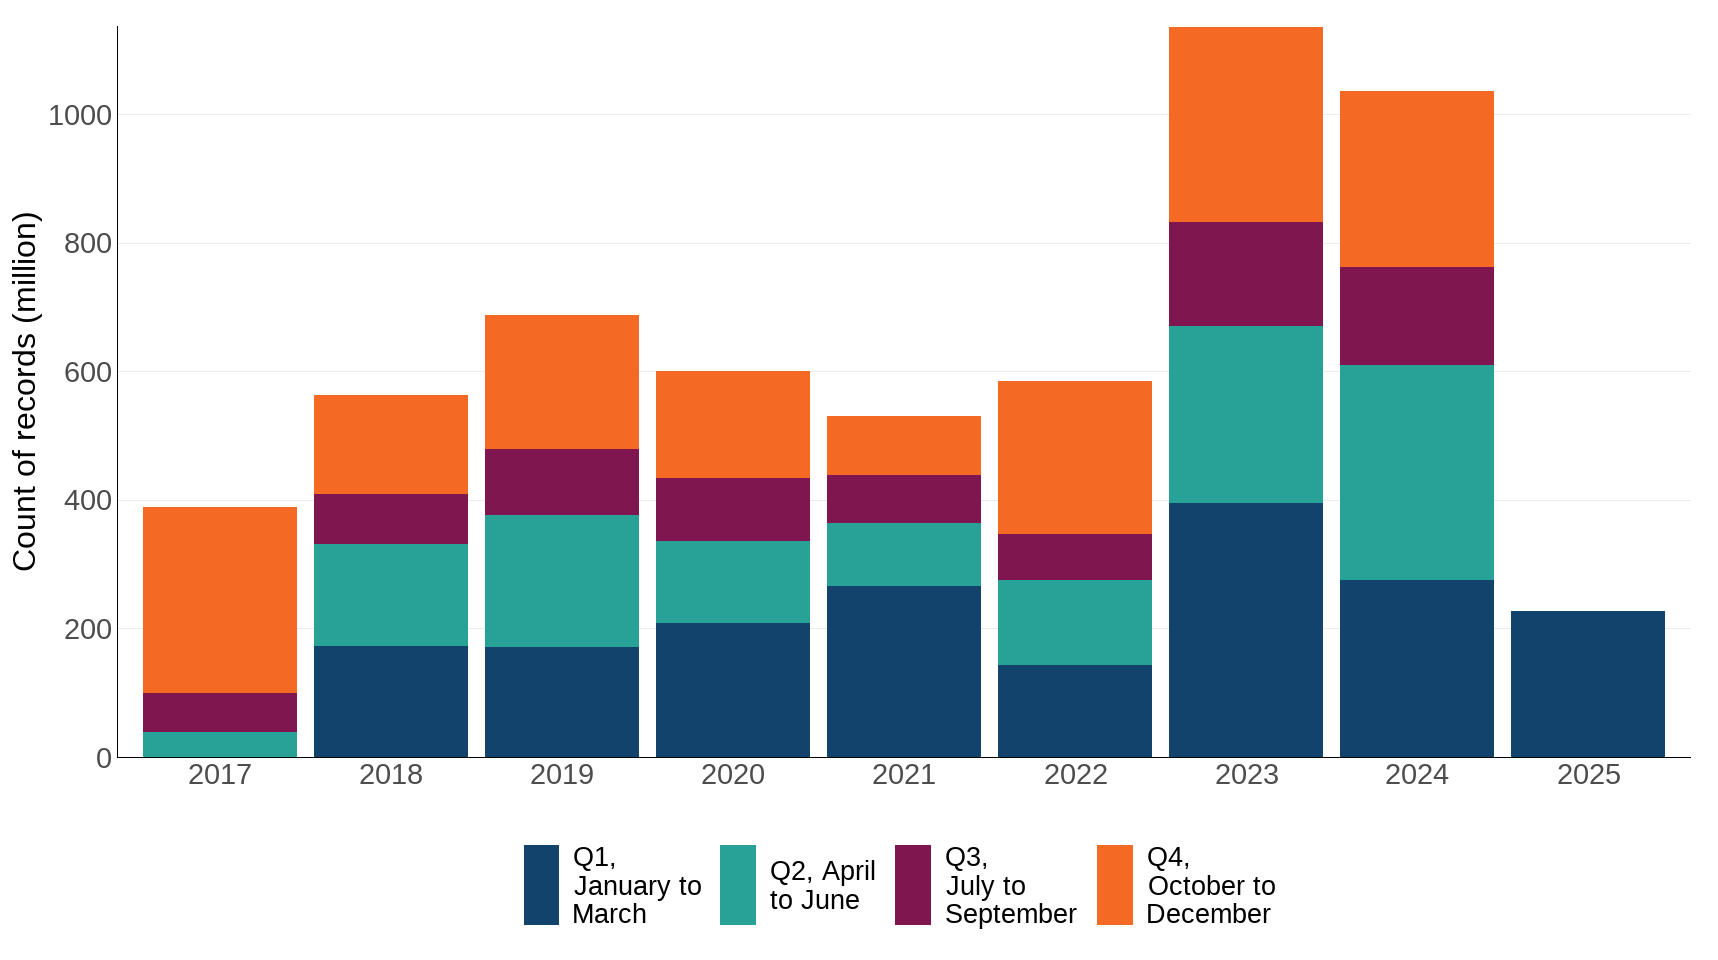
In 2019 688 million records were downloaded from the NBN Atlas; this increased by 50.5% to over 1 billion records in 2024 (Figure 1).
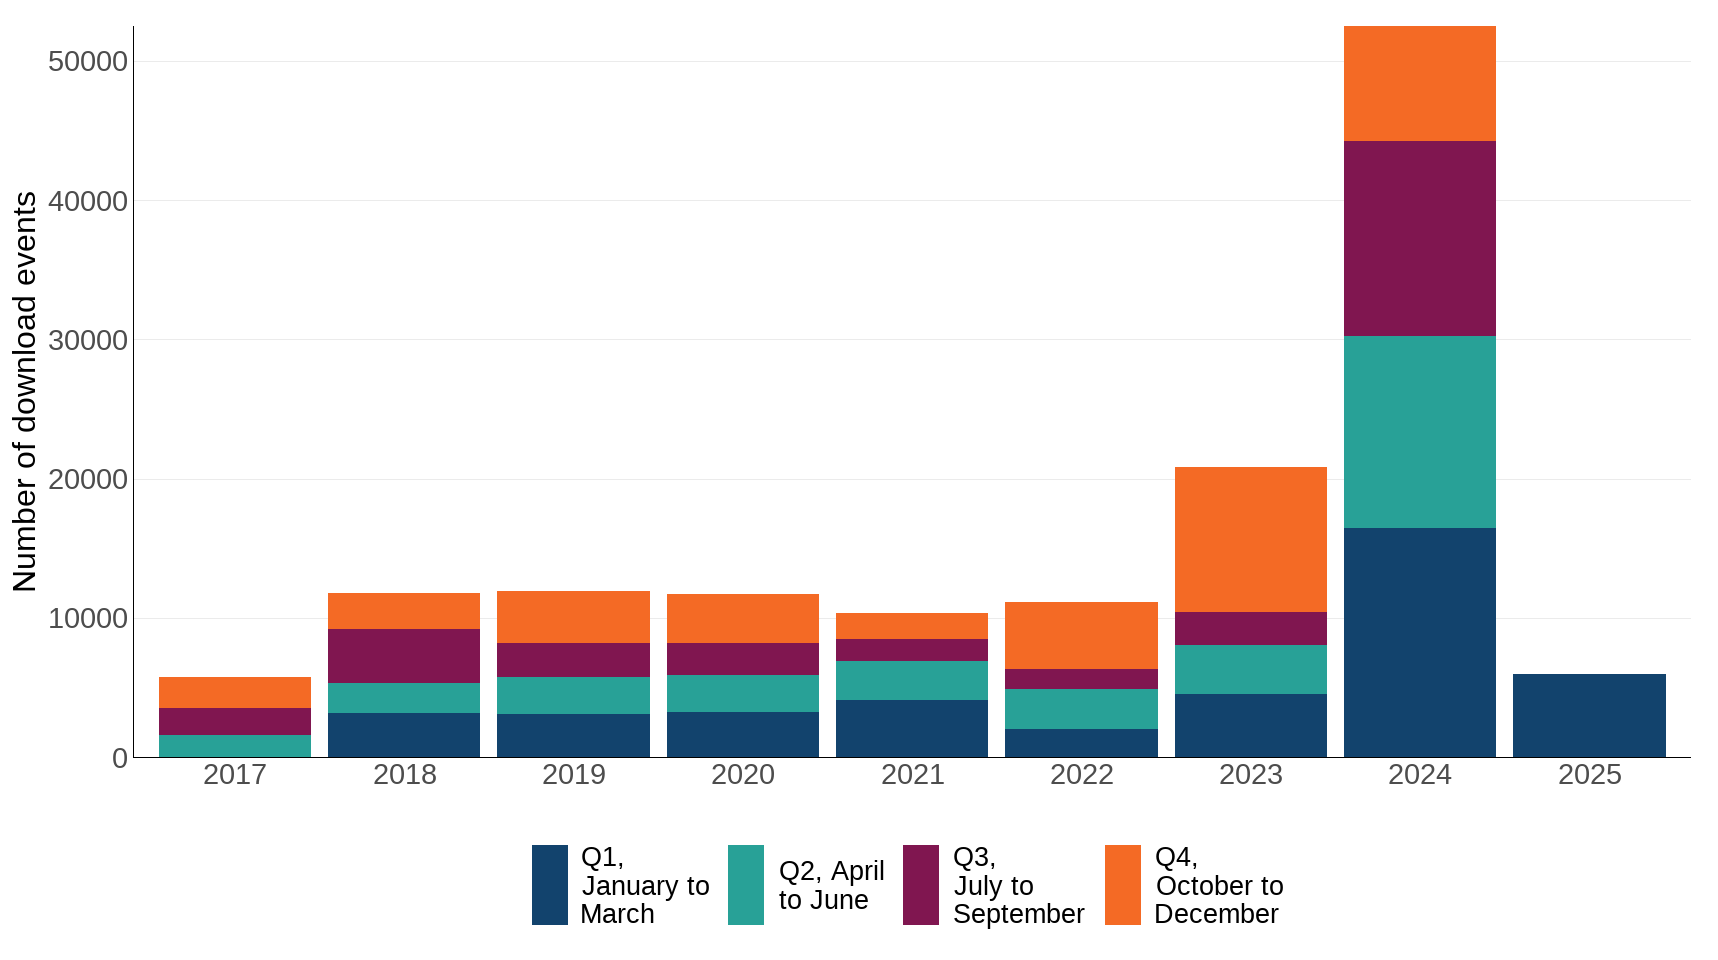
In 2019 the number of download events was 11,889. This increased 341% to 52,482 download events in 2024 (Figure 2).
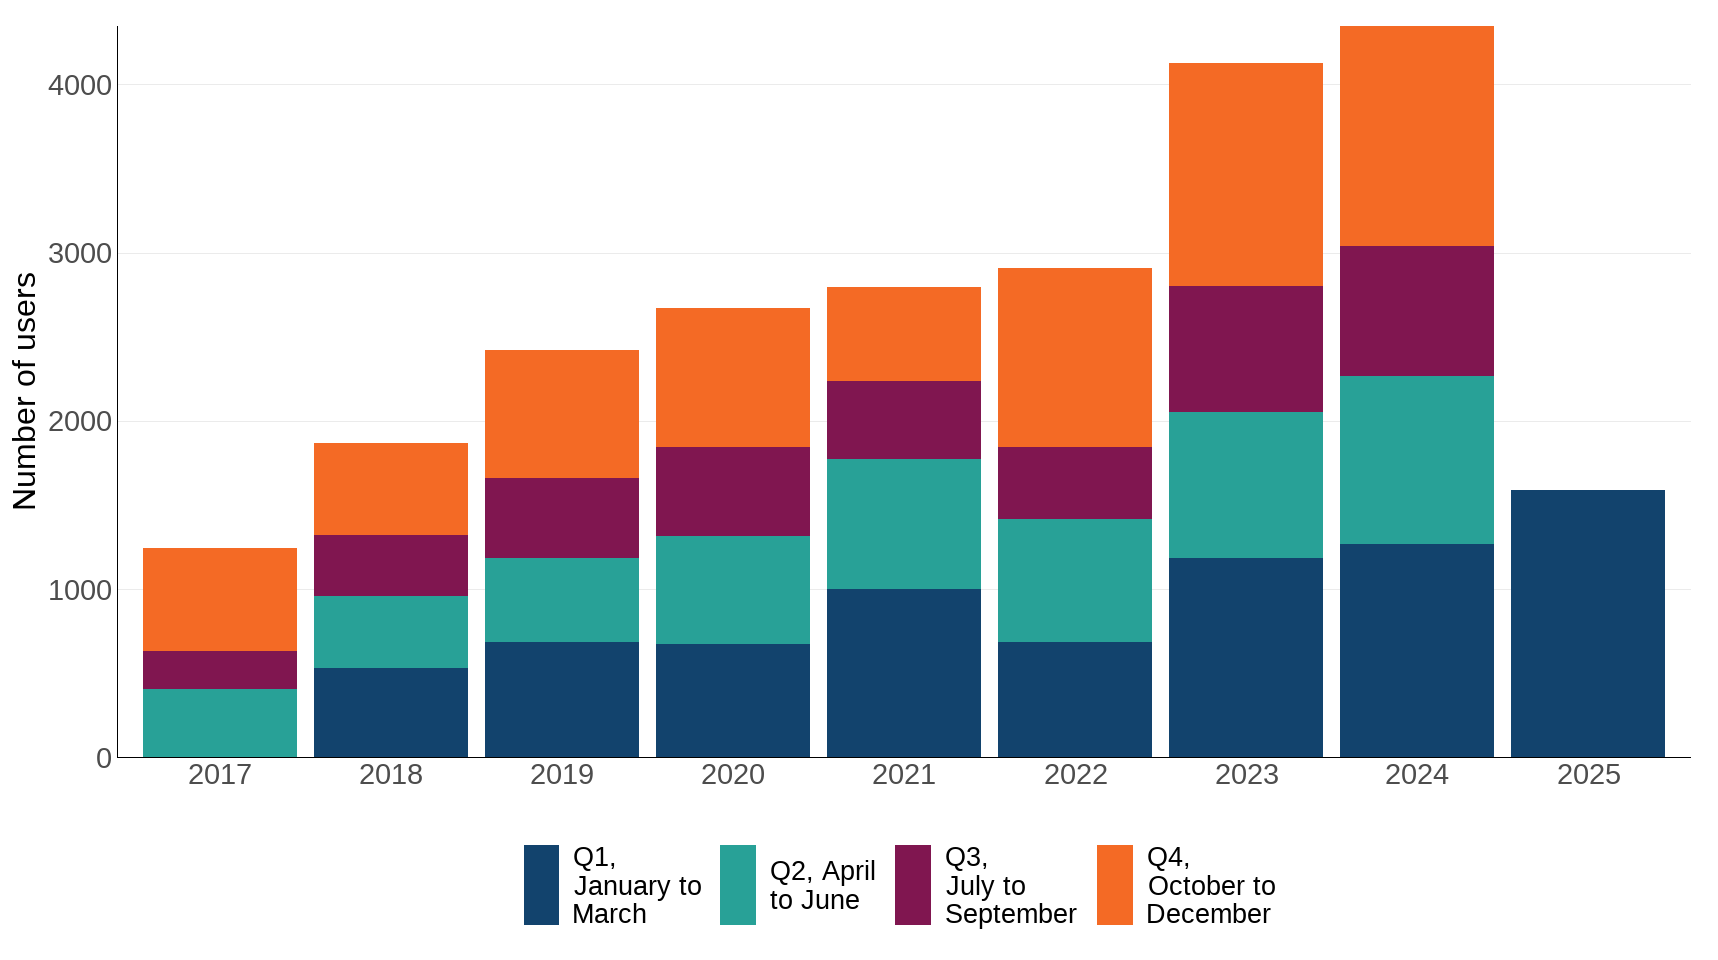
In 2019 the number of users downloading records was 2,423. This increased 79.4% to 4,346 in 2024 (Figure 3).
For presentation purposes here, figures 1-3 and 5 aggregate the number of records, which are associated with a month, into year quarters and then stack these into calendar years. The previous version of this indicator presents a longer time series but changes in methods mean that these datasets are not directly comparable.
Figure 1: Number of records downloaded per year, 2017 to 2025
Source: National Biodiversity Network Trust
Notes about Figure 1
- The data series starts in April 2017, data from the first quarter of 2017 is not available for reporting.
- Individual records may be downloaded on multiple occasions, and therefore the number of records downloaded per quarter are not unique records.
Figure 2: Number of download events per year, 2017 to 2025
Source: National Biodiversity Network Trust
Notes about Figure 2
- The data series starts in April 2017. Data from the first quarter of 2017 is not available for reporting.
- The high number of records downloaded in 2024 may be due to new biodiversity legislation enacted at this time; however, this cannot be verified.
Figure 3: Number of users downloading records, 2017 to 2025
Source: National Biodiversity Network Trust
Notes about Figure 3
- The data series starts in April 2017, data from the first quarter of 2017 is not available for reporting.
- Individual users may download records on more than one occasion, so the users downloading records may be duplicated.
Further detail
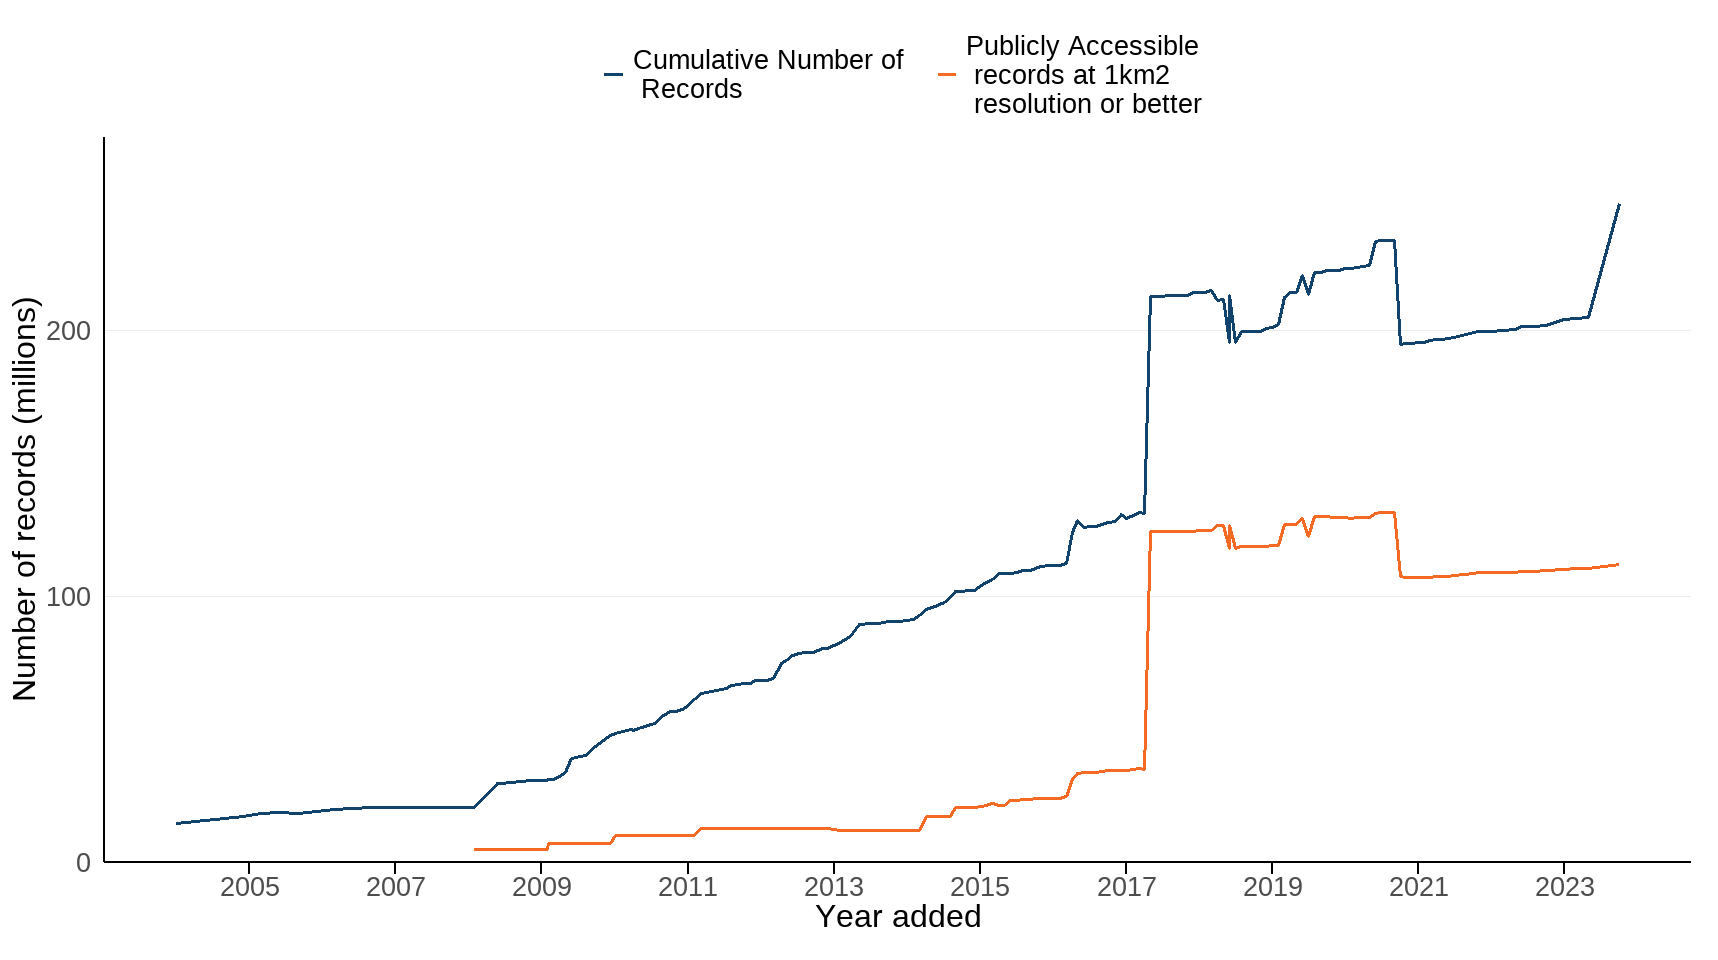
The previous version of this indicator focused on the increasing number of records in the National Biodiversity Network (NBN) Atlas (which replaced the NBN Gateway in April 2017) over time (Figure 4). The updated methodology for this indicator focuses on the access to these records, as a proxy for the use of available evidence to underpin conservation decision making.
Figure 4: Records added to the National Biodiversity Network, 2004 to 2023
Source: National Biodiversity Network Trust
Notes about Figure 4
- The step change observed in both time series in 2017 is due to the move from the NBN Gateway to the NBN Atlas and the addition of 10 large datasets by the British Trust for Ornithology (BTO) (see Indicator description section for further details).
- The number of records dropped in May 2018 as a result of the system behind the NBN Atlas not saving the date (timestamp field) of when the records were first created. In addition to this, there were technical challenges between the transfer of data from the Gateway to the NBN Atlas, where the NBN had to delete records first before they are updated. Both of these problems have now been resolved.
- The number of records dropped in September 2020 as a result of the BTO updating their datasets and aggregating many records.
- Data available to September 2023 - this figure has not been updated for this version of this indicator.
Figure 5: Records within the National Biodiversity Network associated with a decade, 1950s to 2025
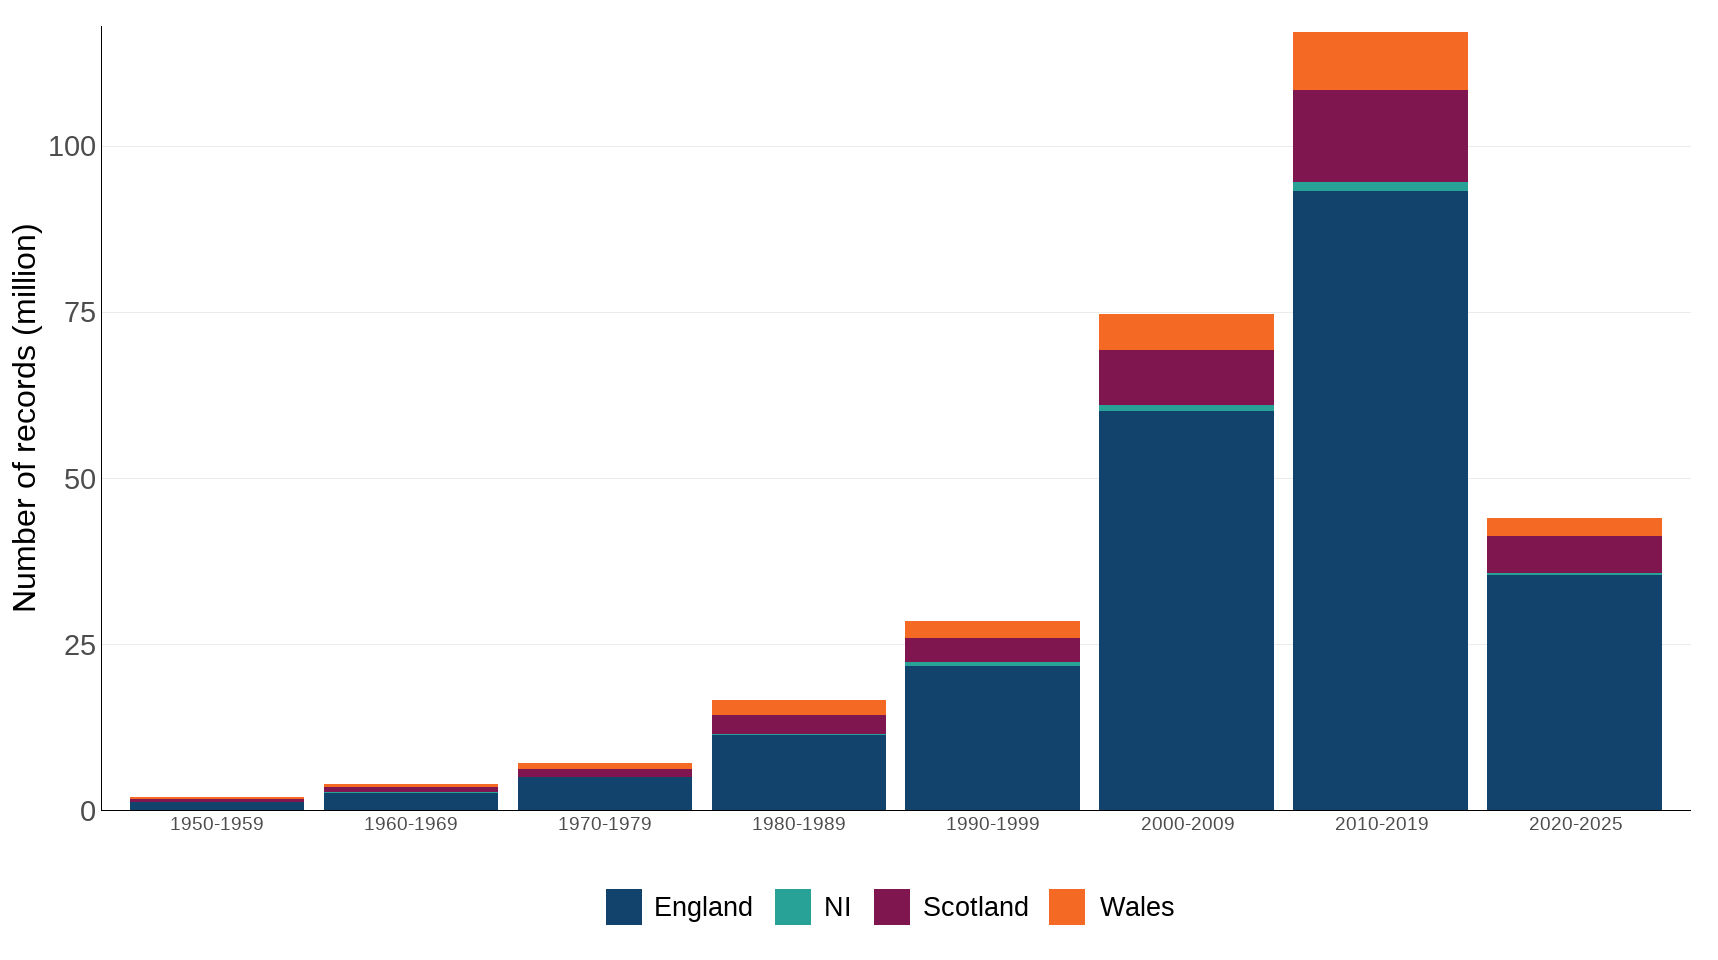
Source: National Biodiversity Network Trust
Notes about Figure 5
- Data for the period 2020 to 2025 is included as a partial decade in this figure.
- Dates in this figure refer to the date of the record, not when the record was added to the NBN.
- The majority of records are dated between 2000 and 2025.
- This figure focuses date of the observation record, not on the date the information was added to the NBN, which was the focus of the previous indicator. This new presentation is more useful as it allows users to see how old the records in the NBN Atlas are; due to changes in methodology it is not possible to present new data in both formats.
Millions of biological observations (records) have been recorded in the UK over the past century by a wide variety of organisations and individuals. Most of these records are documented by volunteers who organise themselves through many national and local societies and recording schemes. The UK and devolved governments (through their conservation and environmental bodies), local government and non-government wildlife-related organisations all collect and use biodiversity data. Information is held by many different organisations, and the individuals who collect it use a variety of formats, from computer databases to handwritten record cards. This means that although a huge amount of information exists, it is not always easy to access.
One of the principal means of collation and interpretation of this data is the network of local records centres and the Biological Records Centre (BRC), which collates and interprets data from many national recording schemes. The BRC update 65 data resources on the NBN Atlas, often every other month. These are datasets from recording schemes and projects that use iRecord for record management and verification. The majority of the records shared are verified but some schemes and projects also share unverified records, which are clearly flagged as such within the NBN Atlas. BRC also supplies unverified data to the NBN Atlas for some species groups that are not currently covered by a national recording scheme.
Over recent decades, biodiversity records have been accumulating increasingly rapidly (Figure 4). During the period between the beginning of March and the end of April 2016, a large number of new and updated datasets were loaded on the NBN Gateway (around 210), including a new UK Butterfly Monitoring Scheme (UKBMS) dataset which added 5.7 million records. In addition, the update to the Butterfly Conservation’s National Moth Recording Scheme dataset added around 20 million records on the NBN Gateway.
A very large number of records were added to the NBN in April 2017 as a result of the changeover from the NBN Gateway to the NBN Atlas. Some of the large increase in the number of records is a result of the British Trust for Ornithology (BTO) adding 10 new datasets which accounted for nearly 156 million records in the Atlas. Approximately 55.8 million of the 95.5 million records that were on the Gateway were transferred to the Atlas. The remaining records were not transferred for a variety of reasons, such as data providers not taking the opportunity to update the datasets and/or requiring permission from the data owners. Figure 4 presents the timing of the addition of these records; Figure 5 presents the date associated with those records.
Records at a smaller geographical scale or resolution provide a more accurate location for where species were recorded, and help to provide more detailed information, for example, in planning casework. Figure 6 shows a snapshot of the number of records at different spatial resolutions since April 2017. Over time the resolution of records has improved; Figure 6 shows that there are many fewer records in the NBN Atlas at a resolution of greater than or equal to 10km2 than those less than 1km2.
Figure 6: Biodiversity records by spatial resolution, 2017 to 2025
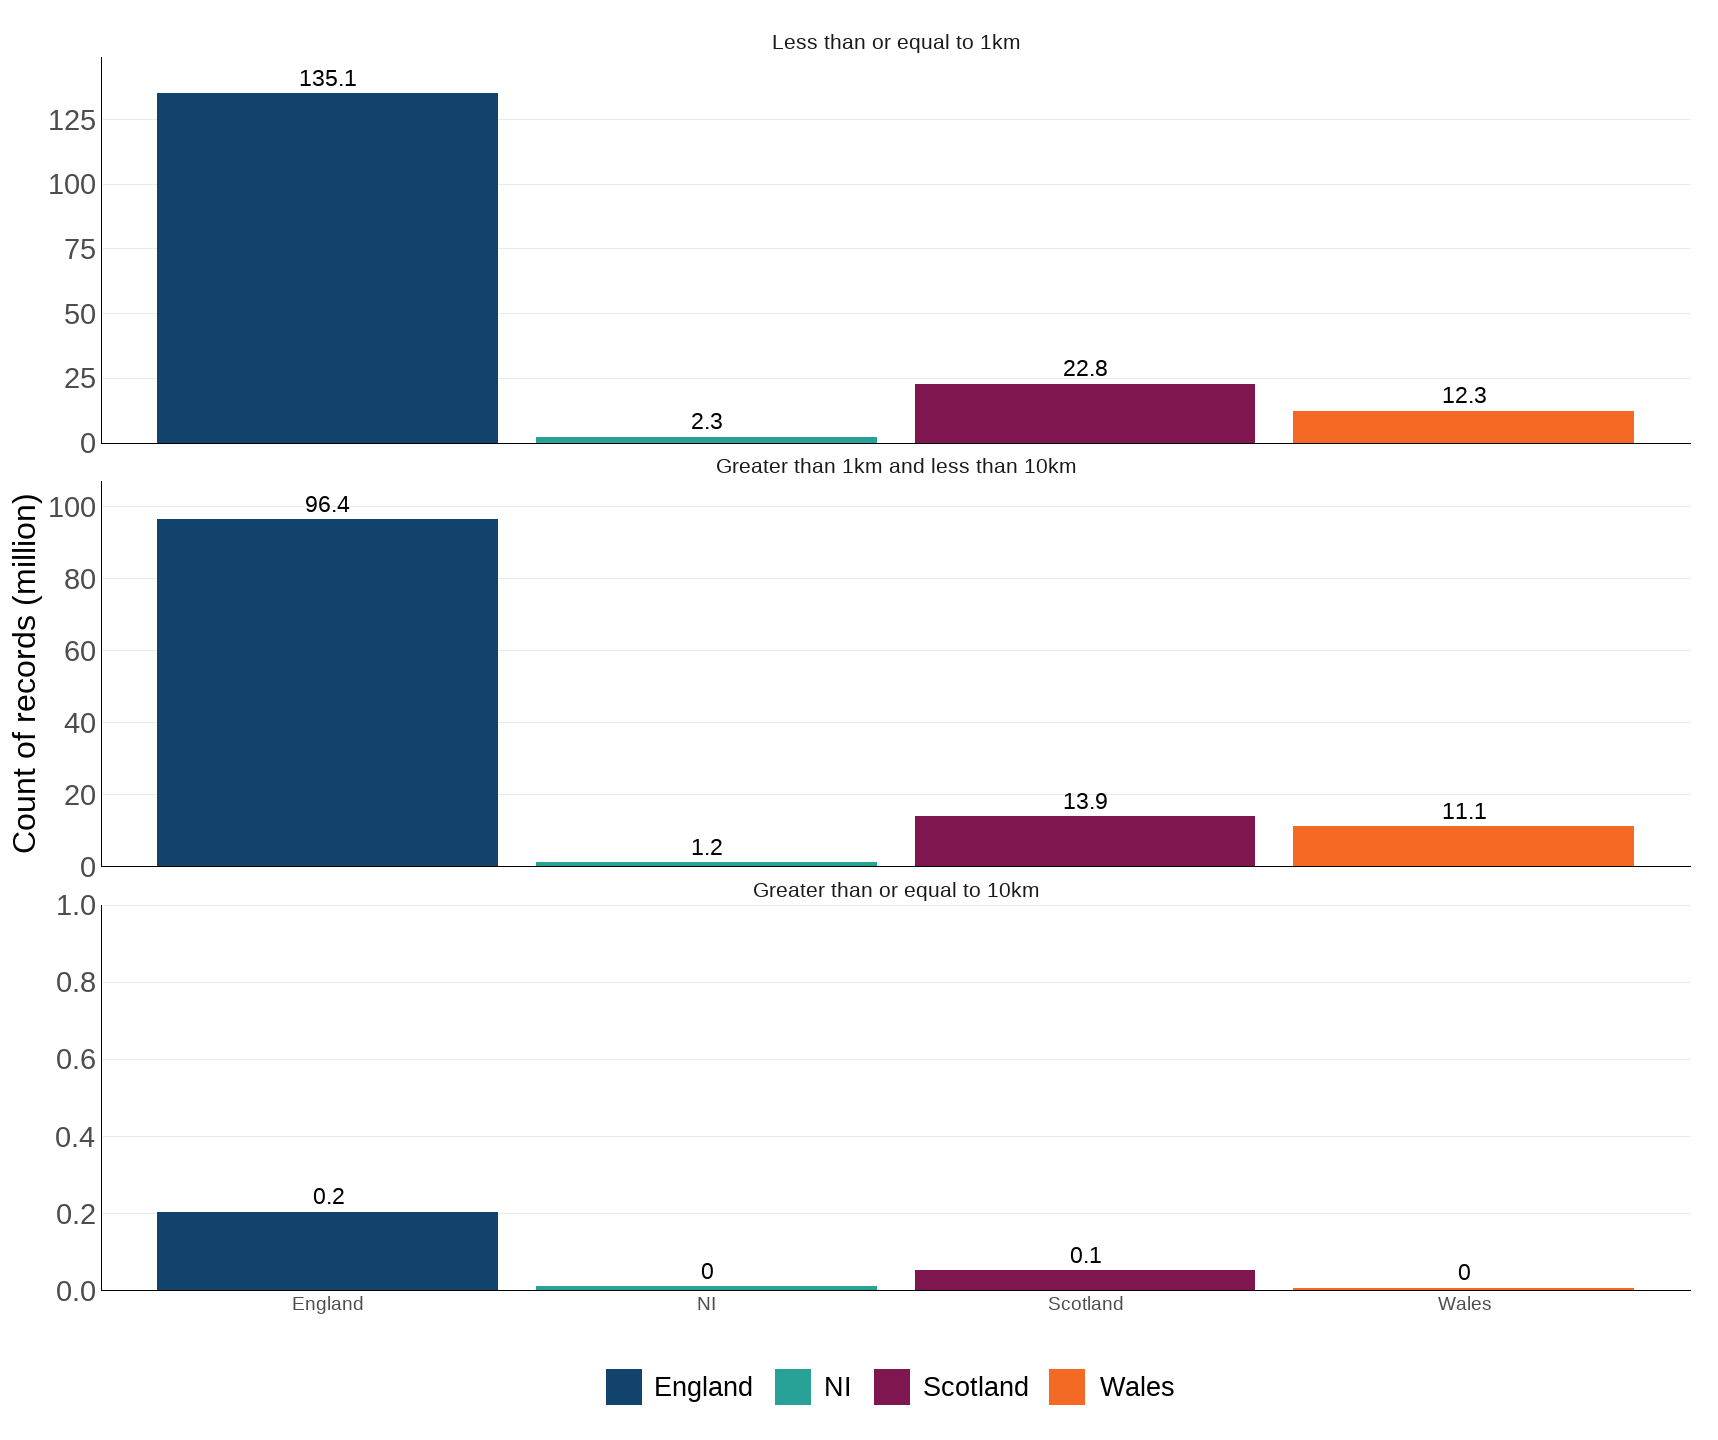
Source: National Biodiversity Network Trust
Notes about Figure 6
- This data is aggregated since April 2017 to show the availability of data at different spatial scales.
Figure 7: Number of new NBN Atlas users by year, 2017 to 2025
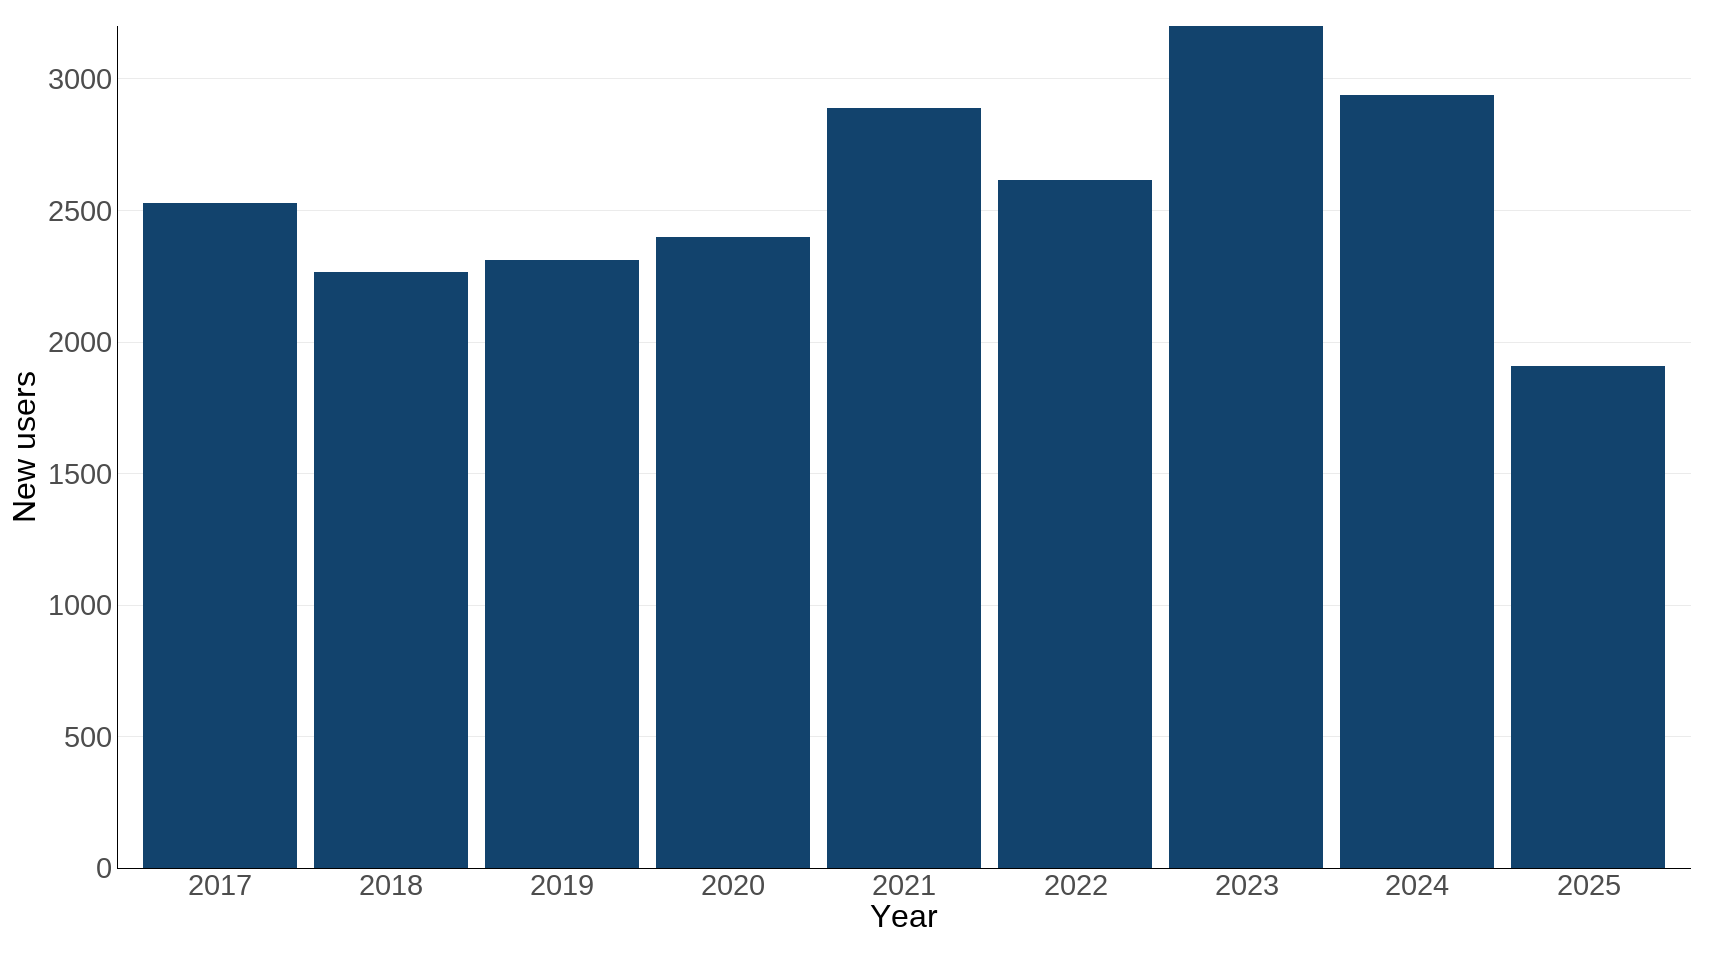
Source: National Biodiversity Network Trust
Notes about Figure 7
- Users need to register with the NBN Atlas if they wish to download data.
- Individuals may register for a particular download event, or may make multiple downloads within a year, or may be registered for multiple years, depending on what use they wish to make of NBN data.
Table 1: NBN Atlas User Affiliations since 2017
| Affiliation | Count |
|---|---|
| Academia and research | 6,785 |
| College and university student | 3,837 |
| Not supplied | 2,326 |
| Personal interest | 1,986 |
| Ecologist | 1,916 |
| Environmental consultant | 1,327 |
| Recorder and recording scheme | 1,210 |
| Local and national government | 906 |
| Teaching and education | 771 |
| NGO staff | 733 |
| Agriculture, forestry and fishing | 495 |
| Construction, utilities and technology | 468 |
| Artist, journalist, photographer | 112 |
| LERC staff | 110 |
| Museums, botanical gardens and aquaria | 67 |
Source: National Biodiversity Network Trust
Notes about Table 1
- These categories are defined by users when they register to download records from the NBN Atlas.
- These data are a snapshot of user affiliations of the NBN Atlas since 2017.
Figure 6 and Table 1 show the number of users registered with the NBN Trust to be able to download records and the sectors they have identified in their registration. A wide variety of affiliations are registered, showing the range of uses to which biological records can be put.
Relevance
Good policy making and evaluation is based on evidence. Evidence also helps to engage the public, natural resource managers and business to actively address biodiversity loss. There are therefore a range of geographic scales of decision making (from local to national) and audiences (public sector, industry, public, research, etc.) that have an interest in the availability of biodiversity data.
International/domestic reporting
The UK Biodiversity Indicators have been reviewed in response to the latest goals and targets agreed under the Kunming-Montreal Global Biodiversity Framework (GBF) of the Convention on Biological Diversity (CBD). The indicators have been adapted, with some new indicators being developed, to better align them with the monitoring framework for the GBF. The suite of biodiversity indicators has therefore changed ready for forthcoming UK national reports to CBD in 2026 and 2029.
Web links for further information
Acknowledgements
Thank you to the many people who have contributed by providing data and to the many colleagues who have helped produce this indicator, particularly Will Millard and Mel Hardie at the National Biodiversity Network Trust.
Technical annex
The NBN Atlas is a free online tool that provides a platform to engage, educate and inform people about the natural world. It enables the combination of multiple sources of information about UK species and habitats, and provides the ability to interrogate, combine and analyse these data in a single location. Individual records, for example for plants, mammals, birds and invertebrates, are stored on the NBN Atlas. Records can be quickly and easily accessed and displayed on a map of the UK in a number of different ways to aid understanding of the distribution of particular species in the UK.
This biological information is vital if the distribution and abundance of species and habitats is to be understood. Without it, making informed decisions on how to protect the UK’s wildlife is much more difficult.
The NBN website works to set standards for data exchange and data accuracy, and captures wildlife data in a standard electronic form, allowing the integration of data from different sources, and use of the internet to enable data to be used in different ways by as many people as possible. The history of the development of the NBN Gateway and Atlas, and a detailed timeline are available from the NBN website.
Key milestones to note in the context of this indicator:
- The development of a prototype NBN Gateway in 2001.
- The redevelopment and relaunch of the Gateway in November 2013.
- The switch to the NBN Atlas in April 2017.
Registered users can request enhanced access to records of sensitive species from data providers through the NBN Atlas. If granted, the user can access higher resolution data just like under the previous NBN Gateway system. This gives data providers control over who can use their data for particular purposes. Where requests are made to access protected species records through the NBN Atlas, this can be given, but the location details are generalised in order to protect the location of the protected species. Enhanced access through the NBN Atlas is not available for all records, therefore users may need to contact data providers for this additional information. Government and its arms-length bodies have, over recent years, been moving towards open data, and the development of the NBN Atlas fits with that agenda.
Caveats and limitations
This indicator is focused on the availability of data collated by the National Biodiversity Network as a proxy for data being used for conservation decision making. Evaluating actual data use within decision making is challenging and not reported here.
Development plan
Since our previous publication on biodiversity data, we have redeveloped this indicator to focus on the use of data within the NBN as a better match to the requirements of the monitoring framework for the Global Biodiversity Framework. Resources permitting, this indicator could be complemented by an assessment of the application of the FAIR data principles within the UK’s monitoring schemes. We are keen to hear from our users about these changes, as well as our published development plan, please email us.
Categories:
Published: