Genetic diversity of wild species
Last updated: 2025
Latest data available: 2025
Introduction
Effective population size (Ne) is a well-accepted metric for measuring the genetic diversity within populations of wild species. An Ne above 500 (usually equivalent to a census population size above 5,000) is widely viewed as sufficient to maintain genetic diversity within populations. This indicator brings together information on effective population sizes for a range of UK species, and aggregates this to a representative average value for the proportion of populations exceeding an effective population size of 500.
Data for this indicator comes from a range of sources and expert elicitation, as convened and supported by SEFARI (Scottish Environment, Food and Agriculture Research Institutes), Royal Botanic Garden Edinburgh, NatureScot, University of Edinburgh, and Royal Botanic Gardens Kew.
This indicator has been published as part of the UK’s response to the Convention on Biological Diversity’s Kunming-Montreal Global Biodiversity Framework (GBF). This is the headline indicator for GBF Goal A: protect and restore; and Target 4: halt species extinction, protect genetic diversity, and manage human-wildlife conflicts.
Data for this indicator can be found in the published datafile.
Type of indicator
State indicator.
Type of official statistics
Official statistic in development. Further development of this indicator is planned, with the intention to fill data gaps and include a broader selection of species in future versions of the indicator. The UK biodiversity indicators project team would welcome feedback on the methods used in the development of this indicator; please email us. For more information, please visit the UK Statistics Authority’s website on Types of official statistics – UK Statistics Authority.
Assessment of change
This is an official statistic in development and there are currently insufficient data points available for any assessments.
Key results
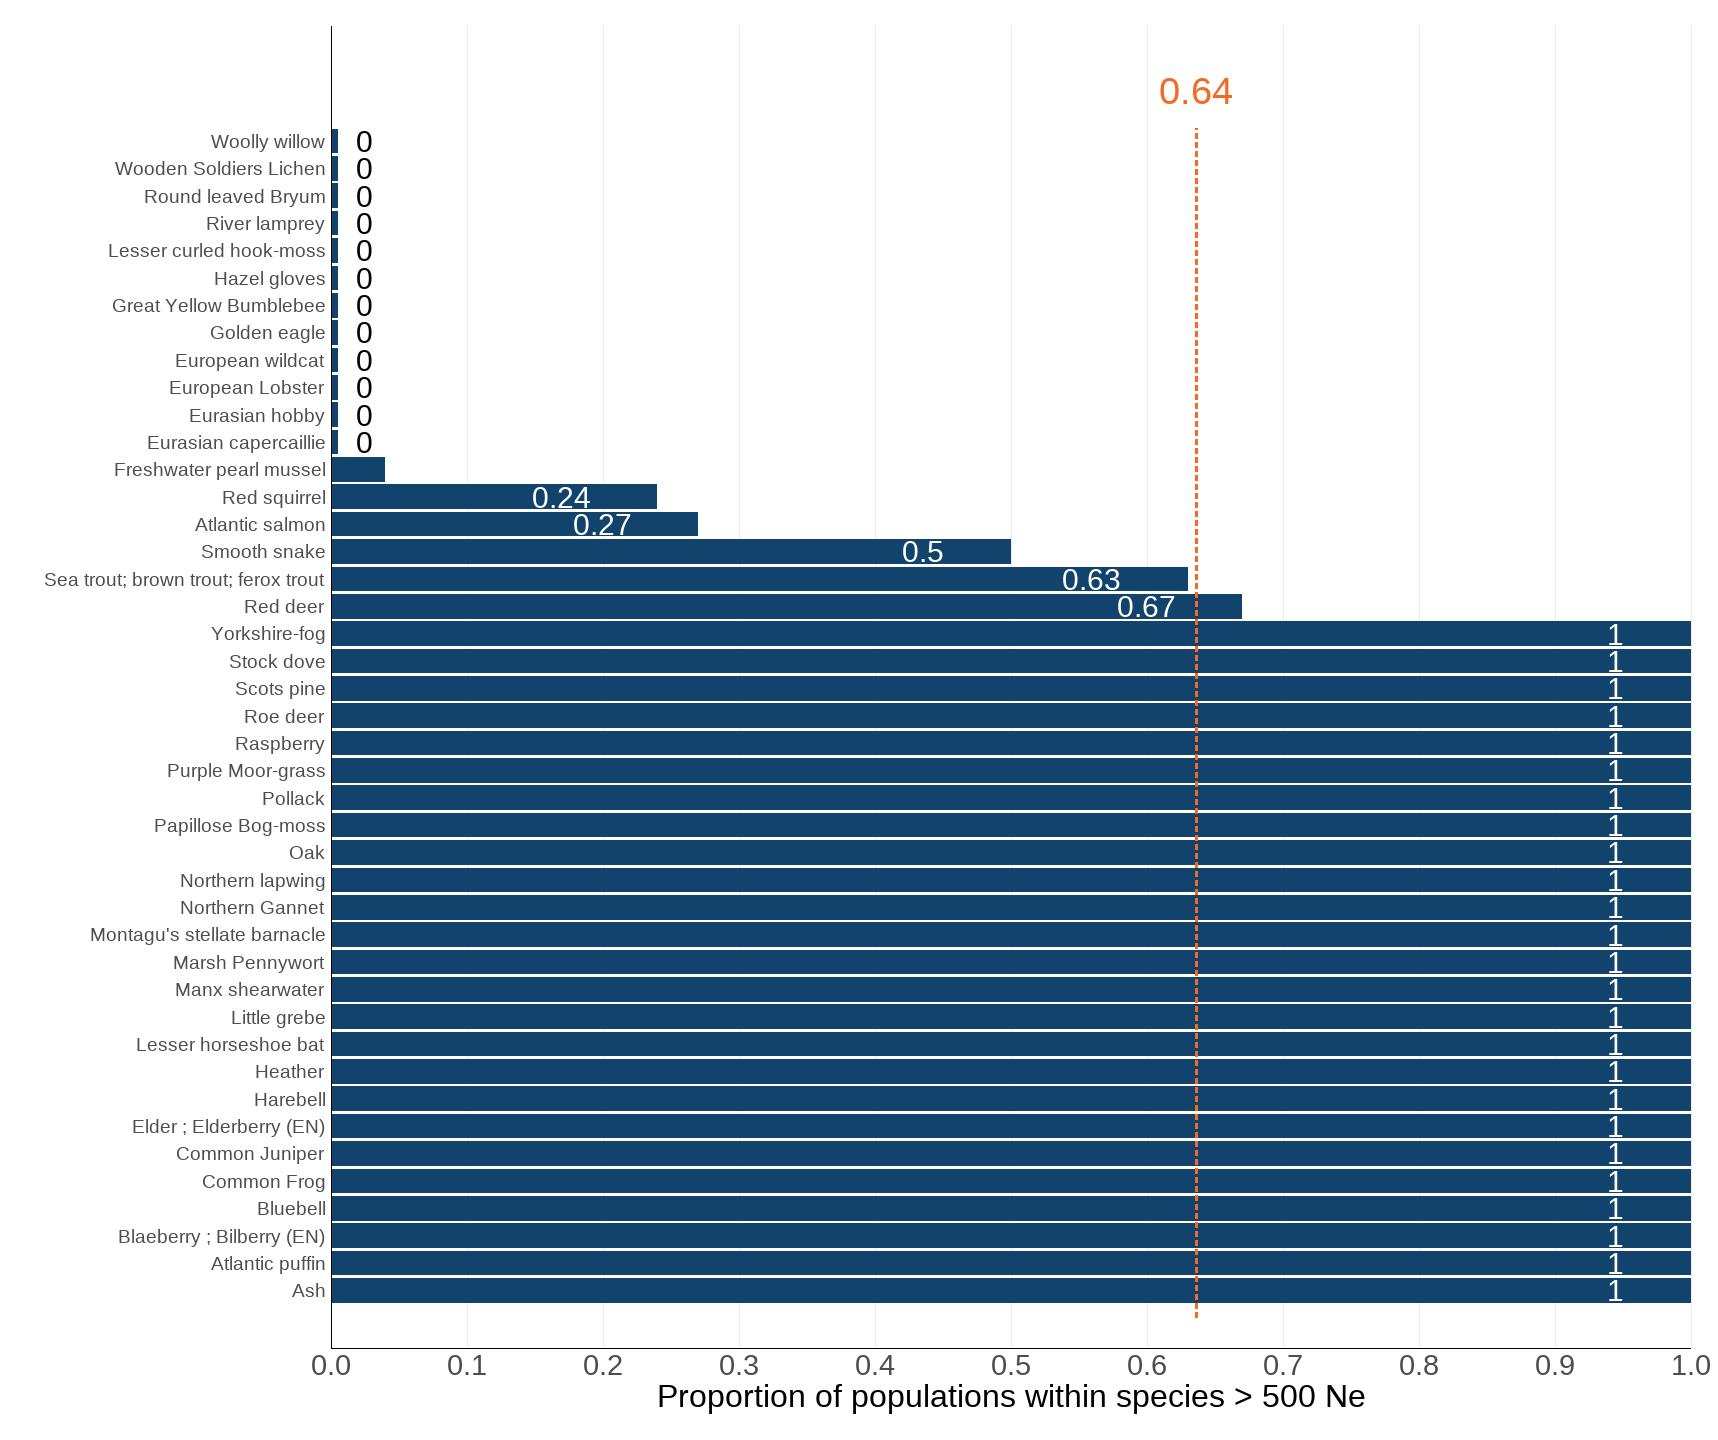
There are 43 UK species assessed within this indicator. An average proportion of 0.64 (or 64%) of their populations have an effective population size above the important threshold of Ne = 500 (Figure 1 and Figure 2). This suggests that, for the species assessed, over half of their populations meet the minimum size considered necessary for maintaining genetic diversity.
Figure 1: Assessing genetic viability: Species-level proportion of populations above Ne 500
Source: Genetics indicator working group (see Acknowledgements)
Notes about Figure 1
- This figure presents the total proportion of populations within the included species (see Technical Annex) which have greater than 500 individuals.
- This data is aggregated by species, and then a final average taken across all species assessed for this indicator, indicated by the vertical orange line and label.
- Some species have an Ne of 0 and are indicated by very short bars at the top of this figure; similarly other species have an Ne of 1 and are indicated by full width bars.
- The Y axis for this figure represents individual species; see Table 1 for further species details.
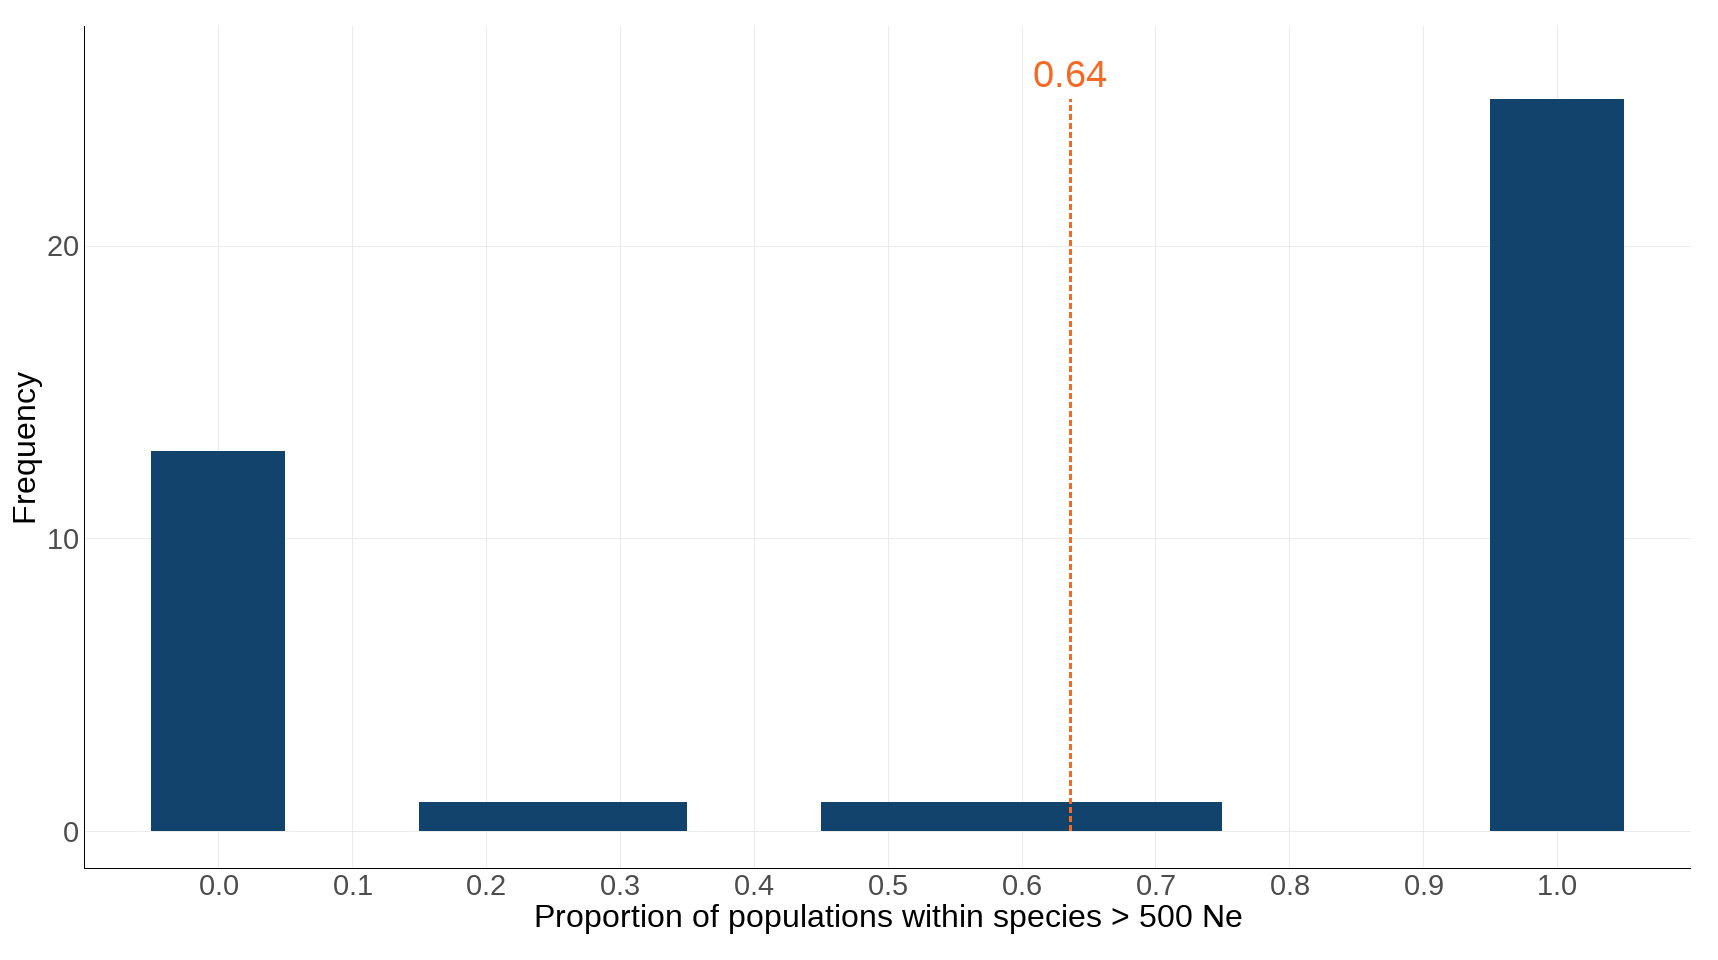
Figure 2: The frequency of species with proportions of populations above Ne 500
Source: Genetics indicator working group (see Acknowledgements)
Notes about Figure 2
- This figure shows the frequency of species with specified proportions of populations that have an Ne greater than 500.
- The final average taken across all species assessed for this indicator is indicated by the vertical orange bar and label.
Further detail
There is ongoing debate and discussion about the definition of Ne, but in summary it is generally viewed as indicating the rate of loss of genetic diversity due to random processes. The effective population size is the genetic complement of the population’s census size. How Ne relates to census population size (Nc) will depend on what is being surveyed as part of a census.
The value for Ne is typically much smaller than for Nc, which is usually the number of adult individuals in a given area. However, if only breeding individuals are being surveyed then Nc would be expected to be closer to Ne. Where all adult individuals are being surveyed for, a rule of thumb fraction of 10% is used to calculate an estimate of Ne from the Nc value; however, specific fractions may be used for some species based on existing knowledge. Overall we have taken a conservative approach where Ne:Nc ratios are unknown, in line with current research (Hoban et al, 2020).
The selection of species included in this indicator was arrived at through a systematic process, using a range of criteria (see Technical annex for more information on the methods). The collation of data for this suite of species was achieved through expert elicitation, including focused workshops, and through drawing on many published and unpublished sources of information (see Technical annex).
The overall UK indicator value was produced by first calculating the Ne per population across all of the species included, then by calculating the proportion of populations per species with Ne greater than 500, and then by averaging these species-level proportions across the suite of species included. More detail is provided in the Technical annex.
Relevance
Genetic diversity is necessary for species’ populations to remain healthy and adapt to environmental change, such as climate change, pollution, changing habitats, and pests and disease. Genetic diversity is also vital for resilience of all ecosystems, such as recovery from heat waves and ocean pollution or acidification. It is important for the success of ecosystem restoration and the reintroduction of populations and species. Populations with low genetic diversity suffer inbreeding, low viability, and low resilience. Habitat loss, fragmentation, overharvesting, and other human activities can all lead to declines in genetic diversity. Therefore, an Ne indicator is necessary to measure the conservation and sustainable use of genetic diversity.
International/domestic reporting
The suite of UK Biodiversity Indicators has been revised and updated to bring it in line with the Kunming-Montreal Global Biodiversity Framework (GBF) of the Convention on Biological Diversity (CBD). Some UK Biodiversity Indicators will be used for the forthcoming UK national reports to CBD.
This indicator relates to GBF Goal A: protect and restore; and Target 4: halt species extinction, protect genetic diversity, and manage human-wildlife conflicts.
Web links for further information
Acknowledgements
Thank you to the many people who have contributed by providing data and to the many colleagues who have helped produce this indicator. Species assessments for this indicator were produced by a working group consisting of the organisations below alongside many other volunteers. In particular, JNCC would like to thank:
- SEFARI
- Royal Botanic Garden Edinburgh, particularly Pete Hollingsworth and Nattanon Meeprom
- NatureScot, particularly David O’Brien and Eunice Pinn
- University of Edinburgh, particularly Rob Ogden
- Royal Botanic Gardens Kew, particularly Alicia Mastretta-Yanes
- GENOA (Genetic Nature Observation and Action), particularly Isa-Rita Russo
- All participants in data collection and species assessments: Stephen Cavers, Emily Humble, Colin Bean, Jenni Stockan, Linda Neaves, Anthony Wetherhill, Catherine Jones, Leslie Noble, Stuart Piertney, Alex Thomson, Alex Ball, Abigail Sikes, Les Noble, Rebecca Yar, Max Coleman, Victoria Pritchard, Martin Stervander, Emma Smith, Kat O’Brien, Roberta Gargiulo, and Hayley Waller
Technical annex
Methodology
Available resources offering guidance on the production of this indicator, such as that published by the IUCN, suggest a wide range of potential criteria for species inclusion, including a broad range of taxonomic groups, ecosystem services, coverage across the 4 UK countries, representative national habitats, and a country-specific list of relevant criteria. A list of these criteria was created as follows:
- A range of taxonomic groups were included, covering all vertebrate orders, two invertebrate orders, flowering and non-flowering plants, and fungi. While not a formal taxonomic group, ‘Algae’ is a useful classification of species and is recommended for inclusion in future assessments. A taxonomic group level summary of results is in Table 2.
- Species from the 4 UK countries were included to ensure full representation; although in practice each country is represented by many species on the list.
- To ensure inclusion from all representative UK ecosystem types, Global Ecosystem Typology (GET) biomes were included as a criterion for species selection. Basing these criteria on GET ensures alignment across the Global Biodiversity Framework indicators, and it was decided to use GET level 2 biomes as GET level 3 would result in too many categories. Six GET level 2 biomes were excluded due to being of limited relevance to this indicator.
- The remaining criteria are largely as noted on pages 17 and 18 of the IUCN guidance on species selection for genetic indicators, with the exception of ‘Broad taxonomic spread’ as this is covered by the approach above. Included are a set of criteria based on urgent conservation and management issues, and another set more specific to the individual focus of the reporting country.
Subsequently, a total of 43 species were selected as collectively they represent the full range of criteria described above. The individual species were selected using a range of criteria:
- Royal Botanical Garden Edinburgh, NatureScot and the University of Edinburgh have developed Genetic Scorecards for assessing the genetic health of a broad indicative selection of Scottish species, and this work was expanded during 2025 to include an assessment of Nc and Ne for these species across the UK. Where possible, these species were re-assessed and included in this indicator; each species was assigned a line according to their relevance to the above criteria.
- For taxonomic groups not represented by a Genetic Scorecard, species were selected at random from an NBN Atlas species list for that group.
- For the 4 country criterion, only 2 countries remained as England and Scotland were already represented. For Northern Ireland, a random species was chosen (following the process outlined above) from the Northern Ireland Priority Species List; and for Wales a random species was chosen from the Section 7 species list for Wales.
- For the remaining GET level 2 biomes not represented, species lists were sourced from existing indicators such as Birds of the Wider Countryside, or JNCC biotype species lists. These lists were then randomised as above. In a small number of cases additional checks were carried out to ensure the species was suitable for the given criteria. If the species was not suitable, the list was randomised again and a new species chosen.
- Finally, species were selected to fulfil the ‘other’ criteria. In some cases, species lists were available for randomising (e.g. species for which tissue samples are available), but in other cases this approach was not possible and so a more subjective approach was required; for example the selection of red deer from the Genetic Scorecard list to meet the ‘populations subject to harvesting’ criteria.
For some species, higher and lower population bounds but no point estimates existed, and so an average of these was taken to create the Ne value. Due to limitations in data availability, some species initially selected following the above process were unable to be assessed; some species had no census details available, while for others a total species census was available but there were insufficient data to reliably apply a population structure and therefore the size of individual populations could not be assessed. However data were available for some additional species which were considered suitable for inclusion, to ensure a more robust sample size of species and taxa for the indicator. A full list of species included is in Table 1.
Expert elicitation was used to assess each species, to create estimates of the number of populations within the UK, and the size of each population. For each species, populations were defined using one of the following methods:
- Geographic boundaries
- Dispersal buffers
- Ecological or biogeographic proxies
- Traits, including behavioural (e.g. different breeding grounds), morphological, and physiological
- Genetic clusters or clades
- Evolutionarily Significant Units (ESUs)
- Management units
This process created estimates of Nc (census size) for each population within a species (Table 1), and therefore each was divided by 10, or a specific ratio where known, to create Ne, the effective population size. These data were then aggregated to calculate the overall indicator metric and taxonomic aggregations as above (Table 2). The overall value calculated was 0.64 (± 0.46).
Table 1: The proportion of populations within species with an effective population size greater than 500
| Name | Species | Populations at or below 500 | Populations above 500 | Total populations | Proportion above 500 |
|---|---|---|---|---|---|
| Eurasian capercaillie | Tetrao urogallus | 1 | 0 | 1 | 0.00 |
| Eurasian hobby | Falco subbuteo | 1 | 0 | 1 | 0.00 |
| European Lobster | Homarus gammarus | 1 | 0 | 1 | 0.00 |
| European wildcat | Felis silvestris | 1 | 0 | 1 | 0.00 |
| Golden eagle | Aquila chrysaetos | 1 | 0 | 1 | 0.00 |
| Great Yellow Bumblebee | Bombus distinguendus | 5 | 0 | 5 | 0.00 |
| Hazel gloves | Hypocreopsis rhododendri | 1 | 0 | 1 | 0.00 |
| Lesser curled hook-moss | Palustriella decipiens | 1 | 0 | 1 | 0.00 |
| River lamprey | Lampetra fluviatilis | 2 | 0 | 2 | 0.00 |
| Round leaved Bryum | Bryum cyclophyllum | 1 | 0 | 1 | 0.00 |
| Wooden Soldiers Lichen | Cladonia botrytes | 1 | 0 | 1 | 0.00 |
| Woolly willow | Salix lanata | 16 | 0 | 16 | 0.00 |
| Freshwater pearl mussel | Margaritifera margaritifera | 134 | 6 | 140 | 0.04 |
| Red squirrel | Sciurus vulgaris | 13 | 4 | 17 | 0.24 |
| Atlantic salmon / Atlantic salmon in chalk streams | Salmo salar | 141 | 53 | 194 | 0.27 |
| Smooth snake | Coronella austriaca | 1 | 1 | 2 | 0.50 |
| Sea trout; brown trout; ferox trout | Salmo trutta | 36 | 61 | 97 | 0.63 |
| Red deer | Cervus elaphus | 1 | 2 | 3 | 0.67 |
| Ash | Fraxinus excelsior | 0 | 5 | 5 | 1.00 |
| Atlantic puffin | Fratercula arctica | 0 | 1 | 1 | 1.00 |
| Blaeberry ; Bilberry | Vaccinium myrtillus | 0 | 5 | 5 | 1.00 |
| Bluebell | Hyacinthoides non-scripta | 0 | 5 | 5 | 1.00 |
| Common Frog | Rana temporaria | 0 | 5 | 5 | 1.00 |
| Common Juniper | Juniperus communis | 0 | 5 | 5 | 1.00 |
| Elder ; Elderberry | Sambucus nigra | 0 | 5 | 5 | 1.00 |
| Harebell | Campanula rotundifolia | 0 | 5 | 5 | 1.00 |
| Heather | Calluna vulgaris | 0 | 5 | 5 | 1.00 |
| Lesser horseshoe bat | Rhinolophus hipposideros | 0 | 1 | 1 | 1.00 |
| Little grebe | Tachybaptus ruficollis | 0 | 1 | 1 | 1.00 |
| Manx shearwater | Puffinus puffinus | 0 | 1 | 1 | 1.00 |
| Marsh Pennywort | Hydrocotyle vulgaris | 0 | 5 | 5 | 1.00 |
| Montagu’s stellate barnacle | Chthamalus montagui | 0 | 1 | 1 | 1.00 |
| Northern Gannet | Morus bassanus | 0 | 1 | 1 | 1.00 |
| Northern lapwing | Vanellus vanellus | 0 | 1 | 1 | 1.00 |
| Oak | Quercus robur / petraea | 0 | 5 | 5 | 1.00 |
| Papillose Bog-moss | Sphagnum papillosum | 0 | 5 | 5 | 1.00 |
| Pollack | Pollachius pollachius | 0 | 1 | 1 | 1.00 |
| Purple Moor-grass | Molinia caerulea | 0 | 5 | 5 | 1.00 |
| Raspberry | Rubus idaeus | 0 | 5 | 5 | 1.00 |
| Roe deer | Capreolus capreolus | 0 | 1 | 1 | 1.00 |
| Scots pine | Pinus sylvestris | 0 | 5 | 5 | 1.00 |
| Stock dove | Columba oenas | 0 | 1 | 1 | 1.00 |
| Yorkshire-fog | Holcus lanatus | 0 | 5 | 5 | 1.00 |
Source: Genetics indicator working group (see Acknowledgements)
Notes about Table 1
- Only populations with census data available have been included in these calculations.
- Some species in this table are associated with a Scottish Scorecard.
Table 2: The proportion of populations within taxa with an effective population size greater than 500
| Taxonomic group | Total populations | Populations above 500 | Populations at or below 500 | Proportion above 500 |
|---|---|---|---|---|
| Amphibian | 5 | 5 | 0 | 1.00 |
| Angiosperm | 55 | 55 | 0 | 1.00 |
| Arthropod | 1 | 1 | 0 | 1.00 |
| Bird | 8 | 6 | 2 | 0.75 |
| Bryophyte | 6 | 5 | 1 | 0.83 |
| Fish | 268 | 115 | 153 | 0.43 |
| Fungus | 1 | 0 | 1 | 0.00 |
| Gymnosperm | 10 | 10 | 0 | 1.00 |
| Mammal | 22 | 8 | 14 | 0.36 |
| Mollusc | 17 | 6 | 11 | 0.35 |
| Reptile | 2 | 1 | 1 | 0.50 |
Source: Genetics indicator working group (see Acknowledgements)
Notes about Table 2
- This table summarises populations by taxonomic group.
Caveats and limitations
Due to limitations in data availability, Ne has been assessed for 43 species. While every effort has been made to ensure that these species are broadly representative of UK biodiversity, the indicator would benefit from the inclusion of a wider range of taxa. It is planned that future iterations of this indicator will be expanded to include new species as well as repeat assessments of the species already included.
Development plan
This is a new indicator. We plan to further develop the indicator during the coming years. We would like to include more species and a wider range of taxa in future iterations of the indicator.
We are keen to hear from our users about these intended changes, the language and visualisations used in this indicator, as well as our published development plan for the biodiversity indicators: please email us.
References
-
Hoban, S., Bruford, M., D’Urban Jackson, J., Lopes-Fernandes, M., Heuertz, M., Hohenlohe, P. A., Paz-Vinas, I., Sjögren-Gulve, P., Segelbacher, G., Vernesi, C., Aitken, S., Bertola, L. D., Bloomer, P., Breed, M., Rodríguez-Correa, H., Funk, W. C., Grueber, C. E., Hunter, M. E., Jaffe, R., Liggins, L., Mergeay, J., Moharrek, F., O’Brien, D., Ogden, R., Palma-Silva, C., Pierson, J., Ramakrishnan, U., Simo-Droissart, M., Tani, N., Waits, L. and Laikre, L. (2020) Genetic diversity targets and indicators in the CBD post-2020 Global Biodiversity Framework must be improved. Biological Conservation 248: https://doi.org/10.1016/j.biocon.2020.108654.
-
Laikre, L., Leus, K., O´Brien, D., Shaw, R. and Sork, V. (2022) Selecting species and populations for monitoring of genetic diversity. Gland, Switzerland: IUCN.
-
Mastretta-Yanes, A., Suárez, s., Jordan, R., Hoban, S., da Silva, J. M., Castillo-Reina, L., Heuertz, M., Ishihama, F., Köppä, V., Laikre, L., Mergeay, J., Paz-Vinas, I., Segelbacher, G., Knapps, A., Rakoczy, H., Weiler, A. and Forester, B. R. (2024) Guideline materials and documentation for the Genetic Diversity Indicators. DOI: https://zenodo.org/doi/10.5281/zenodo.10976424
Categories:
Published: