Green and blue space in built-up areas
Last updated: 2025
Latest data available: 2021
Introduction
This indicator presents the average proportion of blue and accessible green spaces within urban areas within Great Britain, based on data from the Office for National Statistics (ONS) Urban Natural Capital accounts.
This indicator relates to the Global Biodiversity Framework Target 12: Enhance green spaces and urban planning for human well-being and biodiversity. This target seeks to significantly increase the area, quality, connectivity of, access to, and benefits from green and blue spaces in urban and densely populated areas. The data presented here demonstrates a baseline of urban green and blue space and will inform policies of government and local authorities. The methodology follows that of the Office for National Statistics (ONS) Urban Natural Capital accounts, which were published in similar forms in 2019 and 2023. These accounts contain calculations of the extent of urban areas and the green and blue spaces they contain, across Great Britain (excluding Northern Ireland, where data is currently unavailable).
This indicator is being developed as part of the UK’s response to the Kunming-Montreal Global Biodiversity Framework (GBF) of the Convention on Biological Diversity (CBD). This is the headline indicator for Target 12, Enhance Green Spaces and Urban Planning for Human Well-Being and Biodiversity.
Data for this indicator can be found in the published datafile.
Type of indicator
Benefit indicator
Type of official statistics
Official statistic in development. This first iteration of the indicator is reported as part of the UK’s commitment to the Convention on Biological Diversity and the Global Biodiversity Framework. Comments and feedback on the methods chosen are welcome, please email us. For more information, please visit the UK Statistics Authority’s website on types of official statistics – UK Statistics Authority.
Contents
Assessment of change
There are currently insufficient data points available for this indicator to carry out an assessment of change.
Key results
The overall proportion of urban areas across Great Britain allocated to accessible green spaces is 4.3% while blue space account for 1.2%, making a total of 5.5% of urban areas allocated to these spaces (Figure 1). England has the highest proportion of green and blue space, while Scotland and Wales both have smaller proportions. Due to a significant change in methodology, we are unable to assess any change over time for this indicator, but the data presented here for 2021 is intended to form the first data point in a new time series. However, as these data are slow to change, estimates may not be annual.
Figure 1: From parks to ponds - visualising urban spaces in Great Britain in 2021
The proportion of the urban areas across Great Britain which is publicly accessible green and blue space.
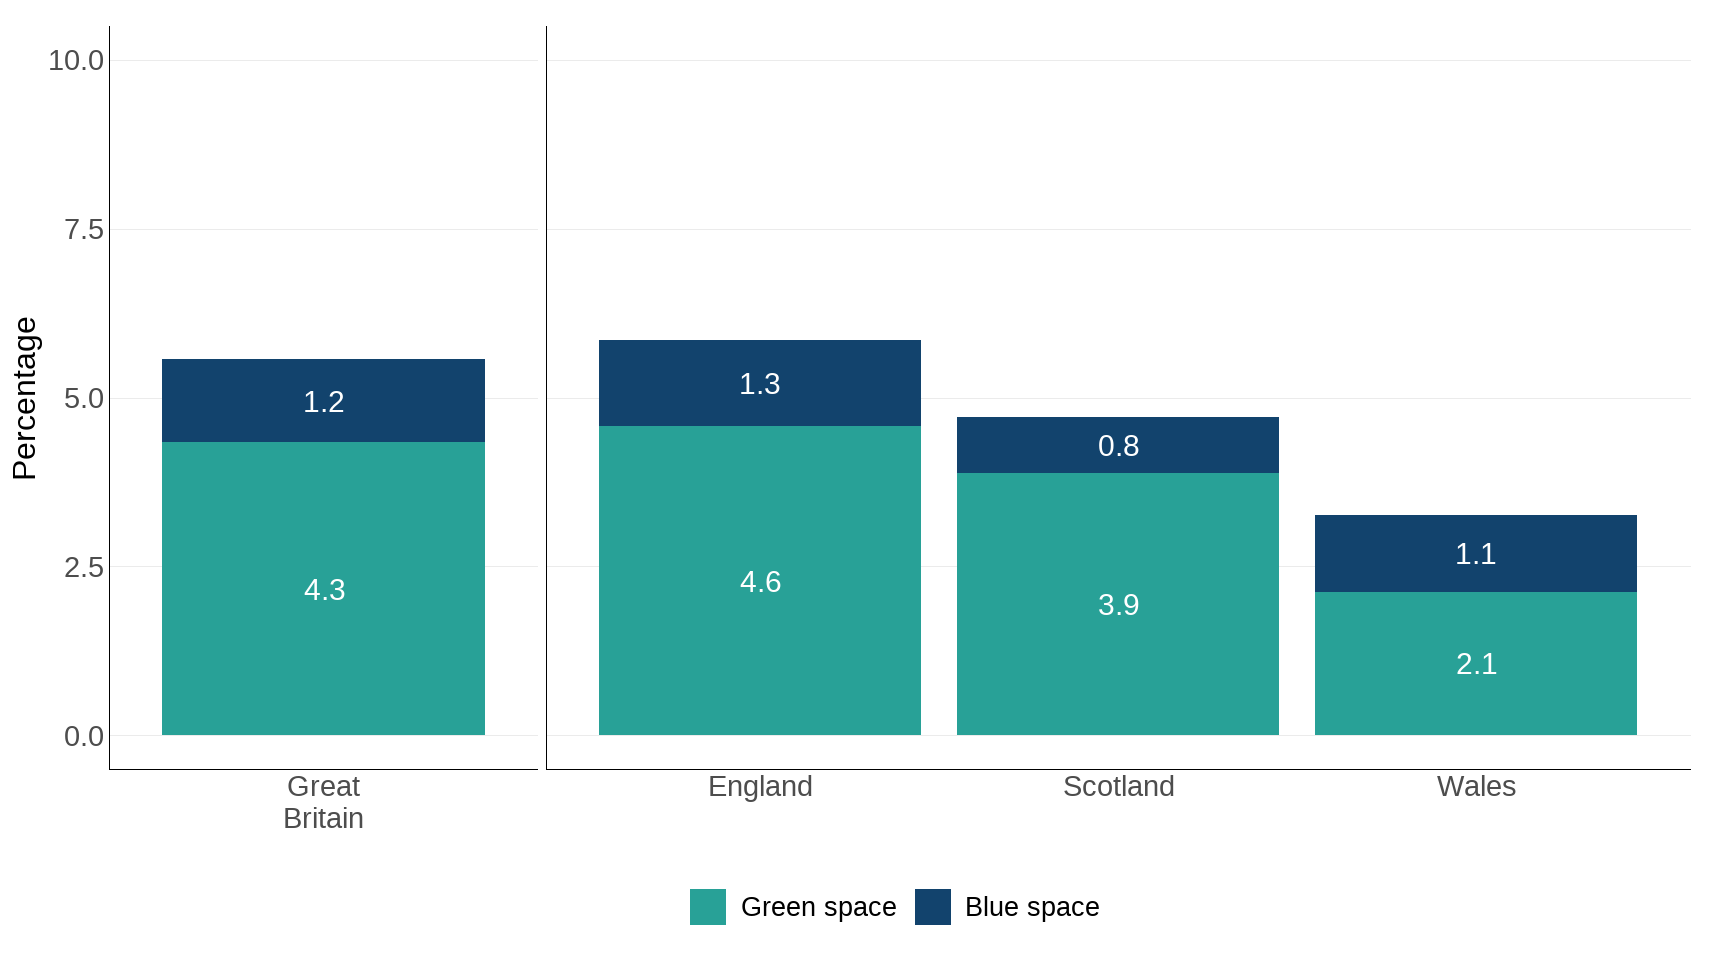
Source: Office for National Statistics
Notes about Figure 1
- The left panel in this figure summarises green and blue space as the proportion of the total urban area of Great Britain.
- The right panel disaggregates the data into England, Scotland and Wales and expresses the proportion of green and blue space as a proportion of each country’s urban area.
- Data for Northern Ireland is currently unavailable.
- See Further Detail for definitions of green and blue space.
Table 1: Summary of accessible green and blue space (hectares)
| Total extent | Blue space | Green space | Total urban extent |
|---|---|---|---|
| Great Britain | 23,559 | 83,369 | 1,920,541 |
| England | 20,471 | 72,895 | 1,593,595 |
| Scotland | 1,656 | 7,777 | 200,201 |
| Wales | 1,432 | 2,698 | 126,745 |
Source: Office for National Statistics
Notes about Table 1
- This table presents the total area in hectares of green and blue space.
- The data has been converted to percent of total urban extent for Figure 1.
Table 2: Areas of publicly accessible green space (hectares)
| Publicly accessible green space | Public parks and gardens | Playing fields | Cemeteries | Religious grounds |
|---|---|---|---|---|
| Great Britain | 46,665 | 25,678 | 6,896 | 4,130 |
| England | 41,198 | 22,292 | 5,972 | 3,433 |
| Scotland | 4,387 | 2,212 | 686 | 492 |
| Wales | 1,080 | 1,174 | 239 | 205 |
Source: Office for National Statistics
Notes about Table 2
- This table presents a breakdown of the categories of accessible green space included in this indicator.
Further detail
Definitions follow those adopted by the Office for National Statistics Urban Natural Capital indicators, which can be summarised as follows.
- Urban and suburban areas are included in the urban habitat total; these consist of built structures and other infrastructure. Urban habitat extent is calculated following the Office for National Statistics methodology and uses data from the Ordnance Survey Greenspace Layer.
- Blue spaces include all inland water bodies such as rivers, lakes, ponds and canals. It is not possible to determine the accessibility of these spaces, but their benefits to humans and biodiversity may not relate to their accessibility in the same way as for green space.
- Publicly accessible green space (‘green space’) is a subset of all green space, with those with restricted access (such as golf courses and even some nature reserves) removed. Categories of green space which remain include public parks and gardens, playing fields, and cemeteries and religious grounds. These spaces contain natural land cover and can also include blue space (e.g. lakes or ponds) within them; these areas are subtracted from the area of green space around them.
This indicator is in addition to the existing Access to Nature in England statistics, which focus on the distance between households and green and blue space. The percentage of households within walking distance to green and blue spaces is an alternative method of assessing the benefits offered by nature and biodiversity.
Relevance
In recent years policy makers, leaders, citizens and urban developers have increasingly recognised the value of public green and blue spaces, though historically these areas were often overlooked in urban planning due to lack of resources, limited appreciation of their value, and appropriate enabling frameworks. Low political will and insufficient public engagement have also contributed to their exclusion.
The United Nation’s Sustainable Development Goals (SDGs) introduced global monitoring of public spaces with SDG indicator 11.7.1 measuring land allocation and population access by age, gender and disability. The Global Biodiversity Framework builds on this with Target 12, aiming to enhance green spaces and urban planning for human well-being and biodiversity. The proportion of land dedicated to streets and open public spaces is vital for productivity, social cohesion and public health. Well-designed, connected public spaces foster walking, social interaction, and urban quality of life.
International/domestic reporting
The suite of UK Biodiversity Indicators has been revised and updated to bring it in line with the Kunming-Montreal Global Biodiversity Framework (GBF) of the Convention on Biological Diversity (CBD). Some UKBIs will be used for the forthcoming UK national reports to CBD.
This is the headline indicator for Target 12, Enhance Green Spaces and Urban Planning for Human Well-Being and Biodiversity.
Web links for further information
Acknowledgements
Thank you to the many people who have contributed by providing data and to the many colleagues who have helped produce this indicator. In particular, thanks to colleagues in the Office for National Statistics for data, definitions and explanations.
Technical annex
Methodology
Data outlining the total urban area of Great Britain, and breakdowns of this into blue and accessible green spaces were used to generate this indicator. The headline value is the sum of these green and blue spaces within each year expressed as a proportion of the overall GB urban habitat areas for those years. Also presented is the background data used to calculate these proportions.
Data for this indicator were provided by the Office for National Statistics and form part of their Urban natural capital account indicator for 2021. Details can be found at the Natural Capital methodology guide. The ONS have a similar Natural Capital indicator for 2019 which also estimates urban extent and green and blue space, but definitions and methodology changed significantly between these two publications, and as such it is not possible to directly compare them.
Definitions follow the broad classifications from the 2011 UK National Ecosystem Assessment to categorise habitats. The mapping data for these habitats are from the UK Centre for Ecology and Hydrology’s (UKCEH) Land Cover Maps.
Green spaces were defined following definitions in the Ordnance Survey’s Greenspace technical specification and includes:
- Public parks and gardens
- Play spaces
- Golf courses
- Sports areas and playing fields
- Churchyards or burial grounds
- Allotments or community growing spaces
- Bowling greens
- Tennis courts
The final value for this indicator was calculated by summing accessible green spaces and blue spaces, and expressing this as a percentage of the total urban habitat extent.
Table 3: Areas of functional (non-publicly accessible) green and blue space (hectares)
| Non publicly accessible functional green space | Golf courses | Allotments and community growing spaces | Bowling greens | Other sports facilities e g cricket grounds |
|---|---|---|---|---|
| Great Britain | 17,476 | 7,234 | 497 | 12,988 |
| England | 15,355 | 6,831 | 258 | 11,171 |
| Scotland | 1,899 | 145 | 217 | 1,297 |
| Wales | 222 | 258 | 22 | 520 |
Source: Office for National Statistics
Notes about Table 3
- This table is presented for information; these spaces are not accessible and are therefore not included in the headline calculations for this indicator.
Caveats and limitations
Urban Natural Capital accounts are unavailable for Northern Ireland and so this indicator is presented for Great Britain only; in the future, when they become available, these data for Northern Ireland will be included.
The information used for this indicator comes from two sources; the total urban habitat extent from the Urban Natural Capital Accounts, and the areas of green and blue space from the Ordnance Survey Greenspace layer. Despite coming from separate datasets, they can be combined to give a representation of total urban habitat and the relationship between them and green and blue spaces.
Development plan
This is a new indicator developed as part of the UK’s response to the Kunming-Montreal Global Biodiversity Framework (GBF). Future iterations of this indicator will continue to consider the definitions and data approaches used, and we hope to expand coverage of this indicator to the whole of the UK. We are keen to hear from our users about these changes, as well as our published development plan; please email us.
Categories:
Published: