Value of subsidies and other incentives harmful to biodiversity
Last updated: 2025
Latest data available: 2022
Introduction
Globally, many governments provide incentives or subsidies to mitigate market imbalances, account for externalities, or change the behaviour of the public or businesses. This indicator presents the value of the UK’s incentives, including subsidies, that are potentially harmful to the environment. The indicator is based, in this publication, on the UK’s subsidies reported to the World Trade Organisation (WTO) and, for fisheries, to the Organisation for Economic Co-operation and Development. There is currently a data gap between the intention of this indicator and the data available, for instance it is not possible at present to include comprehensive data on incentives. This will be addressed in future publications of the indicator.
The indicator has been developed by screening available subsidy data to determine if each subsidy can be regarded as ‘environmentally harmful’. An overview of the screening process is provided in the technical annex. Not all subsidies are harmful, and the indicator also presents the total value of subsidies screened as positive to provide context. Data are presented at the UK level.
This indicator is being published as part of the UK’s response to the Convention on Biological Diversity’s Kunming-Montreal Global Biodiversity Framework (GBF). This indicator relates to GBF Goal D and Target 18. We are keen to hear from our users about how this indicator is used, as well as about our published development plan.
Data for this indicator can be found in the published datafile.
Type of indicator
Pressure indicator
Type of official statistics
Official statistic in development. This first iteration of the indicator is reported as part of the UK’s commitment to the Convention on Biological Diversity (CBD) and the Global Biodiversity Framework (GBF). Comments and feedback on the methods chosen are welcome. For more information, please visit the UK Statistics Authority’s website on types of official statistics – UK Statistics Authority.
Assessment of change
As this is an official statistic in development it has not been assessed.
Key results
Subsidies screened as potentially harmful to environmental objectives (Figure 1) totalled £5.1 million in 2017 (in 2022 prices) and £21.5 million in 2022. The 2022 figure is a decrease from the peak of £40.2 million in 2020.
The rise in the figures in 2020 and 2021 is likely to be related to a number of factors, including COVID-19 related support payments and changes in schemes supporting disruption as a result of leaving the European Union.
Figure 1: Total value of subsidies screened as harmful to environmental objectives, 2017 to 2022
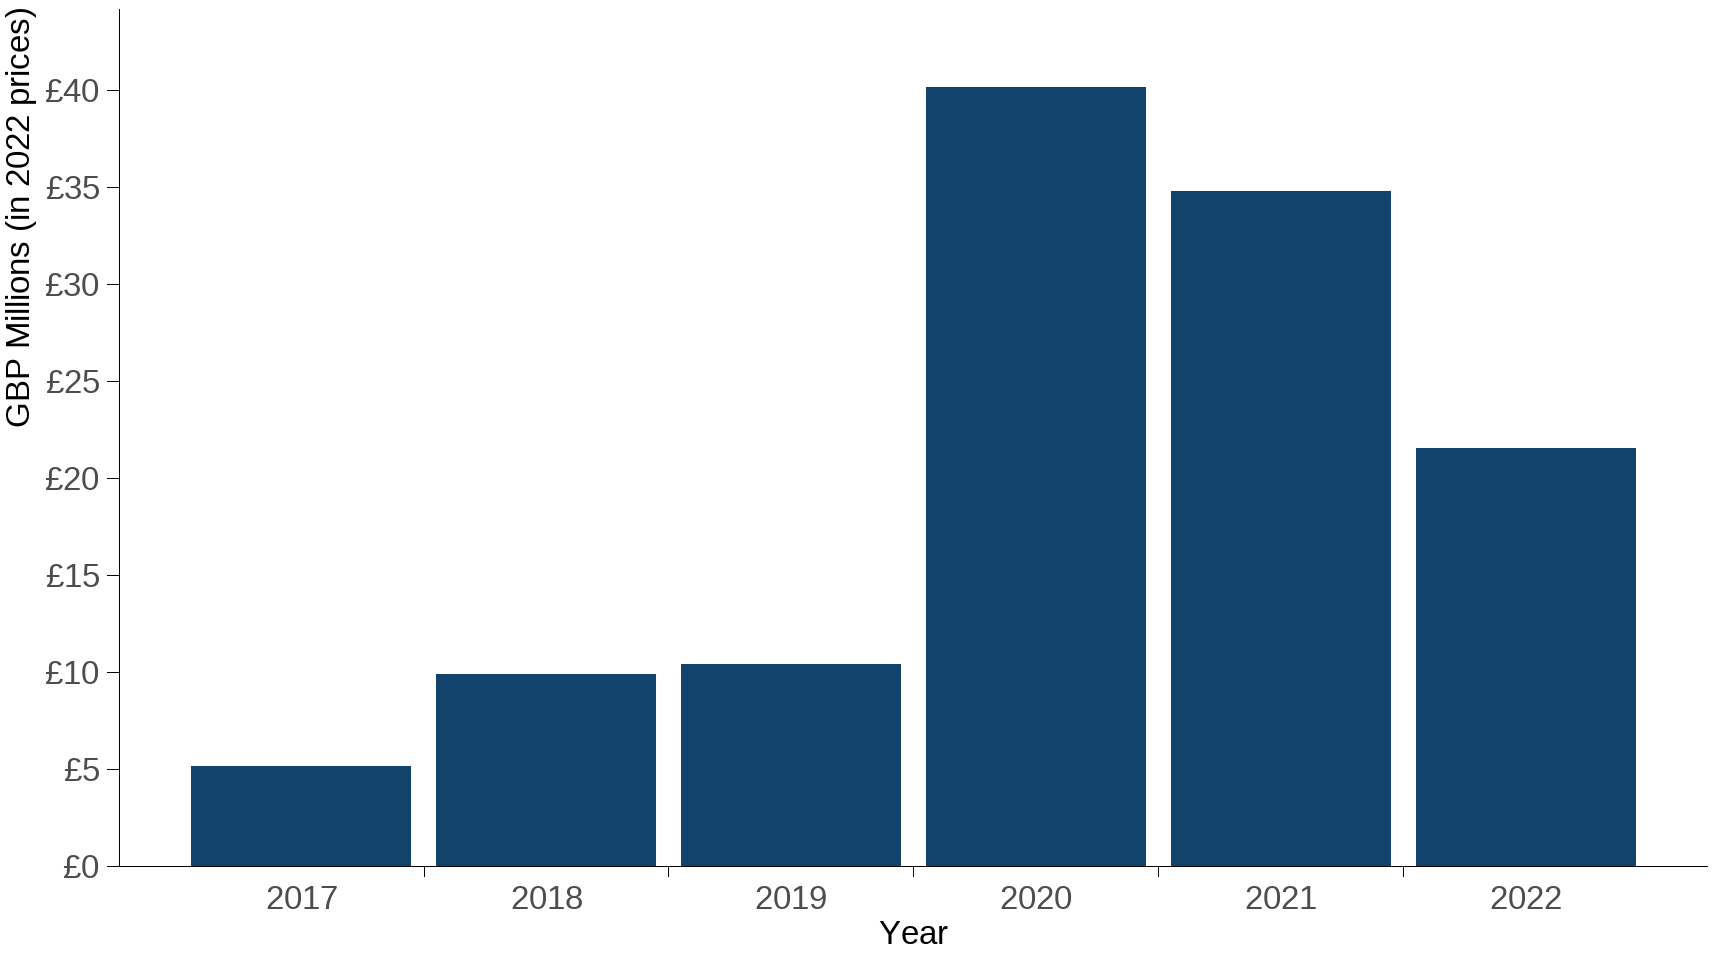
Source: Collated by JNCC and Defra through a screening process undertaken by UK Government
Notes about Figure 1
- Data based on reports to the World Trade Organisation, and, for fisheries, to the Organisation for Economic Co-operation and Development.
- Data are adjusted for the effects of inflation using the UK Gross Domestic Product (GDP) deflator for 2022. Data presented here will not be directly comparable to those in subsequent publications because a new deflator is used to prepare each update.
- Details of the screening process undertaken is provided in the Technical annex.
- The screening process took account of a range of environmental objectives, which directly or indirectly interact with the UK’s biodiversity. The data should not be interpreted as only reporting on subsidies which harm biodiversity directly as the majority of the subsidies in the WTO reports interact with multiple environment related objectives.
Further detail
Figure 2 is provided to put Figure 1 into context. The amount of environmentally harmful subsidies is small in the context of positive subsidies provided. Subsidies screened as positive to environmental objectives (Figure 2) totalled £186.9 million in 2017 (in 2022 prices) and £5.1 billion in 2022. The 2022 figure is a decrease from the peak of £7.4 billion in 2020.
Figure 2: Total value of subsidies screened as positive to environmental objectives 2017 to 2022
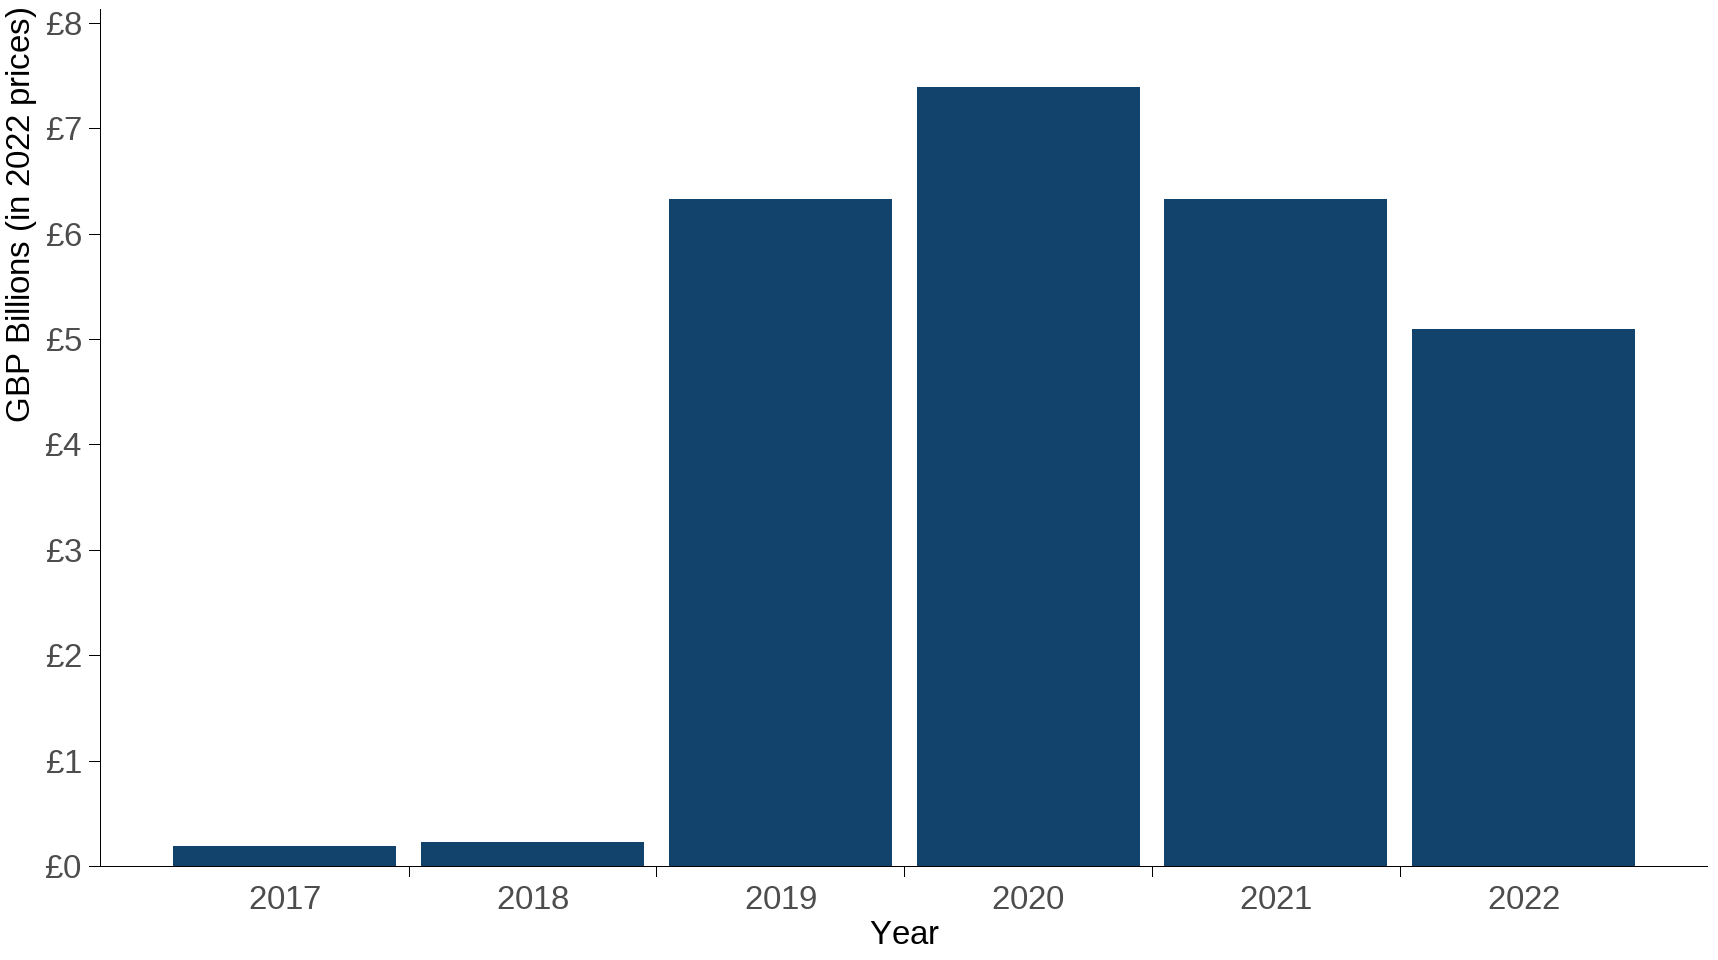
Source: Collated by JNCC and Defra through a screening process undertaken by UK Government
Notes about Figure 2
- Data based on reports to the World Trade Organisation, and, for fisheries, to the Organisation for Economic Co-operation and Development.
- Data are adjusted for the effects of inflation using the UK Gross Domestic Product (GDP) deflator for 2022. Data presented here will not be directly comparable to those in subsequent publications because a new deflator is used to prepare each update.
- Details of the screening process undertaken is provided in the Technical annex.
- The screening process took account of a range of environmental objectives, which directly or indirectly affect biodiversity. The data should not be interpreted as only reporting on subsidies which are positive to biodiversity directly as the majority of the subsidies in the WTO reports interact with multiple environment related objectives.
Table 1 provides the data graphed in Figures 1 and 2. Table 2 provides the same data in percentage form, showing that the majority of the subsidies screened were considered to be positive or have no environmental impact. The ‘Uncertain’ column relates to subsidies where further information would be needed to determine if they are positive, neutral or negative. Further consideration will be needed for these, but it is likely that for subsidies earlier on in the time series further elucidation will not be possible as they are mostly legacy schemes rather than those now active. The figures in Table 1 have been rounded to the nearest thousand pounds and adjusted for the effects of inflation using the UK Gross Domestic Product (GDP) deflator for 2022. Data presented here will not be directly comparable to those in subsequent publications because a new deflator is used to prepare each update.
Table 1: Total value of subsidies screened for harm to environmental objectives
| Year | Negative | No impact | Positive | Uncertain | Total |
|---|---|---|---|---|---|
| 2017 | £ 5,147,000 | £ 155,605,000 | £ 186,856,000 | £620,367,000 | £ 967,975,000 |
| 2018 | £ 9,887,000 | £ 49,482,000 | £ 227,230,000 | £667,875,000 | £ 954,474,000 |
| 2019 | £10,404,000 | £1,540,877,000 | £6,331,239,000 | £483,447,000 | £ 8,365,966,000 |
| 2020 | £40,174,000 | £2,346,707,000 | £7,392,400,000 | £574,422,000 | £10,353,703,000 |
| 2021 | £34,787,000 | £2,135,897,000 | £6,325,930,000 | £806,180,000 | £ 9,302,794,000 |
| 2022 | £21,528,000 | £2,275,041,000 | £5,096,656,000 | £624,552,000 | £ 8,017,777,000 |
Source: Collated by JNCC and Defra through a screening process undertaken by UK Government.
Table 2: Percentage of subsidies screened for harm to environmental objectives
| Year | Negative | No impact | Positive | Uncertain |
|---|---|---|---|---|
| 2017 | 0.5% | 16.1% | 19.3% | 64.1% |
| 2018 | 1% | 5.2% | 23.8% | 70% |
| 2019 | 0.1% | 18.4% | 75.7% | 5.8% |
| 2020 | 0.4% | 22.7% | 71.4% | 5.5% |
| 2021 | 0.4% | 23% | 68% | 8.7% |
| 2022 | 0.3% | 28.4% | 63.6% | 7.8% |
Source: Collated by JNCC and Defra through a screening process undertaken by UK Government.
The UK collates and reports data on its subsidies to the WTO for the purposes of the Agreement on Subsidies and Countervailing Measures on a biennial basis.
To determine which subsidies might be considered environmentally harmful, the UK Government agreed a process and criteria for screening the subsidies in the WTO reports. The Technical annex provides detail of the screening process. The fisheries part of this indicator is based on a different dataset and a variation in the screening methodology, where theoretical risk of unsustainable fishing was used to help determine their environmental impact (see Technical annex for further detail).
The results of the screening exercise should be considered within the context of the following points.
-
There are some exclusions in this reporting, and for the purposes of Target 18 of the CBD, some data gaps.
-
Exclusions include those subsidies not in scope of the WTO agreement and support measures that do not require notification under the WTO agreement. Despite these gaps, it is the UK’s best and most comprehensive controlled compilation of data available and is already public information.
-
This indicator does not take a view on what counts as an ‘environmentally harmful incentive’, or indeed what is considered as an ‘incentive’.
-
The UK is a member of the Coalition on Phasing Out Fossil Fuel Incentives Including Subsidies (COFFIS). As part of the UK’s commitments within COFFIS, the UK will be publishing an inventory of fossil fuel incentives. It was not possible to take this work into account in this iteration of the indicator due to timing.
-
The methodology is in development and the results presented are interim. Further work is needed to define the full scope of the indicator.
Relevance
Halting the loss of biodiversity requires that policies across government are aligned and aim to minimise the environmental damage that might be caused. Globally, many government departments provide subsidies or incentives to mitigate market imbalances, account for externalities, or change the behaviour of the public or businesses. Article 11 of the Convention on Biological Diversity states: “Each Contracting Party shall, as far as possible and as appropriate, adopt economically and socially sound measures that act as incentives for the conservation and sustainable use of components of biological diversity”. Adoption of the GBF means new consideration is needed to identify and balance the benefits and harms that subsidies and incentives may cause, and to phase out or reform the most environmentally harmful subsidies and incentives.
Target 18 of the GBF commits countries to identify (by 2025) and collectively reform, phase out or eliminate USD $500 billion of incentives harmful to biodiversity by 2030, complementing commitments made in other international fora. Through the Sustainable Development Goals (SDGs) countries have committed to phasing out inefficient fossil fuel subsidies and restructuring taxation to reflect environmental impacts; as well as eliminate subsidies that contribute to overfishing and illegal fishing. Within the UNFCCC at COP28 countries agreed to phase out inefficient fossil fuel subsidies. WTO members have various commitments relating to subsidies and trade, with the Fisheries Agreement prohibiting subsidies that contribute to illegal, unreported and unregulated fishing and overfishing. Finally, the Group of Seven (G7) and Group of Twenty (G20) countries have reaffirmed many of these commitments.
International/domestic reporting
The UK Biodiversity Indicators have been reviewed in response to the latest goals and targets agreed under the GBF of the Convention on Biological Diversity. The indicators have been adapted, with some new indicators being developed, to better align them with the monitoring framework for the GBF. The suite of biodiversity indicators has therefore changed ready for forthcoming UK national reports to CBD in 2026 and 2029.
This is headline indicator 18.2 of the monitoring framework for the GBF, relevant to GBF Target 18: Reduce Harmful Incentives by at Least $500 Billion per Year, and Scale Up Positive Incentives for Biodiversity.
Web links for further information
- GBF Target 18
- Indicator 18.2 metadata
- CBD Technical Series number 56 on incentive measures
- WTO Agreement on Subsidies and Countervailing Measures
- WTO reports
- OECD Fisheries Support Estimates database
- COFFIS
Acknowledgements
Thank you to the many people who have contributed by providing data and to the many colleagues who have helped produce this indicator, particularly the members of the UK Government working group on Target 18 of the GBF who provided direction and guidance for the development of the indicator, and colleagues who undertook the screening process.
Technical annex
Background
There is no universally agreed definition of what counts as an environmentally harmful incentive, and many agencies and organisations on the international stage refer to incentives and subsidies interchangeably. The CBD refers to harmful or perverse incentives to biodiversity as “economic, legal and institutional incentives that emanate from policies or practices that induce unsustainable behaviour that destroys biodiversity, often as unanticipated side-effects of policies designed to attain other objectives”. The Organisation for Economic Co-operation and Development (OECD) defines environmentally harmful subsidies as “all kinds of financial support and regulations that are put into place to enhance the competitiveness of certain products, processes or regions, and that, together with the prevailing taxation regime, (unintentionally) discriminate against sound environmental practices”.
Globally, incentives are broadly understood to include all types of government support (e.g. policy measures or financial mechanisms), whilst subsidies relate to measures specifically providing an economic benefit, but the application of this is determined nationally by individual States.
The UK does not currently fully collate data on government incentives across its sectors, and any existing data on incentives or subsidies does not include any consideration of environmental impact. Therefore, to develop this indicator the UK has had to rely on existing data sets of subsidies, and screen the subsidies for environmental harm.
The UK currently collates and reports data on its subsidies to the WTO for the purposes of the Agreement on Subsidies and Countervailing Measures on a biennial basis. There are some exclusions in this reporting, and for the purposes of Target 18 of the CBD, some data gaps. Exclusions include those subsidies not in scope of the WTO agreement and support measures that do not require notification under the WTO agreement. Despite these gaps, it is the UK’s best and most comprehensive controlled compilation of data and is already public information. This dataset has been utilised for the first iteration of the indicator.
Due to data limitations, the UK is not at this time taking a view as to what counts as an “environmentally harmful incentive” or indeed what is considered an “incentive” but has determined what is environmentally harmful in the UK context.
The subsidy by subsidy data within the WTO reports varies between calendar year and financial year data, with some data as actual spend and some as budgets. Where possible data recorded as actual spend was used, but where budgets had been provided without the means to calculate actual spend the budgets were divided equally across the years the scheme was operational. Because of the mix of data, financial year data has been allocated to the first calendar year of the financial year – so, for example, 2019/20 data would be allocated to 2019, and 2020/2021 data to 2020.
The dataset also includes a few legacy schemes from the European Union, including the Common Agricultural Policy - European Agricultural Fund for Rural Development (EAFRD), and the Common Agricultural Policy - European Agricultural Guarantee Fund (EAGF). Figures for these schemes were partially reported in Euros and have been converted to GBP using exchange rates from the World Bank for the year of the subsidy.
Data are adjusted for the effects of inflation using the UK Gross Domestic Product (GDP) deflator for 2022. Data presented here will not be directly comparable to those in subsequent publications because a new deflator is used to prepare each update.
Screening process
To determine which subsidies might be considered environmentally harmful, UK Government agreed a process and criteria for screening the subsidies in the WTO reports.
The type of support/subsidy (e.g. direct payments, grants, price or income support, tax exemptions) would not necessarily determine if the impact is harmful to the environment, nor will the monetary size of a particular scheme in a year. The potential or actual outcome must be considered instead. Generally, schemes where the outcome is aimed at under-pricing the use of natural resources (leading to overconsumption), or increasing production (leading to increased polluting inputs, damaging production methods, or an unsustainable transformation of ecosystems) would be considered as having higher potential to cause direct environmental harm. Schemes where these outcomes are an unintended consequence, or potential unintended consequence, of the original aim must also be considered as indirect environmental harm. The screening process therefore considers the potential or actual outcome, both direct and indirect, on the environment, of each of the schemes within the data set.
To determine environmental harm, the UK explored seven key environmental objectives. These are based upon existing EU methodology for identifying environmentally harmful subsidies, as well as objectives from the 25 Year Environment Plan and Environmental Improvement Plan. For each identified objective, examples of harmful impacts were described to help with the screening. Table 3 shows the identified objectives alongside their impacts.
Table 3: Environmental objectives and possible harmful impacts used in the screening process
| Environmental Objective | Environmentally Harmful Impact |
|---|---|
| Climate change mitigation | Leads to significant greenhouse gas emissions and/or lowers the potential for an ecosystem to sequester carbon. |
| Climate change adaptation | Leads to an increased adverse impact of the current climate and the expected future climate, including on people, nature or assets. |
| Sustainable use and protection of water and marine resources | Detrimental to: i) the good ecological status bodies of freshwater, including surface water and groundwater; or ii) Detrimental to the good environmental status of marine waters; or iii) Detrimental to the status of biological resources, through unsustainable harvesting of fish stocks, or damage to the environment from fishing methods. |
| Sustainable use and protection of land and terrestrial resources | Detrimental to: i) the overall quality or status of land and landscapes; or ii) the sustainability of biological resources, such as agricultural soil and timber and wood products. |
| Transition to a circular economy | Leads to: i) significant inefficiencies in the use of materials or in the direct or indirect use of natural resources such as non-renewable energy sources, raw materials, water and land at one or more stages of the life cycle of products, including in terms of durability, reparability, upgradability, reusability or recyclability of products; or ii) a significant increase in the generation, incineration or disposal of waste, with the exception of the incineration of non-recyclable hazardous waste; or iii) the long-term disposal of waste which may cause significant and long-term harm to the environment. |
| Pollution prevention and control | Leads to a significant increase in the emissions of pollutants into air, water or land. |
| Protection and restoration of biodiversity and ecosystems | Detrimental to: i) the good condition and resilience of marine, freshwater or terrestrial ecosystems; or ii) the conservation status, extent, quality or connectivity of habitats or diversity, distribution or abundance of species. |
Environmentally harmful schemes are those that have the potential to cause significant harm to the environment. This assessment was carried out on a case-by-case basis, taking account of the context in which the subsidy scheme is operated. The screening process is not meant to capture schemes that lead to minimal negative impacts on the environment, or those where potential environmental harm has been sufficiently mitigated against.
When conducting the screening, consideration was therefore given to the following:
-
Direct and indirect effects, as well as competing objectives and conflicting impacts on the environment. It is possible that schemes will have a mix of positive and negative impacts on the environment depending on their design. Those incentives with a mix of positive and negative impacts on the environment were screened as negative in the first instance and screened out if effective regulation or mitigation measures are in place.
-
The policy and regulatory context, including the Subsidy Control Act 2022, Environmental Principles Policy Statement, and any additional sector specific policies and obligations. Other policies or regulations may mitigate the negative environmental impacts of a scheme. Policy sector leads/teams were given flexibility to utilise their contextual knowledge and best available guidance to determine environmental impact, applying the precautionary approach where appropriate. Those undertaking the screening were requested to explain the approach taken and to provide best available evidence.
-
Sector specific context. Policy sector leads/teams were given flexibility to apply additional sector-specific criteria based on UK regulations if they exist, minimum sector requirements, and/or best available guidance/practice.
Fisheries sector
For this publication of the indicator, the fisheries sector utilised data collated to report to the OECD: The Fisheries Support Estimate (FSE) database. Data used were in USD, so were converted to GBP using the World Bank exchange rates for the year of the subsidy. The OECD has developed a matrix to classify types of fisheries support based on the level of risk they pose to lead to unsustainable fishing. The UK has utilised the theoretical risk framework as a basis to help inform the screening process undertaken for this indicator. The OECD advise that theoretical risk can be adjusted by taking into account mitigating factors within the policy context, such as effectiveness of management, stock health and policy design. For this iteration the UK has not taken context into account but may do for future iterations.
Development plan
This is a new indicator and this is its first publication. It focuses on the value of environmentally harmful subsidies for the reporting requirements of the monitoring framework for Target 18 of the GBF. Further work is needed to develop this indicator to fully report on environmentally harmful incentives by addressing data gaps and expanding its scope. It is intended to complete this work before the CBD 8th National Report (due in 2029).
We are keen to hear from our users about these changes, as well as our published development plan: please email us.
Categories:
Published: