Summary: assessment of change across all indicators
Contents
- Key messages
- Assessment methods
- Assessment of change: all measures
-
Assessment of change using a Natural Capital Framework
- Figure 2: Long-term and short-term indicator assessments by Natural Capital Framework Status, all measures, 2025
- Assessment of change in extent or condition (state) of natural capital assets
- Assessment of change in pressures on natural capital assets
- Assessment of change in the benefits associated with natural capital assets
- Assessment results tables
Key messages
Overall, more indicators are deteriorating or showing no change than improving, over both the long and short term (Figure 1).
- Over the long term, many indicators have shown improvement, reflecting sustained positive changes in some aspects of biodiversity. However, many have also deteriorated, reflecting ongoing pressures on ecosystems. A smaller group of indicators has remained broadly stable over time.
- No indicators which are deteriorating in the long term, are showing improvement in the short term, suggesting that we are yet to reverse the negative trend in many aspects of biodiversity. However, some have stopped deteriorating in the short term, suggesting that some long term negative trends have stabilised.
- Many indicators already showing improvement in the long term continue to improve in the short term. However, some progress has stalled or even deteriorated in the short term.
Figure 1: A summary of long-term and short-term indicator assessments, 2025
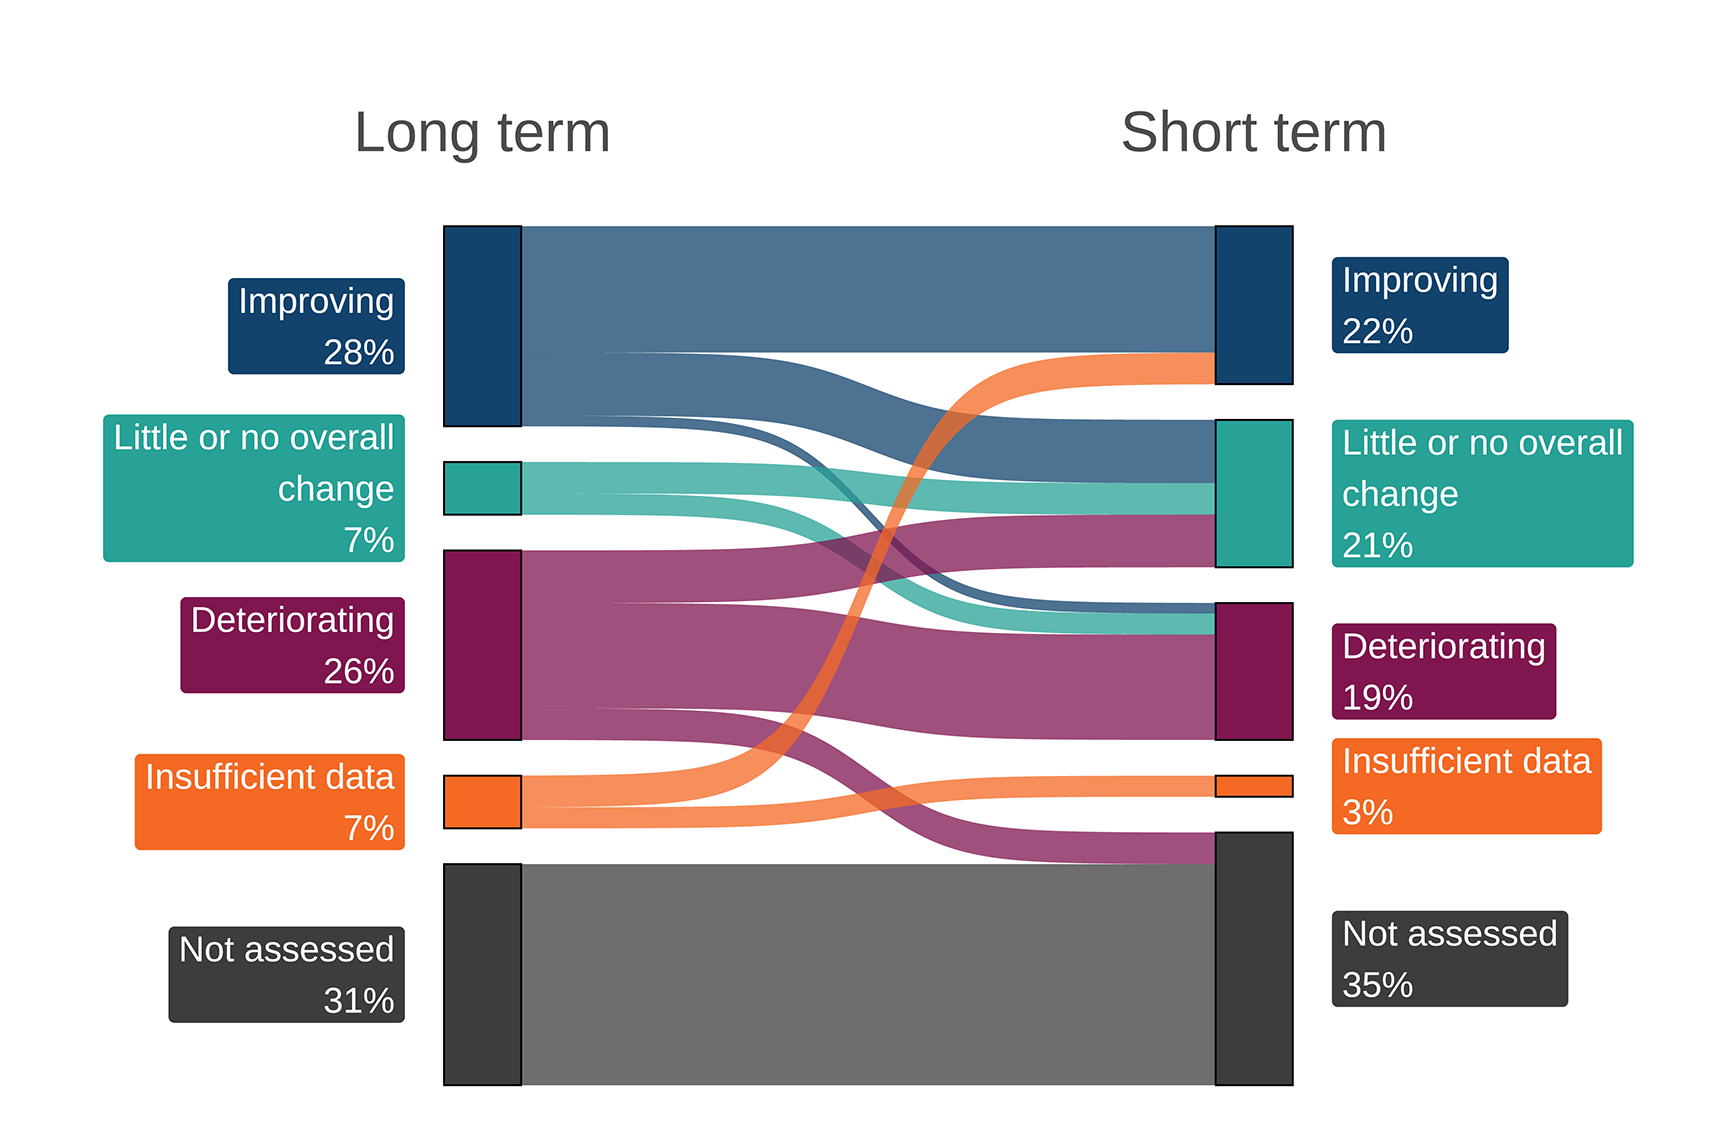
Notes about Figure 1
- Figure 1 shows how the assessment of indicators changes depending on the time frame assessed. Left hand bars represent the long term assessment results, while right hand bars represent the short term assessment results. The relationships between long term and short term results are highlighted in the shaded flows.
- Some indicators don’t have enough data to perform a long term (10 years of data) or a short term (5 years of data) assessment of change, and so are categorised as “insufficient data”. Others might still be in development or be otherwise inappropriate for an assessments of change and are classed as “not assessed”.
Assessment methods
Each indicator is composed of one or more measures which will show trends over time. Many indicators have only a single measure, but where it does not make sense to combine data, the indicator will have more than one measure. Each measure is summarised or assessed separately and grouped into one of four categories.
These categories communicate how the measures are changing over time. They do not show whether the measure has reached any published or implied targets, or indeed whether the status is ‘good’ or ‘bad’, although where targets have been set, these are identified in the indicator text.
The assessment categories are determined by identifying the period over which the change is to be assessed and comparing the value of the measure in the base or start year with the value in the end year. The four categories are:
- Improving
- Little or no overall change
- Deteriorating
- Insufficient or no comparable data
Where possible, the assessment has been made by evaluating trends using statistical analysis techniques. The assessment may be made by Defra statisticians in collaboration with the data providers, or undertaken by the data providers themselves.
An assessment result of ‘Improving’ or ‘Deteriorating’ is made only when there is sufficient confidence that the change is statistically significant and not simply a product of random fluctuations. When there is insufficient confidence that a change has taken place the ‘Little or no overall change’ assessment result is used.
For some indicators, it is not possible to formally determine statistical significance and in such cases the assessment has been made by comparing the difference between the value of the measure in the base or start year and the value in the end year against a ‘rule of thumb’ threshold. Where the data allow it, a 3-year average is used to calculate the starting value; this reduces the likelihood of any unusual years unduly influencing the assessment. Usually, the starting value is calculated from an average of the first three years of data for the long term assessment, or the three years centred around the beginning of the short term time period for the short term assessment. The standard threshold used is 3%, unless noted otherwise.
Where an indicator value has changed by less than the threshold of 3%, the ‘Little or no overall change’ assessment result is used. The choice of 3% as the threshold is arbitrary but is used across other government indicators and is deemed to be a suitable proxy for meaningful change. The use of this approach is kept under review.
Where there is insufficient data to make an assessment, for example, when the time series is too short, or where there is no data available to compare, this is indicated by the ‘Insufficient or no comparable data’ category. It is inappropriate to do an assessment of change on some indicators, for instance some are undergoing methodological development, such as Official Statistics in Development, and results are likely to change from year to year due to those developments. For others evolving data collection methods make comparisons over time inappropriate. These indicators are not assessed.
The assessment results only reflect the overall change in the measure from the starting value to latest year and do not reflect fluctuations during the intervening years.
Where sufficient data are available, 2 assessment periods have been used:
- Long term – an assessment of change since the earliest date for which data are available, although if the time series is less than 10 years a long-term assessment is not made.
- Short term – an assessment of change over the latest 5 years. In some indicators which are particularly variable 10 years of data are used.
For both long-term and short-term assessments, the years over which the assessment is undertaken are stated in the assessment table and/or accompanying notes.
Where the data allow, some indicators also have a third marker showing the direction of change in the latest year. This period is too short to make any meaningful assessment. However, when the change exceeds a 1% threshold, the direction is given simply as an acknowledgement of very recent trends and as a possible early indication of emerging trends. This is not done for indicators which are too variable from year to year or where it might otherwise be deemed statistically inappropriate.
Assessment of change: all measures
There are 68 individual measures that make up 39 indicators. Of those 68 measures, some are unsuitable for a formal assessment of change (for instance they may have insufficient data or are in development). In 2025, 42 are suitable for assessment.
In the long term:
- 19 measures (28%) show an improvement
- 5 measures (7%) show little or no overall change
- 18 measures (26%) show a deterioration
There are insufficient data to make long-term assessments for 5 measures (7%), and 21 measures (31%) are not assessed.
In the short term:
- 15 measures (22%) show an improvement
- 14 measures (21%) show little or no overall change
- 13 measures (19%) show a deterioration
There are insufficient data to make short-term assessments for 2 measures (3%), and 24 measures (35%) are not assessed.
Tables 1 to 4 at the bottom of this page show the assessment results of all the measures when separated into “pressure”, “state” and “benefit” categories of the Natural Capital Framework.
Assessment of change using a Natural Capital Framework
Natural capital is defined as the elements of the environment which provide valuable goods and services to people such as clean air, clean water, food, and recreation. A natural capital approach is advocated as it accounts for all the different ways the environment benefits society and so can inform better decision making. A natural capital framework sets out the need to:
- reduce pressures on natural capital (for example, pollution or plant disease)
- improve the state of natural assets (including air, water, land and seas)
- increase the benefits that we get from those assets
The Biodiversity Indicators can be considered as either a measure of (a) the extent or condition (i.e. state) of natural capital assets, (b) pressures on natural capital assets, or (c) the benefits associated with natural capital assets. This classification is not always straightforward since the condition of one natural capital asset (for example, water quality) may place a pressure on another (for example, wildlife habitat).
Figure 2 summarises the results for all measures across these categories.
Figure 2: Long-term and short-term indicator assessments by Natural Capital Framework Status, all measures, 2025
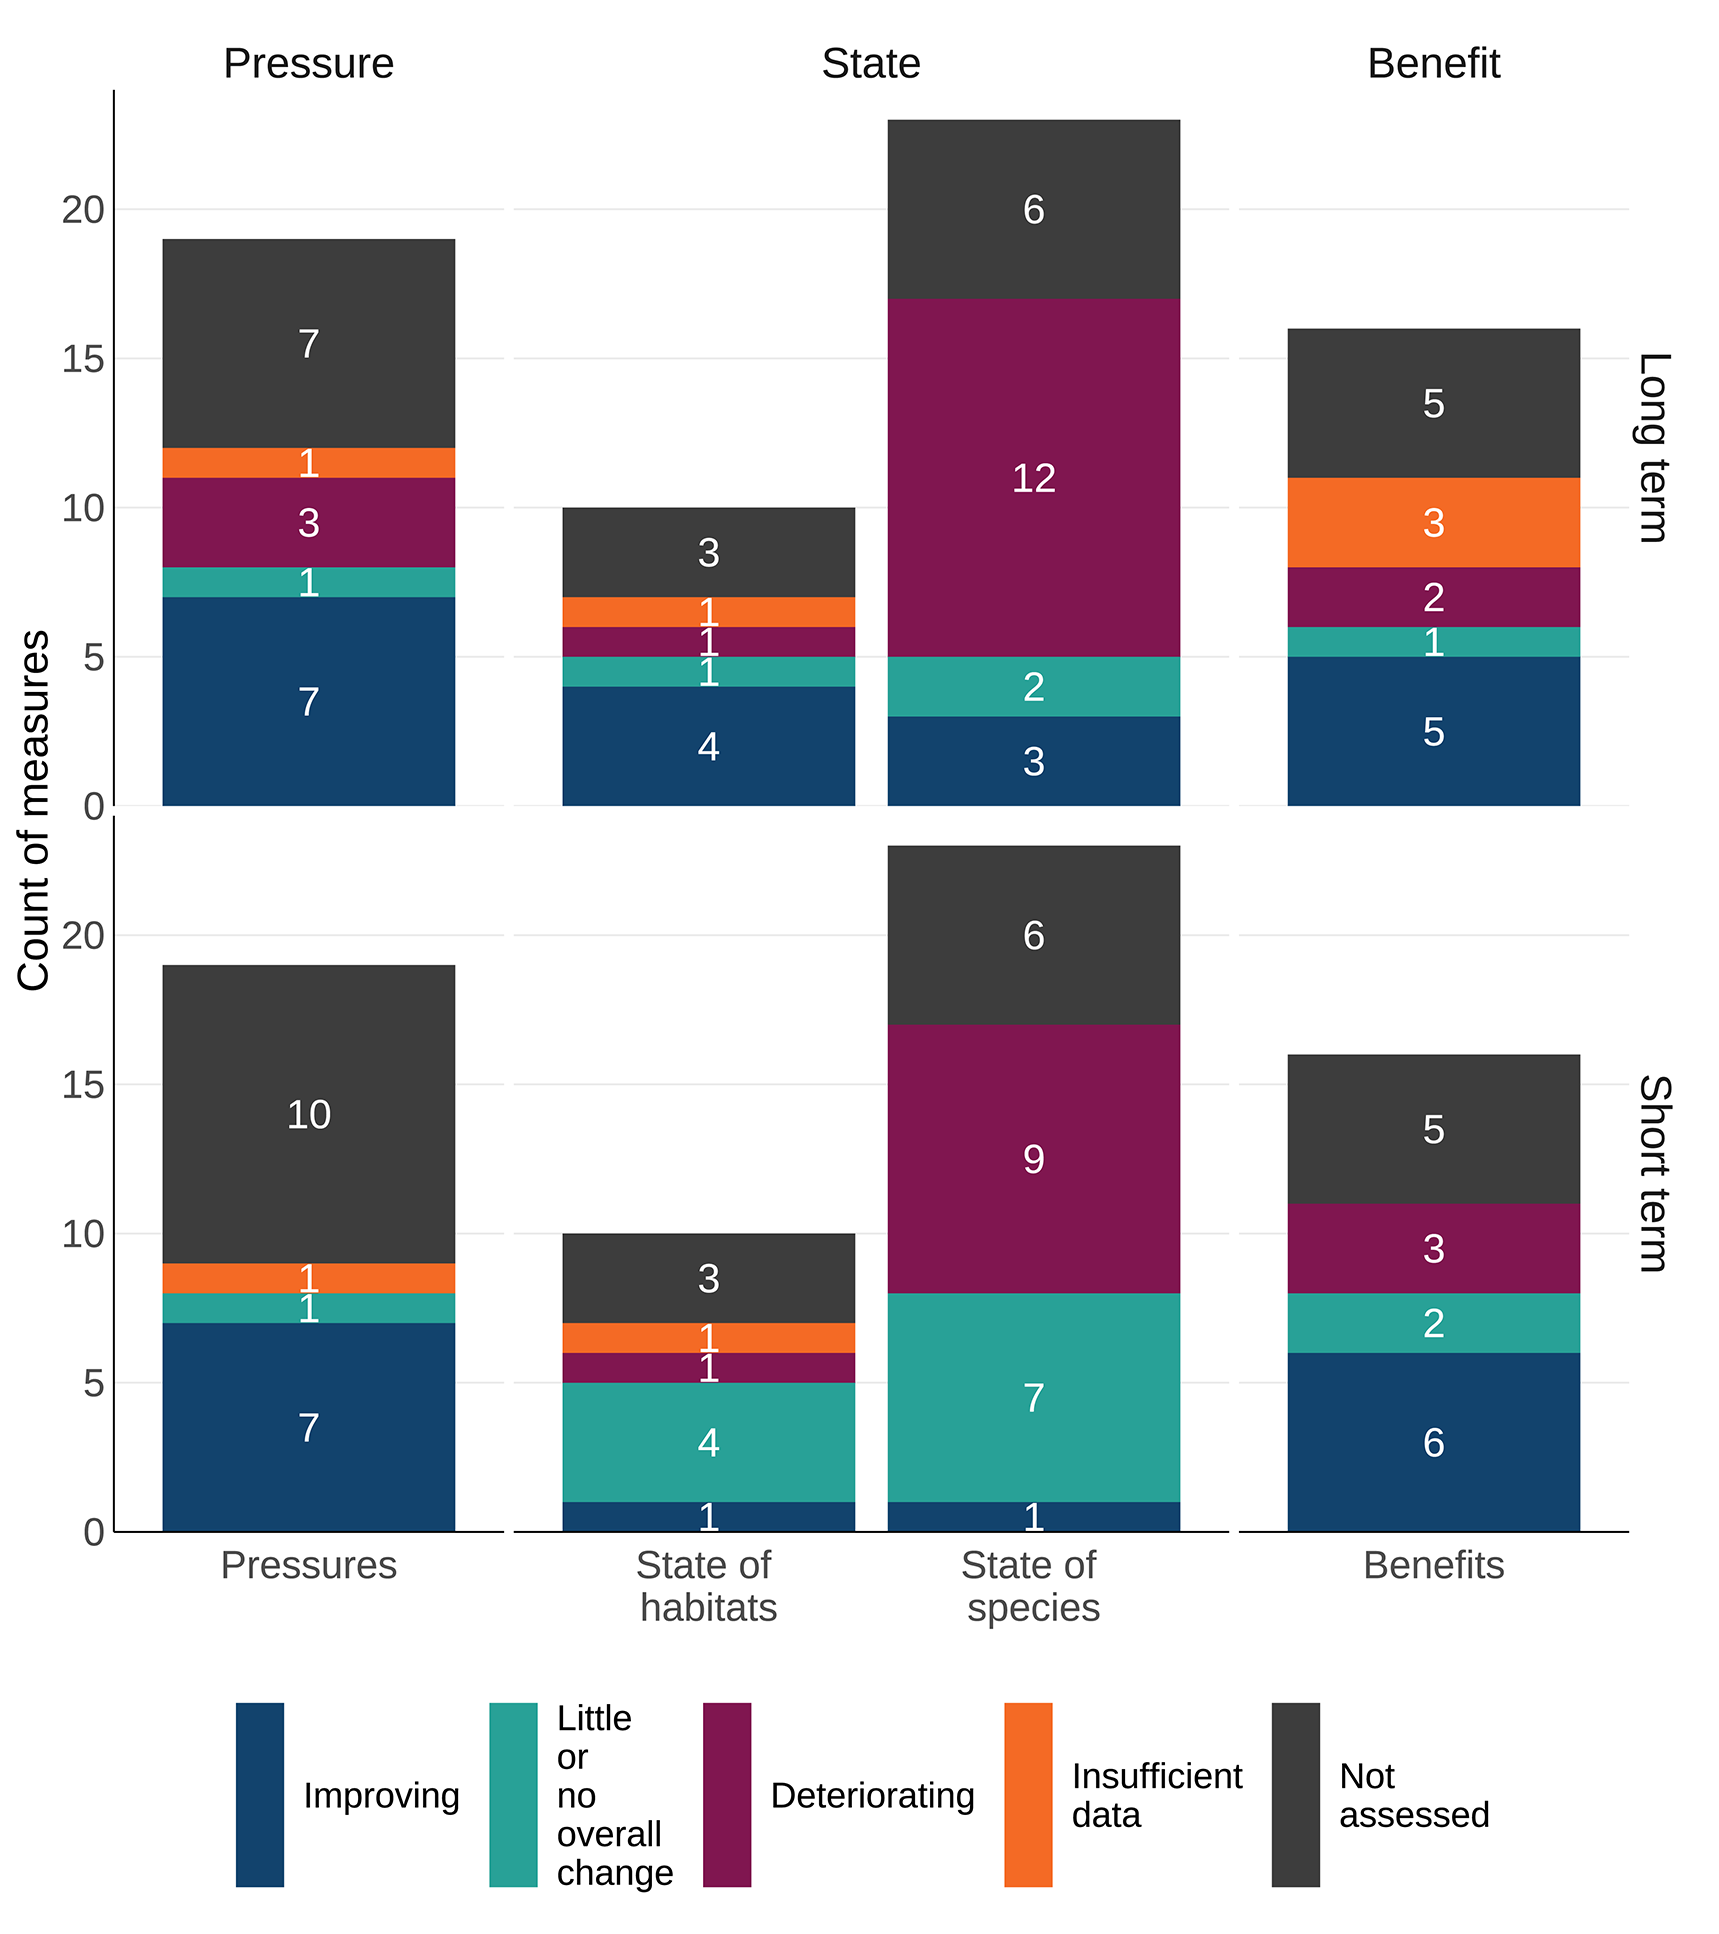
Notes about Figure 2
- Based on 68 measures, which make up 39 indicators.
- Some indicators don’t have enough data to perform a long term (10 years of data) or a short term (5 years of data) assessment of change, and so are categorised as “insufficient data”. Others might still be in development or be otherwise inappropriate for an assessments of change and are classed as “not assessed”.
Assessment of change in extent or condition (state) of natural capital assets
The UK Biodiversity Indicators contain 18 indicators made up of 33 measures which relate to the extent or condition of biodiversity related natural assets. Of these, 23 measures have sufficient data for an assessment of change in either the long or short term.
Tables 1 and 2 shows the assessment results for all those indicators which relate to the extent or condition of biodiversity related natural assets.
In 2025, of those 23 measures which relate to the state of natural capital assets and can be assessed, 13 are deteriorating in the long term, whilst only 7 are improving in the long term. Of those relating to the state of species, only three are improving in the long term, and one in the short term. Of those relating to the state of habitats, four are improving in the long term, and only one in the short term.
There are some signs of positive change across these indicators. Of those 13 indicators which have been deteriorating in the long term, 4 have stabilised in the short term, suggesting a possible halting of the historical decline in the state of the assets these indicators measure. These measures are:
- Relative abundance of priority species
- Relative abundance of breeding birds in woodland
- Relative abundance of breeding upland birds
- Relative abundance of habitat specialist butterflies
There are also some less positive trends in the indicators this year. Of those 7 indicators which have been improving in the long term, 5 have shown no change in the short term, suggesting that historical improvements in the assets these indicators measure might have slowed down or stalled more recently. These measures are:
- Percentage of woodland certified as sustainably managed
- Relative abundance of wintering waterbirds
- Total extent of protected areas on land
- Total extent of protected areas at sea
- Fish stocks harvested within safe limits - biomass of stocks at full reproductive capacity
Of those 13 indicators which have been deteriorating in the long term, 9 are also deteriorating in the short term, suggesting that we are yet to impact the state of the natural assets which these indicators measure. These measures are:
- Relative abundance of all breeding birds
- Relative abundance of breeding birds on farmland
- Relative abundance of breeding seabirds
- Relative abundance of all-species of butterfly
- Relative abundance of farmland specialist butterflies
- Relative abundance of woodland specialist butterflies
- Percentage of habitats of European importance in favourable or improving conservation status
- Percentage of species of European importance in favourable or improving conservation status
- Fish size classes in the North Sea
Two indicators are improving in both the long and short term:
- Area of land under higher-level or targeted agri-environment schemes
- Relative abundance of bat populations
Assessment of change in pressures on natural capital assets
The UK Biodiversity Indicators contain 13 indicators made up of 19 measures which relate to the pressures on biodiversity related natural assets. Of these, 11 have sufficient data for an assessment of change in either the long or short term.
Table 3 shows the assessment results for all those indicators which relate to the pressures on biodiversity related natural assets.
In 2025, of those 11 measures which relate to the state of natural capital assets and can be assessed, 7 are improving, 1 is showing little change and none are deteriorating in the long term.
There are some signs of positive change across these indicators. Of the 7 indicators which have been improving in the long term, 7 are also improving in the short term, suggesting that we have maintained positive progress for:
- Public sector expenditure on biodiversity in the UK
- Non-governmental organisation and private sector spending on biodiversity in the UK
- Area of deforestation worldwide associated with UK consumption
- Air pollution - area affected by acidity
- Air pollution - area affected by nutrient nitrogen deposition
- Combined input of hazardous substances into the UK marine environment
- Percentage of fish stocks harvested sustainably
The 1 indicator which has been showing no change in the long term is also showing no change in the short term, suggesting that we are yet to reduce the pressure this indicator measures:
- Pressure from invasive species - rate of establishment
The indicators of number of invasive species established (terrestrial, freshwater and coastal) are all assessed as deteriorating in the long term, but are not assessed in the short term due to lags in data collection.
Assessment of change in the benefits associated with natural capital assets
The UK Biodiversity Indicators contain 9 indicators made up of 16 measures which relate to the benefits associated with natural capital assets. Of these, 11 have sufficient data for an assessment of change in either the long or short term.
Table 4 shows the assessment results for all those indicators which relate to the benefits associated with biodiversity related natural assets.
In 2025, of those 11 measures which relate to the benefits associated with natural capital assets and can be assessed, 5 are improving in the long term. 3 of these remain improving in the short term, suggesting we have maintained positive progress in the areas of:
- Cumulative net removals of greenhouse gases by UK forests
- Status of ex situ conservation of cultivated plants and their wild relatives
- Conservation volunteering
Of those 5 indicators which have been improving in the long term, 1 has deteriorated in the short term, suggesting that previous improvements in the assets these indicators measure may be lost. This measure is:
- Animal genetic resources - sheep breeds
One indicator is improving in the long term, but showing no change in the short term:
- Animal genetic resources - cattle breeds
Assessment results tables
Table 1. Assessment of change in extent or condition (state) of natural capital assets - species
| Indicator | Measure | Long term period | Long term | Short term period | Short term |
|---|---|---|---|---|---|
| Fish size classes in the North Sea | Fish size in the North Sea | 1983 to 2020 | Deteriorating | 2015 to 2020 | Deteriorating |
| Birds of the wider countryside and at sea | All bird species | 1970 to 2024 | Deteriorating | 2019 to 2024 | Deteriorating |
| Birds of the wider countryside and at sea | Breeding birds on farmland | 1970 to 2024 | Deteriorating | 2019 to 2024 | Deteriorating |
| Birds of the wider countryside and at sea | Breeding birds in woodland | 1970 to 2024 | Deteriorating | 2019 to 2024 | Little or no overall change |
| Birds of the wider countryside and at sea | Breeding wetland birds | 1975 to 2024 | Little or no overall change | 2019 to 2024 | Deteriorating |
| Birds of the wider countryside and at sea | Breeding seabirds | 1986 to 2024 | Deteriorating | 2019 to 2024 | Deteriorating |
| Birds of the wider countryside and at sea | Wintering waterbirds | 1975/1976 to 2023/2024 | Improving | 2018/2019 to 2023/2024 | Little or no overall change |
| Birds of the wider countryside and at sea | Breeding upland birds | 1994 to 2024 | Deteriorating | 2019 to 2024 | Little or no overall change |
| Insects of the wider countryside (butterflies) | All species of butterfly | 1976 to 2024 | Deteriorating | 2014 to 2024 | Deteriorating |
| Insects of the wider countryside (butterflies) | Habitat specialist butterflies | 1990 to 2024 | Deteriorating | 2014 to 2024 | Little or no overall change |
| Insects of the wider countryside (butterflies) | Generalist butterflies | 1990 to 2024 | Little or no overall change | 2014 to 2024 | Little or no overall change |
| Insects of the wider countryside (butterflies) | Farmland specialist butterflies | 1990 to 2024 | Deteriorating | 2014 to 2024 | Deteriorating |
| Insects of the wider countryside (butterflies) | Woodland specialist butterflies | 1990 to 2024 | Deteriorating | 2014 to 2024 | Deteriorating |
| Mammals of the wider countryside (bats) | Change in the abundance of bat populations | 1999 to 2023 | Improving | 2018 to 2023 | Improving |
| Plants of the wider countryside in the UK | Arable field margins | Not assessed | Not assessed | ||
| Plants of the wider countryside in the UK | Bog and wet heath | Not assessed | Not assessed | ||
| Plants of the wider countryside in the UK | Broadleaved woodland and hedges | Not assessed | Not assessed | ||
| Plants of the wider countryside in the UK | Lowland grassland | Not assessed | Not assessed | ||
| Status of priority species: distribution | Priority species distribution | Not assessed | Not assessed | ||
| Status of priority species: relative abundance | Priority species abundance | 1970 to 2023 | Deteriorating | 2018 to 2023 | Little or no overall change |
| Status of threatened species: species of European importance | Conservation status of species of European importance | 2007 to 2019 | Deteriorating | 2013 to 2019 | Deteriorating |
| Sustainable fisheries: fish stocks harvested within safe limits | Biomass of stocks at full reproductive capacity | 1990 to 2020 | Improving | 2015 to 2020 | Little or no overall change |
| Genetic diversity of wild species | Proportion of populations above Ne of 500 | Not assessed | Not assessed |
Table 2. Assessment of change in extent or condition (state) of natural capital assets - habitats
| Indicator | Measure | Long term period | Long term | Short term period | Short term |
|---|---|---|---|---|---|
| Area of forestry land certified as sustainably managed | Percentage of woodland certified as sustainably managed | 2001 to 2025 | Improving | 2020 to 2025 | Little or no overall change |
| Area of land in agri-environment schemes | Area of land under higher-level or targeted agri-environment schemes | 1992 to 2022 | Improving | 2017 to 2022 | Improving |
| Extent and condition of protected areas | Total extent of protected areas on land | 1950 to 2025 | Improving | 2020 to 2025 | Little or no overall change |
| Extent and condition of protected areas | Total extent of protected areas at sea | 1950 to 2025 | Improving | 2020 to 2025 | Little or no overall change |
| Extent and condition of protected areas | Condition of Areas or Sites of Special Scientific Interest | Insufficient data | Insufficient data | ||
| Habitat connectivity | Habitat connectivity | Not assessed | Not assessed | ||
| Status of threatened habitats: habitats of European importance | Conservation status of habitats of European importance | 2007 to 2019 | Deteriorating | 2013 to 2019 | Deteriorating |
| Surface water status | Percentage of UK surface water bodies in High or Good ecological status | 2009 to 2024 | Little or no overall change | 2019 to 2024 | Little or no overall change |
| Extent of natural ecosystems | UK land and sea areas covered by natural ecosystems | Not assessed | Not assessed | ||
| Red List of Ecosystems | Red List of Ecosystems | Not assessed | Not assessed |
Table 3. Assessment of change in pressures on natural capital assets
| Indicator | Measure | Long term period | Long term | Short term period | Short term |
|---|---|---|---|---|---|
| Expenditure on UK and international biodiversity | Public sector expenditure on biodiversity in the UK | 2000/2001 to 2023/2024 | Improving | 2018/2019 to 2023/2024 | Improving |
| Expenditure on UK and international biodiversity | Non-governmental organisation and private sector spending on biodiversity in the UK | 2010/2011 to 2023/2024 | Improving | 2018/2019 to 2023/2024 | Improving |
| Expenditure on UK and international biodiversity | UK public sector expenditure on international biodiversity | Not assessed | Not assessed | ||
| Global biodiversity impacts of UK economic activity / sustainable consumption | Area of deforestation worldwide associated with UK consumption | 2005 to 2023 | Improving | 2018 to 2023 | Improving |
| Integration of biodiversity considerations into business activity | Proportion of medium and large UK businesses with ISO 14001 certification | Not assessed | Not assessed | ||
| Air Pollution: Area affected by acidity and area affected by nitrogen | Air pollution: area affected by acidity | 2003 to 2021 | Improving | 2016 to 2021 | Improving |
| Air Pollution: Area affected by acidity and area affected by nitrogen | Air pollution: area affected by nutrient nitrogen deposition | 2003 to 2021 | Improving | 2016 to 2021 | Improving |
| Pressure from invasive species | Number of terrestrial species establishments | 1969 to 2024 | Deteriorating | Not assessed | |
| Pressure from invasive species | Number of freshwater species establishments | 1969 to 2024 | Deteriorating | Not assessed | |
| Pressure from invasive species | Number of marine (coastal) species establishments | 1969 to 2024 | Deteriorating | Not assessed | |
| Pressure from invasive species | Rate of establishment | 1920 to 2022 | Little or no overall change | 2017 to 2022 | Little or no overall change |
| Marine pollution | Combined input of hazardous substances into the UK marine environment | 1990 to 2019 | Improving | 2014 to 2019 | Improving |
| Awareness, understanding and support for conservation | Awareness, understanding and support for conservation | Insufficient data | Insufficient data | ||
| Spring index | Timing of spring events | Not assessed | Not assessed | ||
| Sustainable fisheries: fish stocks harvested within safe limits | Percentage of fish stocks harvested sustainably | 1990 to 2020 | Improving | 2015 to 2020 | Improving |
| Aggregated total applied toxicity | Normalised aggregated total applied toxicity for arable crops | Not assessed | Not assessed | ||
| The number of companies disclosing their biodiversity-related risks, dependencies and impacts | Companies reporting to TNFD Year by Year | Not assessed | Not assessed | ||
| Positive incentives in place to promote biodiversity conservation and sustainable use | Number of active instruments in the UK per year that represent positive incentives to promote the conservation and sustainable use of biodiversity | Not assessed | Not assessed | ||
| Value of subsidies and other incentives harmful to biodiversity | Total value of subsidies screened as harmful to environmental objectives | Not assessed | Not assessed |
Table 4. Assessment of change in the benefits associated with natural capital assets
| Indicator | Measure | Long term period | Long term | Short term period | Short term |
|---|---|---|---|---|---|
| Animal genetic resources: effective population size of Native Breeds at Risk | Goat breeds | 2004 to 2024 | Little or no overall change | 2019 to 2024 | Deteriorating |
| Animal genetic resources: effective population size of Native Breeds at Risk | Pig breeds | 2000 to 2024 | Deteriorating | 2019 to 2024 | Deteriorating |
| Animal genetic resources: effective population size of Native Breeds at Risk | Horse breeds | 2000 to 2024 | Deteriorating | 2019 to 2024 | Little or no overall change |
| Animal genetic resources: effective population size of Native Breeds at Risk | Sheep breeds | 2000 to 2024 | Improving | 2019 to 2024 | Deteriorating |
| Animal genetic resources: effective population size of Native Breeds at Risk | Cattle breeds | 2000 to 2024 | Improving | 2019 to 2024 | Little or no overall change |
| Removal of greenhouse gases by UK forests | Cumulative net removals of greenhouse gases by UK forests | 1990 to 2023 | Improving | 2018 to 2023 | Improving |
| Status of pollinating insects | Change in the distribution pollinators in the UK | Not assessed | Not assessed | ||
| Biodiversity data for decision making | Cumulative number of records in the National Biodiversity Network | Not assessed | Not assessed | ||
| Biodiversity data for decision making | Number of publicly accessible records at 1 square kilometre resolution or better | Not assessed | Not assessed | ||
| Biodiversity information for conservation decision making | Number of records downloaded | Insufficient data | 2019 to 2024 | Improving | |
| Biodiversity information for conservation decision making | Number of download events | Insufficient data | 2019 to 2024 | Improving | |
| Biodiversity information for conservation decision making | Number of NBN Atlas users | Insufficient data | 2019 to 2024 | Improving | |
| Plant genetic resources - Enrichment Index | Status of ex situ conservation of cultivated plants and their wild relatives (Cumulative Enrichment Index) | 1960 to 2018 | Improving | 2013 to 2018 | Improving |
| Taking action for the environment: volunteer time spent in conservation | Conservation volunteering | 2000 to 2023 | Improving | 2018 to 2023 | Improving |
| Green and blue space in built-up areas | Proportion of urban areas which is publicly accessible green and blue space | Not assessed | Not assessed | ||
| Services provided by ecosystems | Index of services provided by ecosystems | Not assessed | Not assessed |
Categories:
Published: